
Last Week’s Reports
Economic Reports
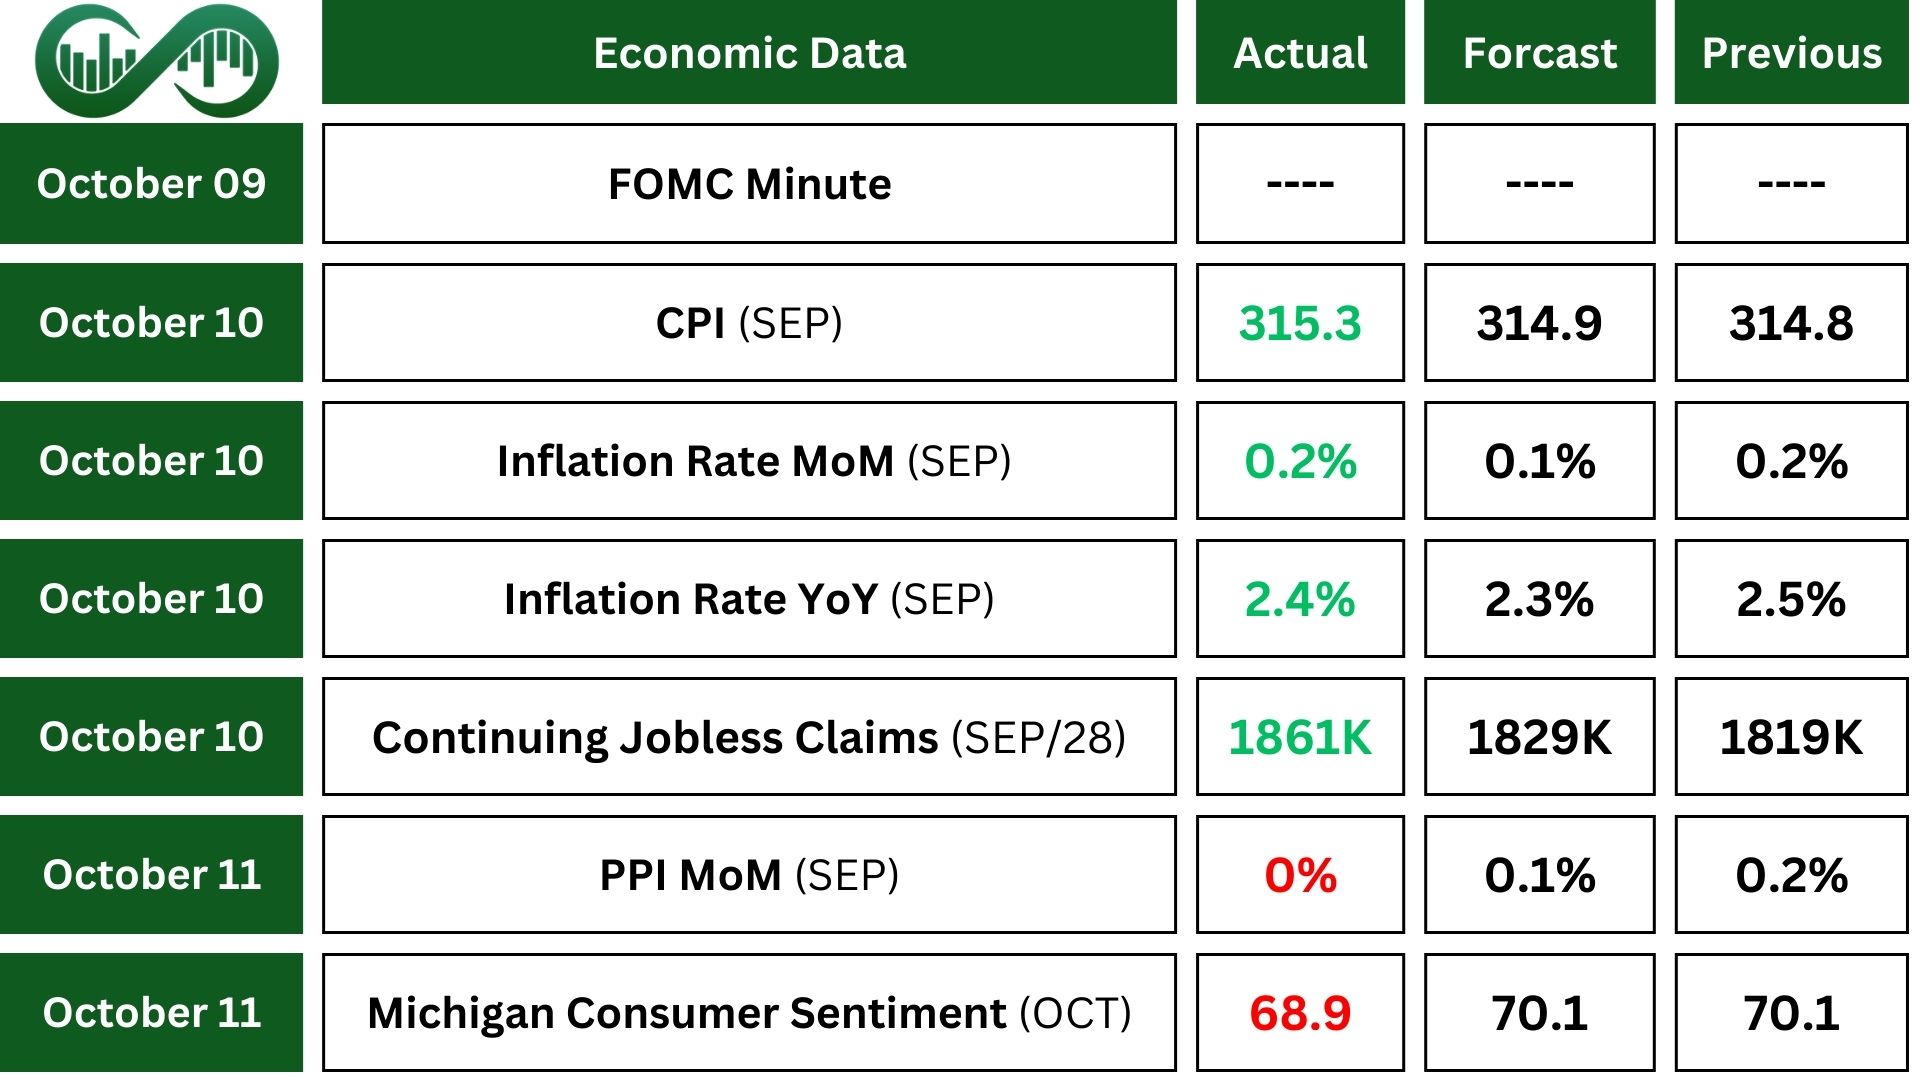
The FOMC Minute report revealed that the committee decided to lower the federal funds rate target range to 4.75% to 5% due to progress on inflation and balanced risks. That decision was backed by the majority vote. Just one member, Governor Bowman dissented, preferring a higher range of 5% to 5.25%. The Committee will monitor incoming data and the economic outlook for future rate adjustments.
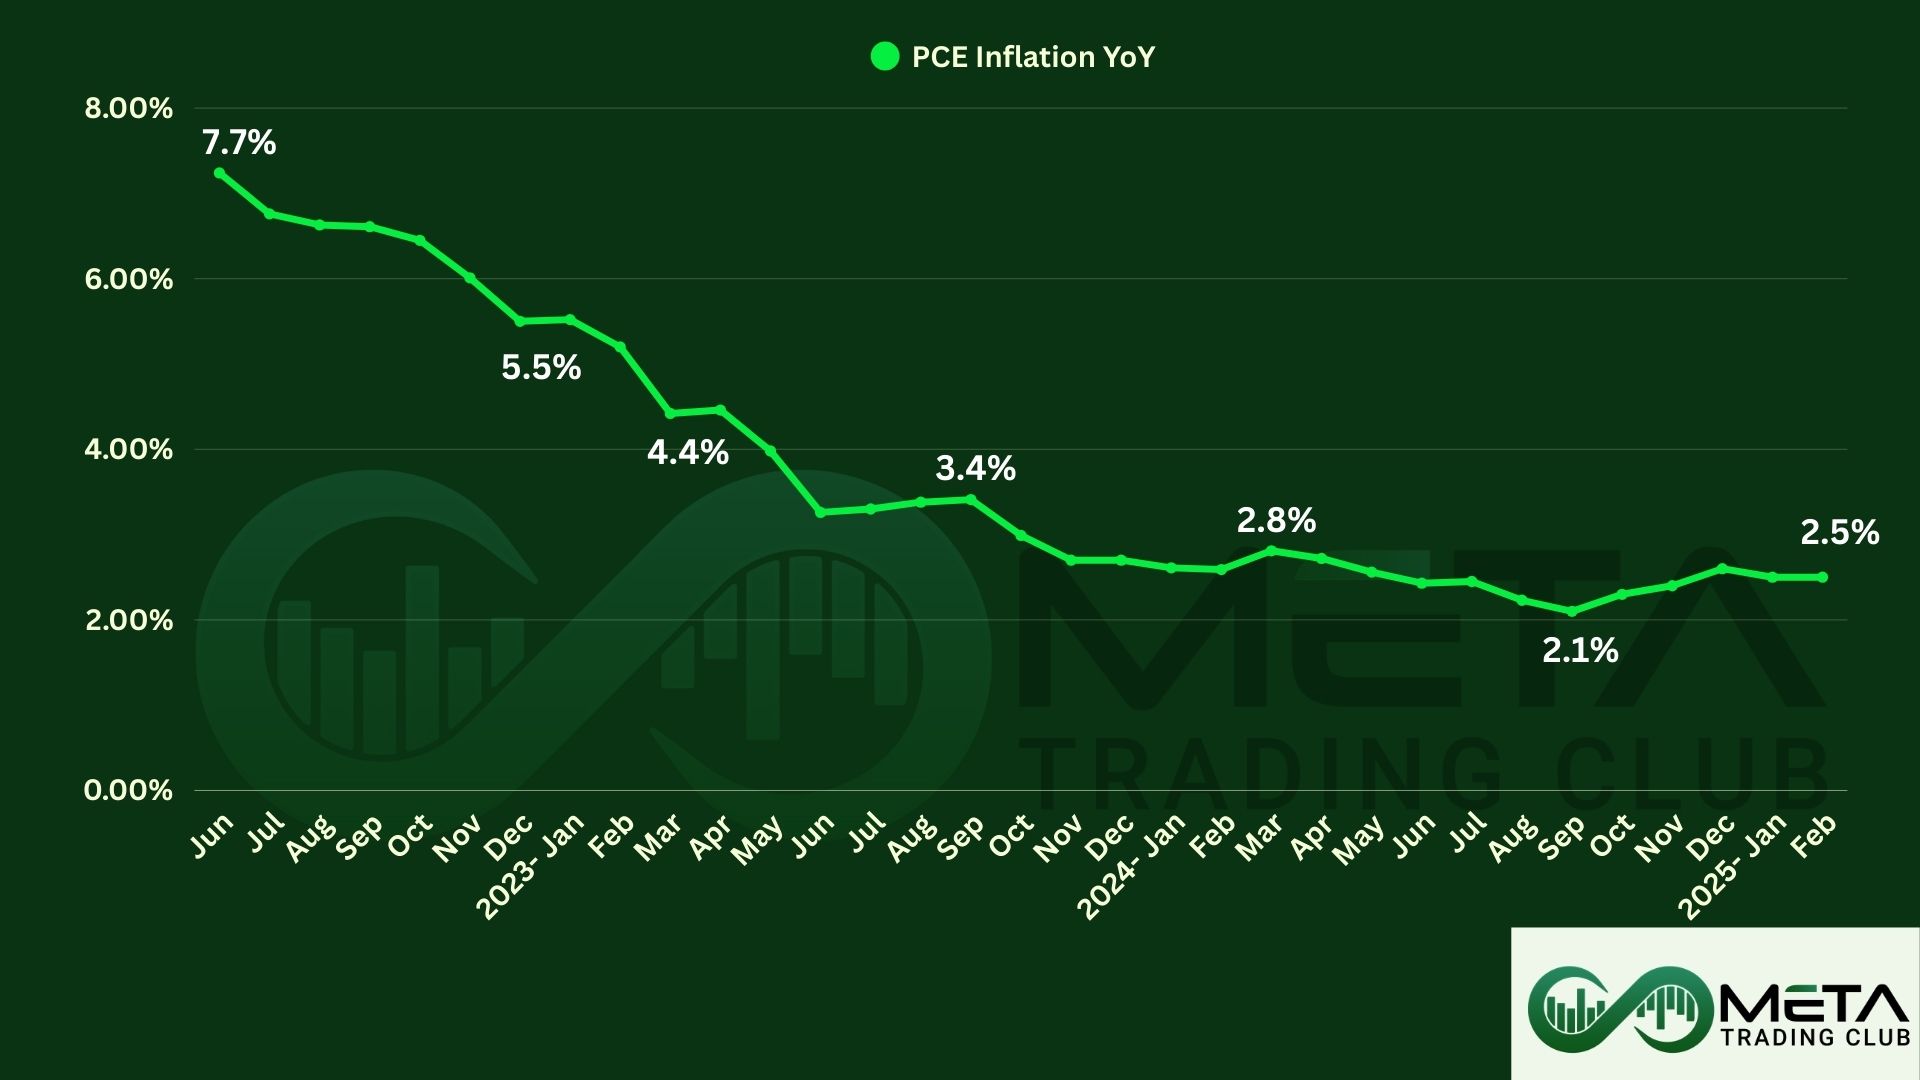
On Thursday, the September inflation report was released and showed a continued cooling trend. The Consumer Price Index (CPI) rose by 2.4% year-over-year , slightly higher than the forecasted 2.3%. This marks the lowest annual inflation rate since February 2021.
Core inflation, which excludes food and energy, was at 3.3% YoY, also above the forecasted 3.2%. Also, the monthly CPI increased by 0.2%, consistent with the previous months.
On Friday, the September Producer Price Index (PPI) for final demand was released and was unchanged on a monthly basis. However, the annual PPI rose by 1.8%, which was higher than the forecasted 1.6%. The core PPI, which excludes food and energy, increased by 2.8% year-over-year, surpassing the forecasted 2.7%.
The slightly higher-than-expected CPI and PPI data for September have raised concerns about persistent inflation, which can lead to higher interest rates. This has caused some volatility in the stock market, as investors worry about the impact on corporate profits and consumer spending.
The October Michigan consumer sentiment index fell to 68.9, down from 70.1 in September. This decline was slightly below economists’ expectations of 70.8. The decline in this report suggests that consumers are feeling less optimistic about the economy. This can weaken demand for goods and services, potentially impacting corporate earnings and stock prices.
Earning Reports
Pepsi
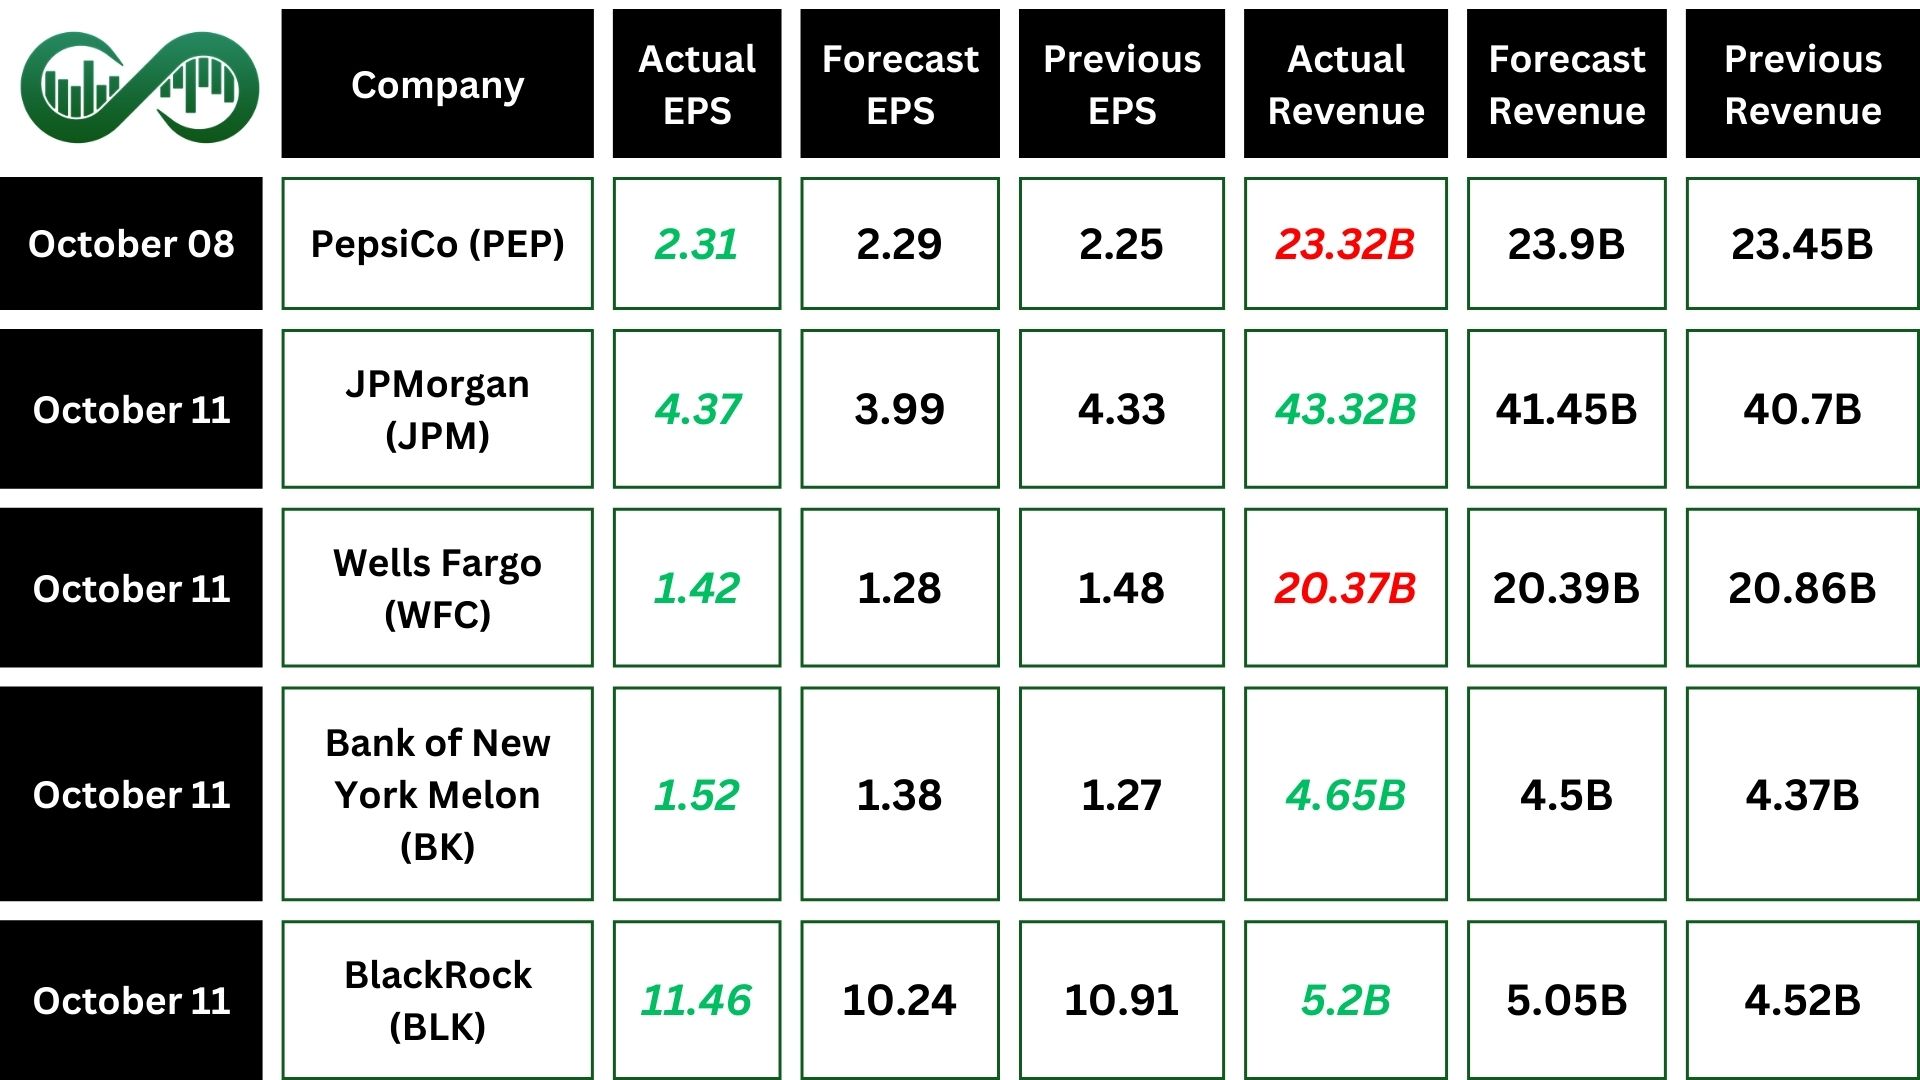
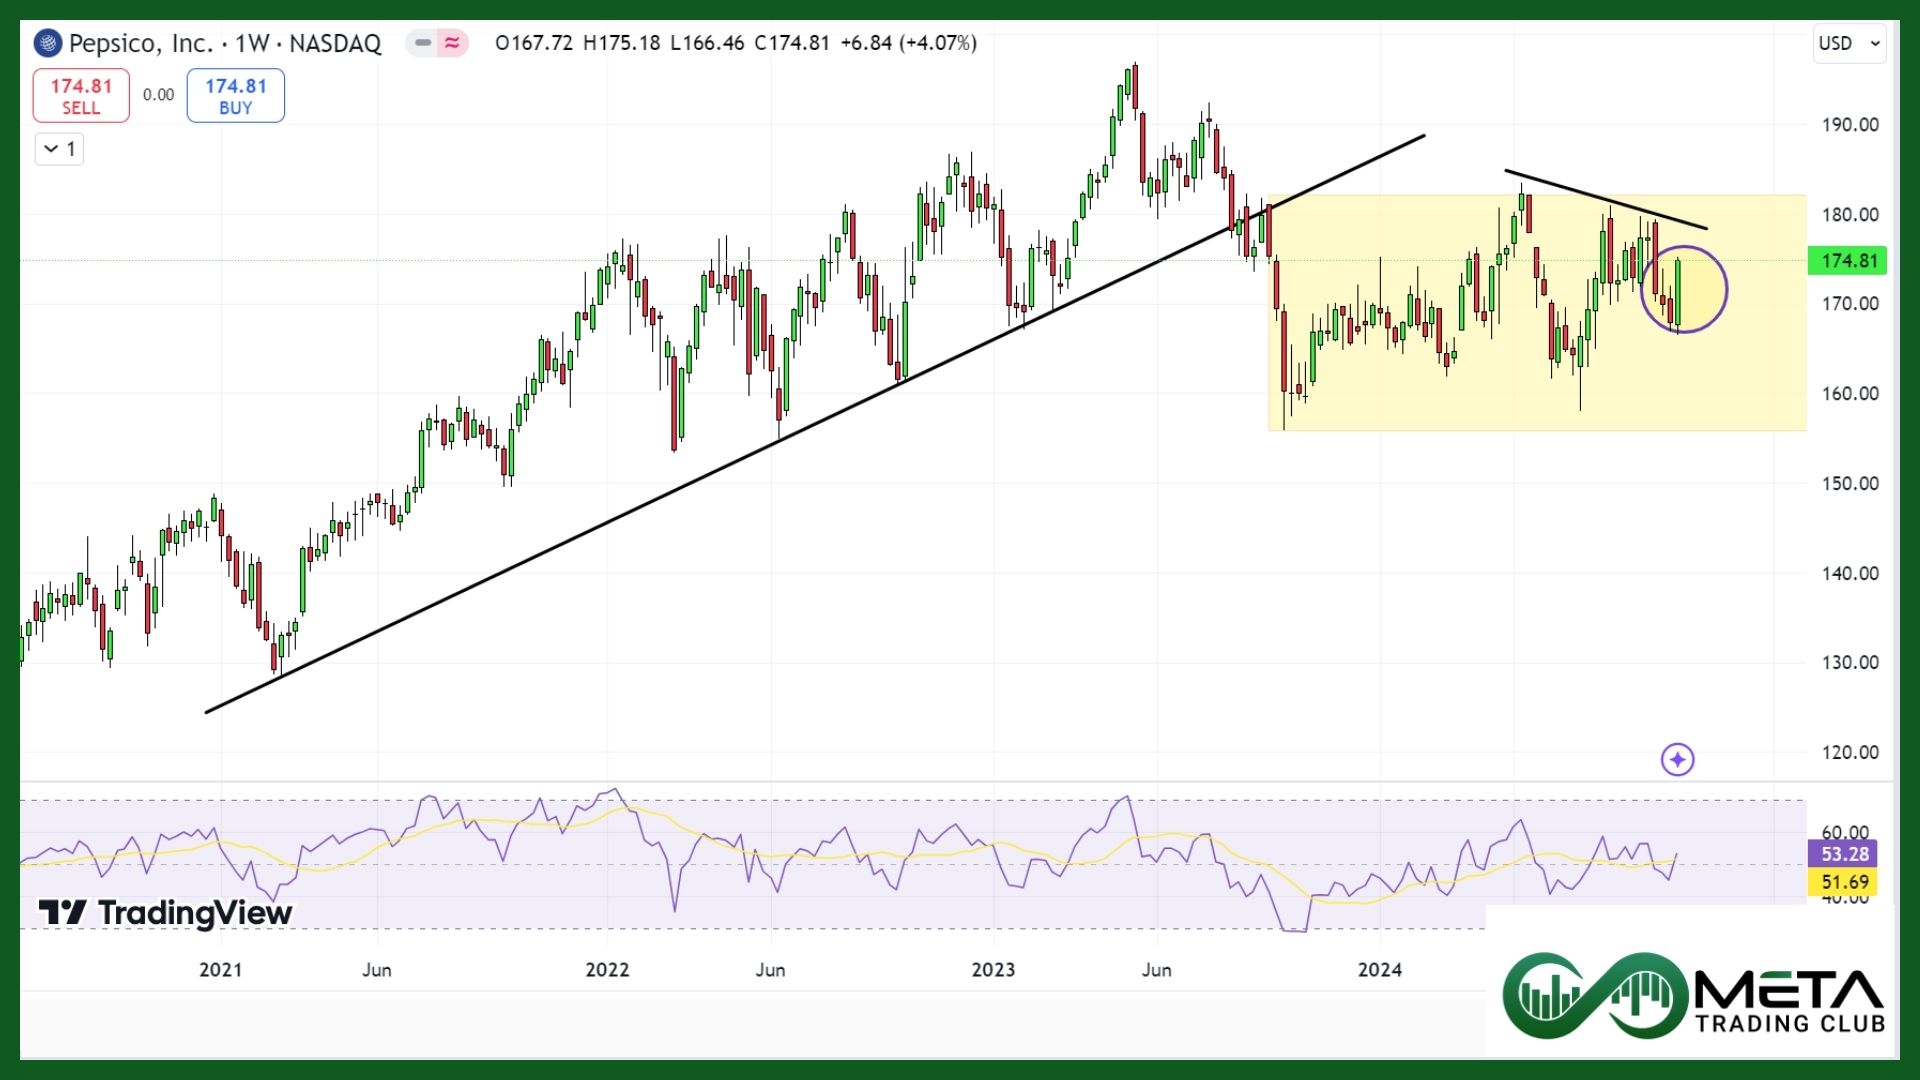
In Q3 2024, PepsiCo reported revenue of $23.32 billion, slightly below the forecasted $23.9 billion. The company’s adjusted earnings per share (EPS) came in at $2.31, just above the forecasted $2.29. Despite the revenue miss, PepsiCo’s earnings exceeded expectations, showcasing its ability to manage costs effectively.
Net revenue declined by 0.6% year-over-year to $23.32 billion. However, the company saw strong performance in international markets, which was offset by weaker sales in North America. The annual sales forecast was revised to low-single-digit growth due to changing consumer spending patterns. Also, gross margin improved by 94 basis points, the operating margin shrank by 51 basis points.
After PepsiCo reported its Q3 2024 earnings, the stock price surged 5% after earnings and through the week. In the weekly time frame, PepsiCo’s stock (NASDAQ: PEP) shows a neutral to slightly bearish trend. The stock is trading within a narrow range, with key moving averages acting as resistance.
JPMorgan
In Q3 2024, JPMorgan Chase reported a revenue of $43.3 billion, surpassing the forecasted $41.45 billion. The bank’s adjusted earnings per share (EPS) came in at $4.37, slightly above expectations. Despite a year-over-year drop in profit, JPMorgan’s strong performance in investment banking and asset management drove growth.
Investment Banking fees increased by 31% year-over-year, while Assets Under Management (AUM) reached $3.9 trillion, reflecting a 23% growth. Also, Net interest income rose by 3% year-over-year. Meanwhile, Corporate revenue experienced a significant surge, increasing by 97% year-over-year.
After JPMorgan Chase reported its Q3 earnings, the stock price surged by nearly 5%. Investors reacted positively to the strong earnings results, particularly the higher-than-expected revenue and EPS, as well as the impressive performance in investment banking and asset management.
In the daily time frame, JPMorgan Chase (NYSE: JPM) stock shows a slightly bullish trend. The stock is reaching all time high resistance, with key resistance levels around $225.

BlackRock
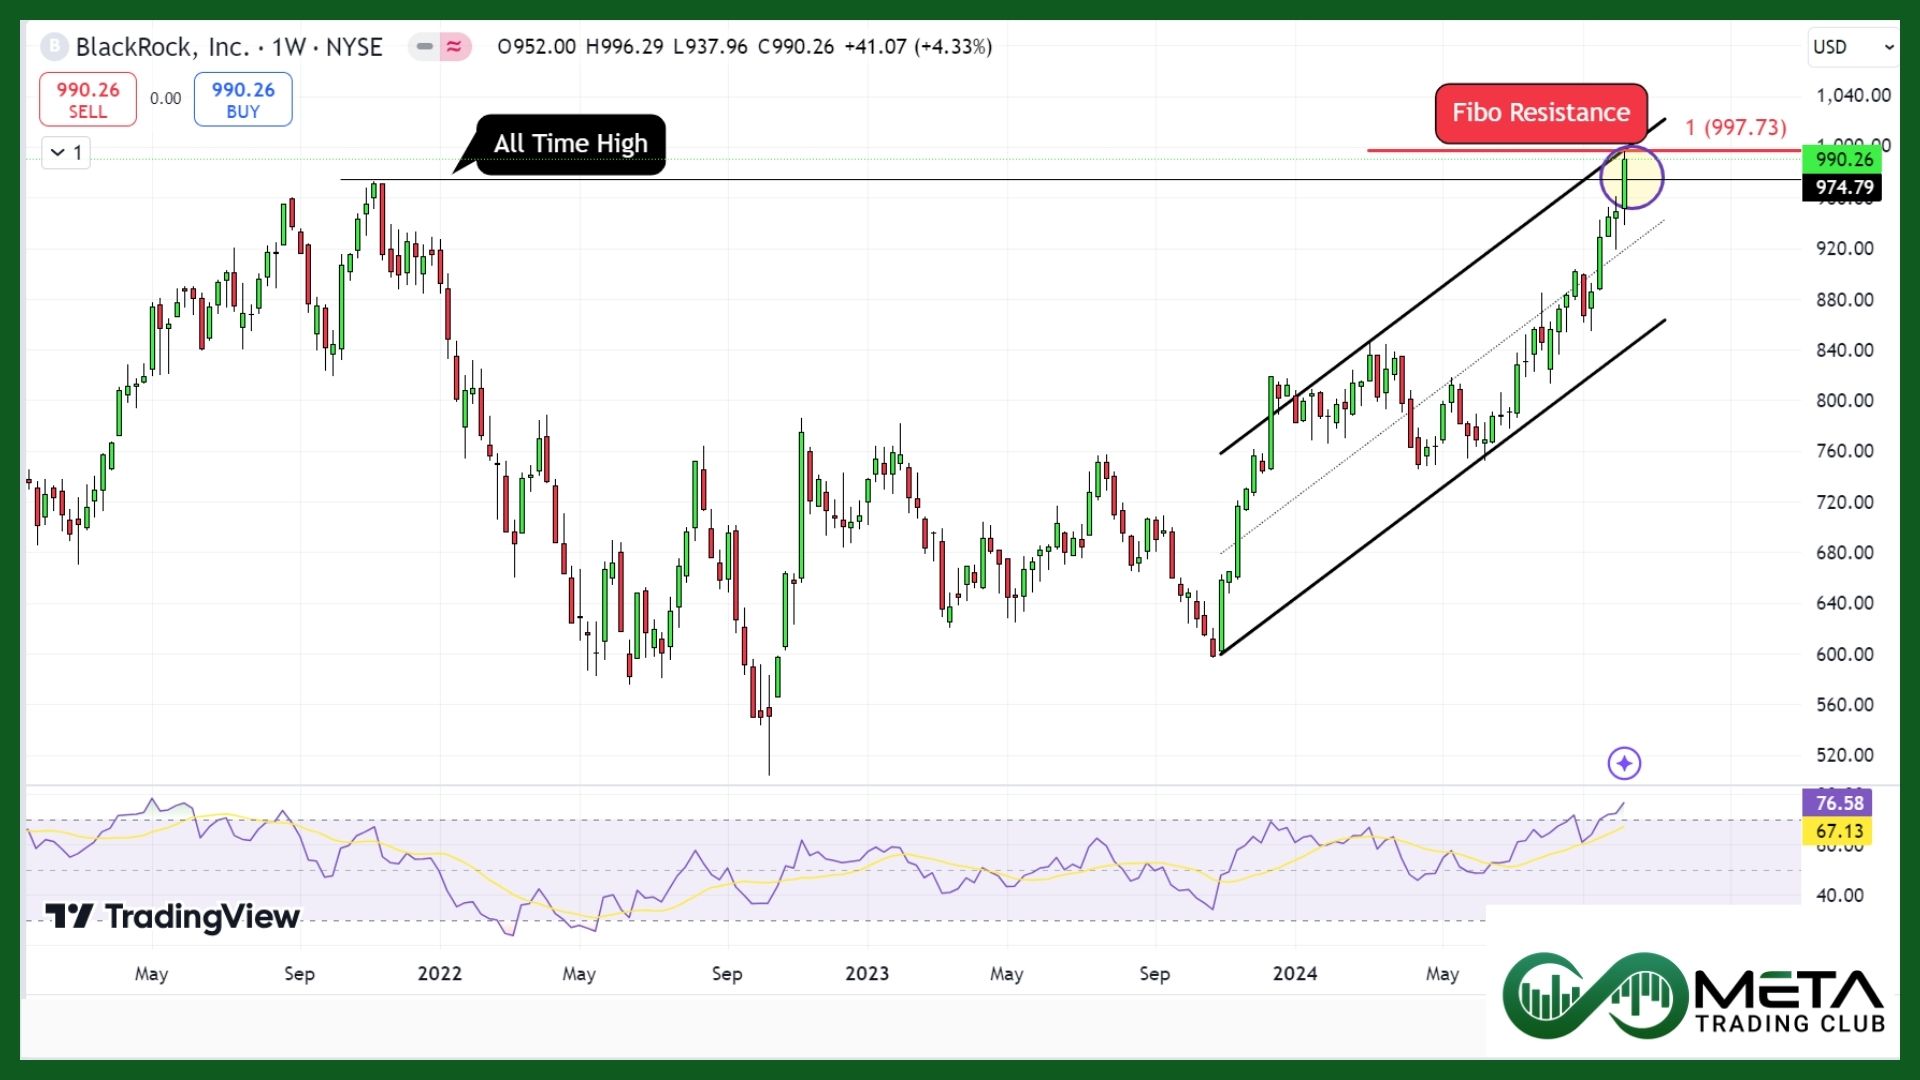
In Q3, BlackRock reported revenue of $5.2 billion, surpassing the forecasted $5 billion. The company’s adjusted earnings per share (EPS) came in at $11.46, exceeding the forecasted $10.24. BlackRock’s strong performance was driven by broad-based net inflows and positive market movements.
In the latest quarter, BlackRock achieved record net inflows of $221 billion, reflecting an 8% annualized organic asset growth. This impressive inflow brought their Assets Under Management (AUM) to an all-time high of $11.5 trillion. Additionally, the company reported a 15% increase in revenue year-over-year, driven by organic base fee growth and higher performance fees.
After BlackRock reported its Q3 2024 earnings, the stock price rose by approximately 2.1%. Investors reacted positively to the strong earnings results, particularly the higher-than-expected revenue and EPS, as well as the impressive growth in assets under management (AUM).
In the daily time frame, BlackRock (NYSE: BLK) stock shows a bullish trend. The stock is closed above all time high, with key resistance levels around $997. Key technical indicators like the RSI suggest a potential for upward movement if the stock can remain above last all-time high.
Indices
Indices’ Weekly Performance:
The stock market showed strong performance across major indices, with the S&P 500 rising by 1.11% to close at 5,815. The Dow Jones surged by 1.21%, ending the week at 42,864, and the Nasdaq increased by 1.18%, finishing at 20,272.
The S&P 500 recently hit an all-time high, this marks the 45th record high for the index in 2024. The stock market has shown resilience and reached record highs recently. Although, last week’s economic indicators highlight the ongoing challenges and uncertainties that investors are navigating.
The S&P 500 recently surpassed a $50 trillion market value, reaching a historic milestone. This marks a significant achievement, reflecting the strong performance of the U.S. stock market. The index has grown 50 times since the start of the bull market in 1982. The rise was driven by substantial gains in major tech stocks, with the index up 21% so far this year.
S&P 500 Long-Term Analysis:
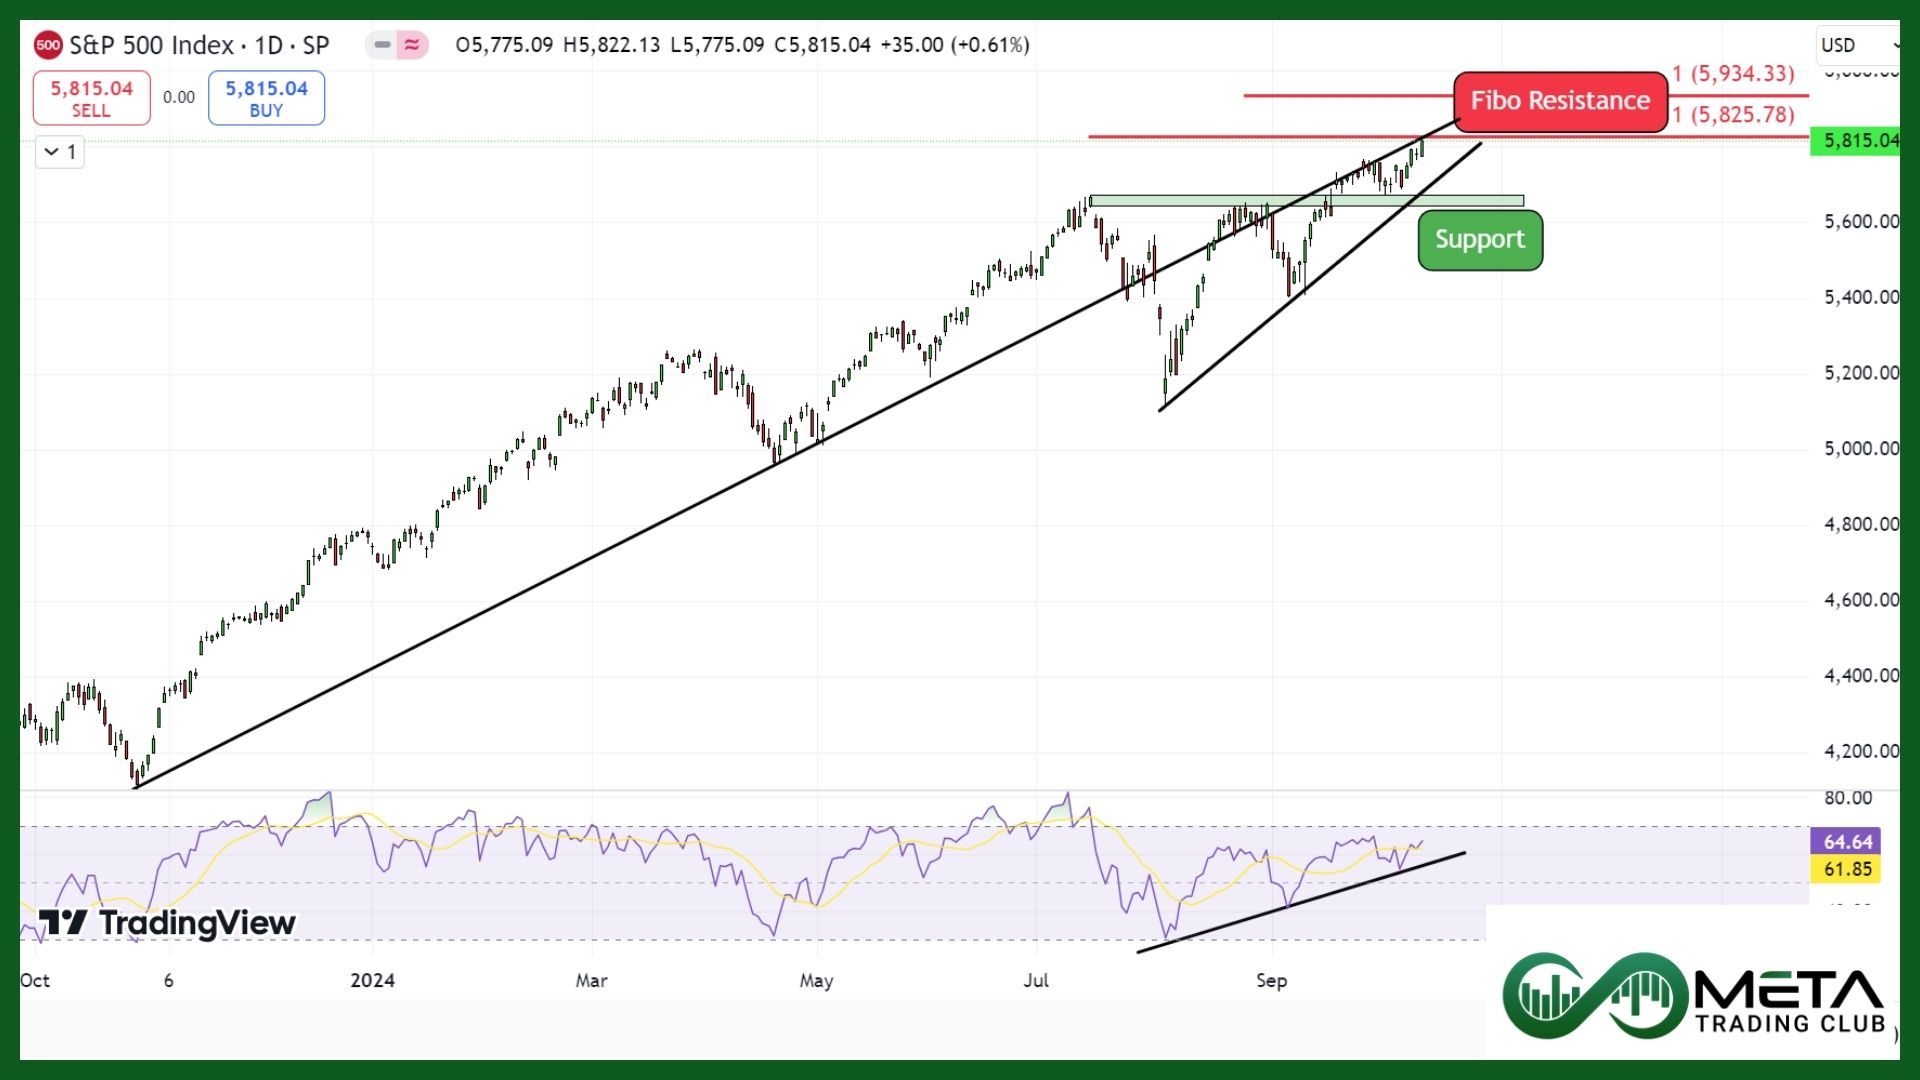
The S&P 500 has been on a strong upward trend, consistently breaking through resistance levels and reaching new highs. The index is currently indicating positive market sentiment and increasing investor interest. Key support levels are around 5660 points, and there is no immediate static resistance on the price chart, suggesting the potential for further gains. However, investors should remain cautious of potential pullbacks and monitor economic indicators closely.
S&P 500 Short-Term Analysis:
The S&P 500 has recently broken the floor of its rising trend channel, indicating a potential weakening in its initial upward momentum. Also, there is a Fibonacci extension resistance ahead of S&P 500 index. However, if the index faces a negative reaction, it has support around 5660 points.
Stocks
Stock Market Sector’s Weekly Performance:
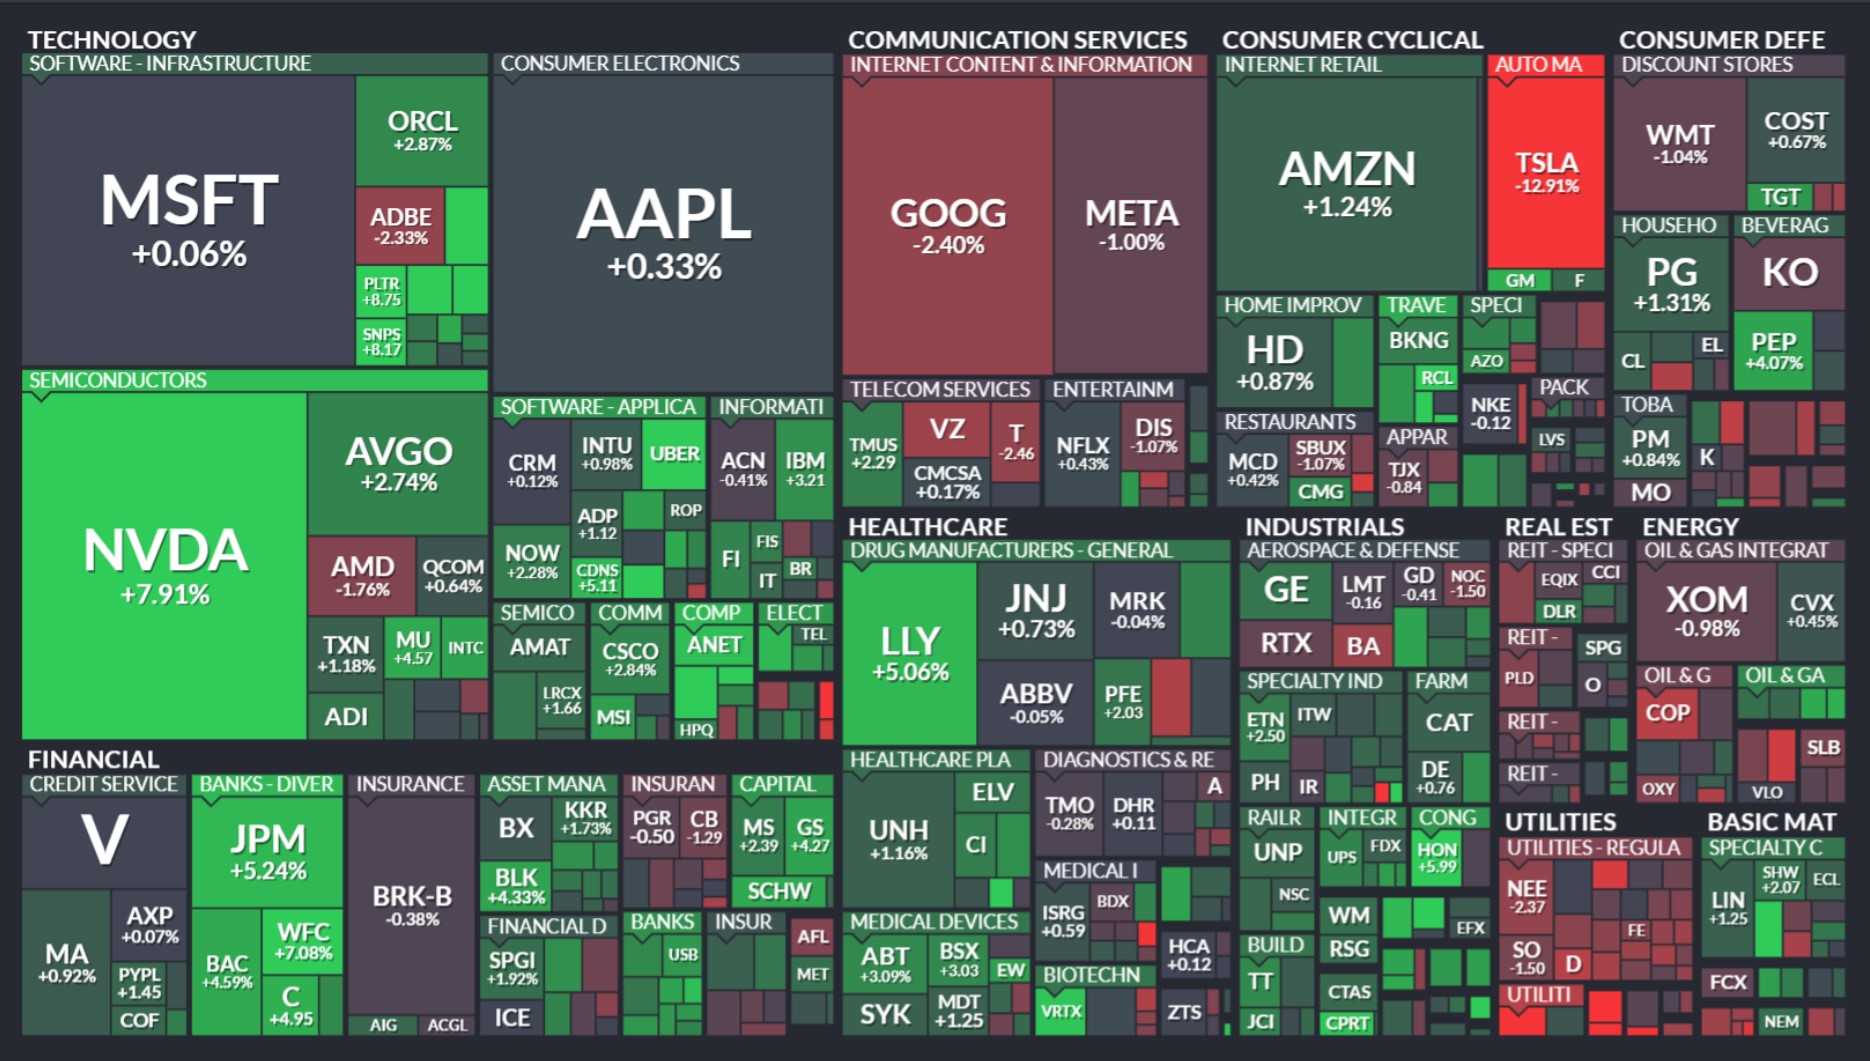
Source: Finviz
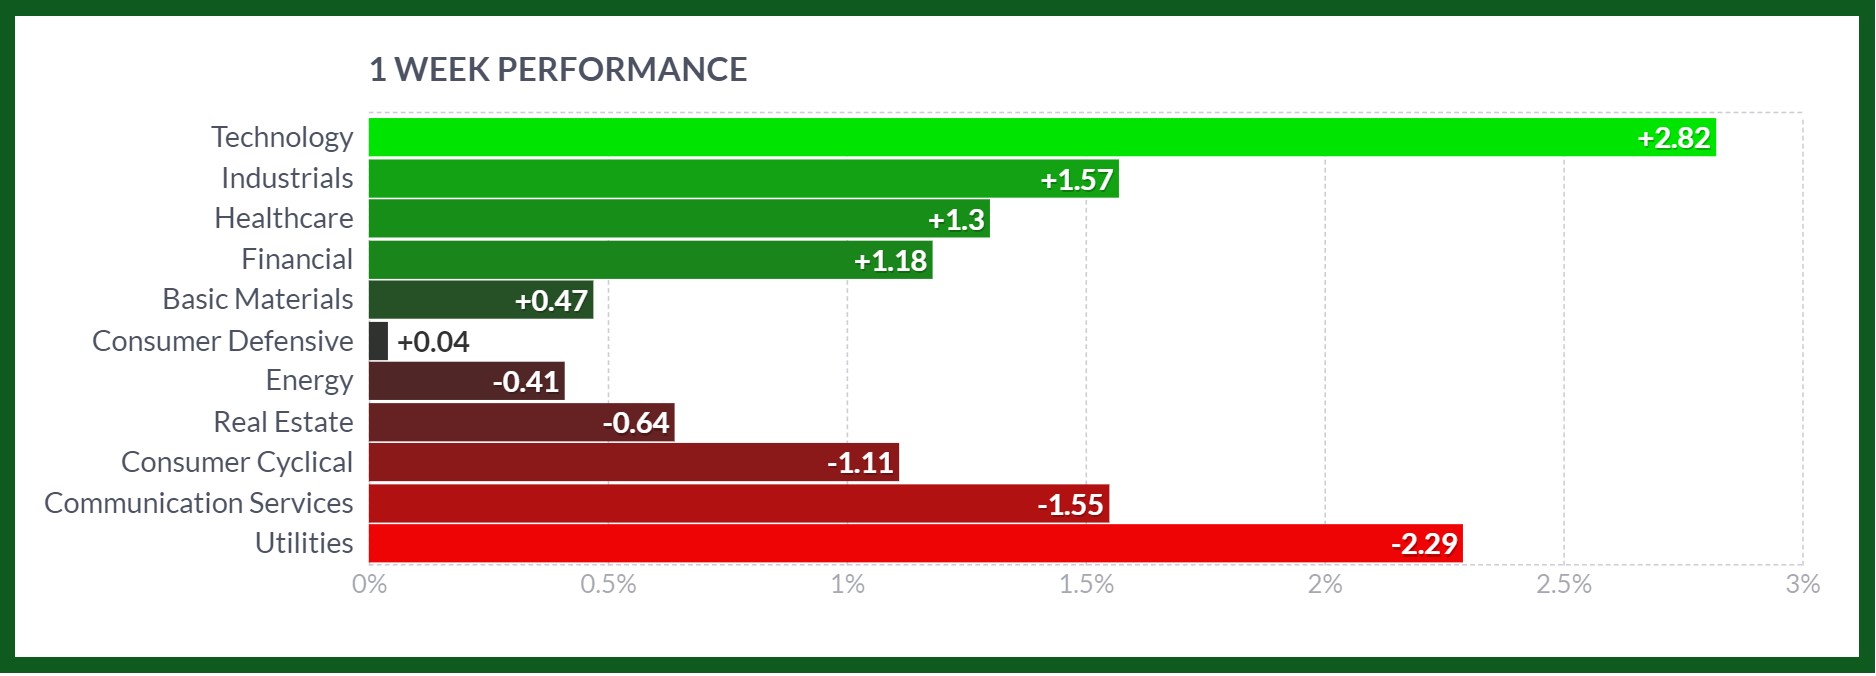
Here’s the summary of the U.S. sectors’ one-week performance:
- Technology: The technology sector experienced a robust increase of 2.8%, driven by continued investor enthusiasm for AI and tech innovation.
- Industrials: This sector saw a significant rise of 1.57%, benefiting from strong earnings reports and positive economic indicators.
- Healthcare: Healthcare stocks increased by 1.3%, reflecting steady demand for medical services and advancements in pharmaceutical research.
- Financial: The financial sector grew by 1.18%, aided by solid earnings from major banks and rising interest rates.
- Basic Materials: With a modest gain of 0.47%, this sector benefited from stable commodity prices and strong industrial demand.
- Consumer Defensive: This sector had a slight uptick of 0.04%, as consumer staples remained in demand despite market volatility.
- Energy: The energy sector declined by 0.41%, impacted by fluctuating oil prices and concerns about global economic slowdown.
- Real Estate: A decrease of 0.64% was seen in real estate, influenced by higher interest rates affecting property investments.
- Consumer Cyclical: This sector saw a drop of 1.11%, as discretionary spending slowed amid economic uncertainty.
- Communication Services: Down by 1.55%, this sector faced pressure from regulatory challenges and mixed earnings reports.
- Utilities: Utilities experienced the largest decline of 2.29%, affected by rising interest rates and reduced investor demand for defensive stocks.
This mixed performance across sectors highlights the varying impacts of economic trends and market sentiment over the past week.
Stock Market Weekly Performance:
Source: Finviz
Top Gainers
Here’s a brief overview of the top gainers for the previous week:
- Uber Technologies Inc. (UBER): Gained 16%
- Super Micro Computer, Inc. (SMCI): Rose by 16%
- NVIDIA Corporation (NVDA): Increased by 8 %
- Palantir Technologies Inc. (PLTR): Jumped 8.7%
- CrowdStrike Holdings, Inc. (CRWD): Climbed 9.5%
- Synopsys, Inc. (SNPS): Rose by 8%
- Wells Fargo & Company (WFC): Gained 7%
These gains were driven by factors such as positive earnings reports, strong investor interest, and favorable market conditions.
Robotaxi Event
At Tesla’s “We, Robot” event, CEO Elon Musk unveiled several groundbreaking innovations. The highlight was the Cybercab, a futuristic, two-seater self-driving taxi without a steering wheel or pedals, aimed for production by 2026.
Musk also introduced the Robovan, an autonomous shuttle for up to 20 people, and showcased a new inductive battery-charging technology.

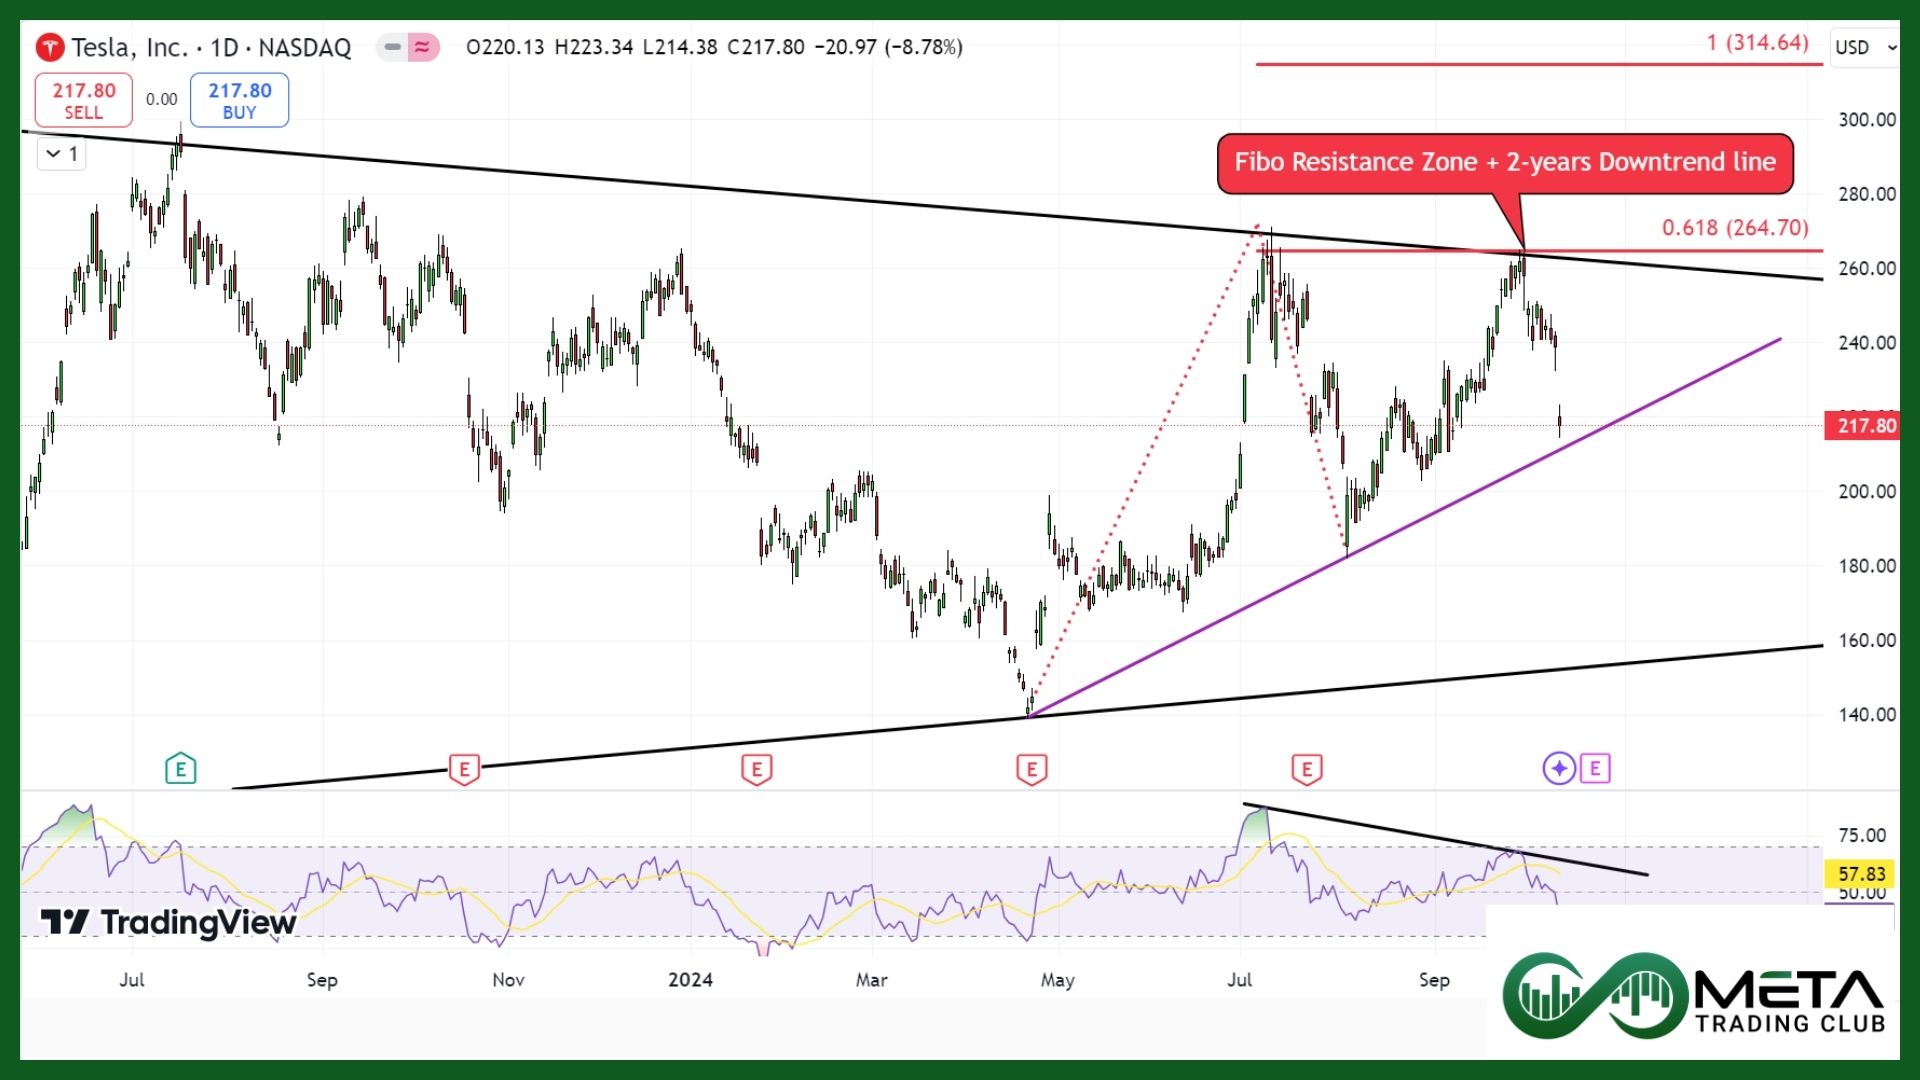
Despite these exciting reveals, investors were disappointed by the lack of detailed business strategies and ambiguous timelines, causing Tesla’s stock to drop by 10%.
Investors were disappointed by the lack of detailed technical information about the new Cybercab and Robovan. However, some analysts remain optimistic, predicting a potential rebound to $380 if Tesla can regain investor confidence.
Read more about the Tesla Robotaxi here.
TSLA Technical Analysis: Currently, Tesla’s stock (TSLA) is trading near its short-term trend line, which dynamic support for stocks. If this line breaks, next support is around $180. Analysts have mixed opinions, with some seeing long-term potential in Tesla’s AI and autonomous driving technologies.
Nvidia AI Summit
At Nvidia’s AI Summit, CEO Jensen Huang and other executives unveiled several groundbreaking advancements in AI technology. The event exhibited the Blackwell chip, which is already being integrated by eight companies, and introduced new hardware like the GB200 NVL72 system components and software such as NVIDIA Inference Microservices (NIMs). The summit emphasized the importance of efficient networking for AI inference and highlighted Nvidia’s commitment to energy-efficient AI systems.
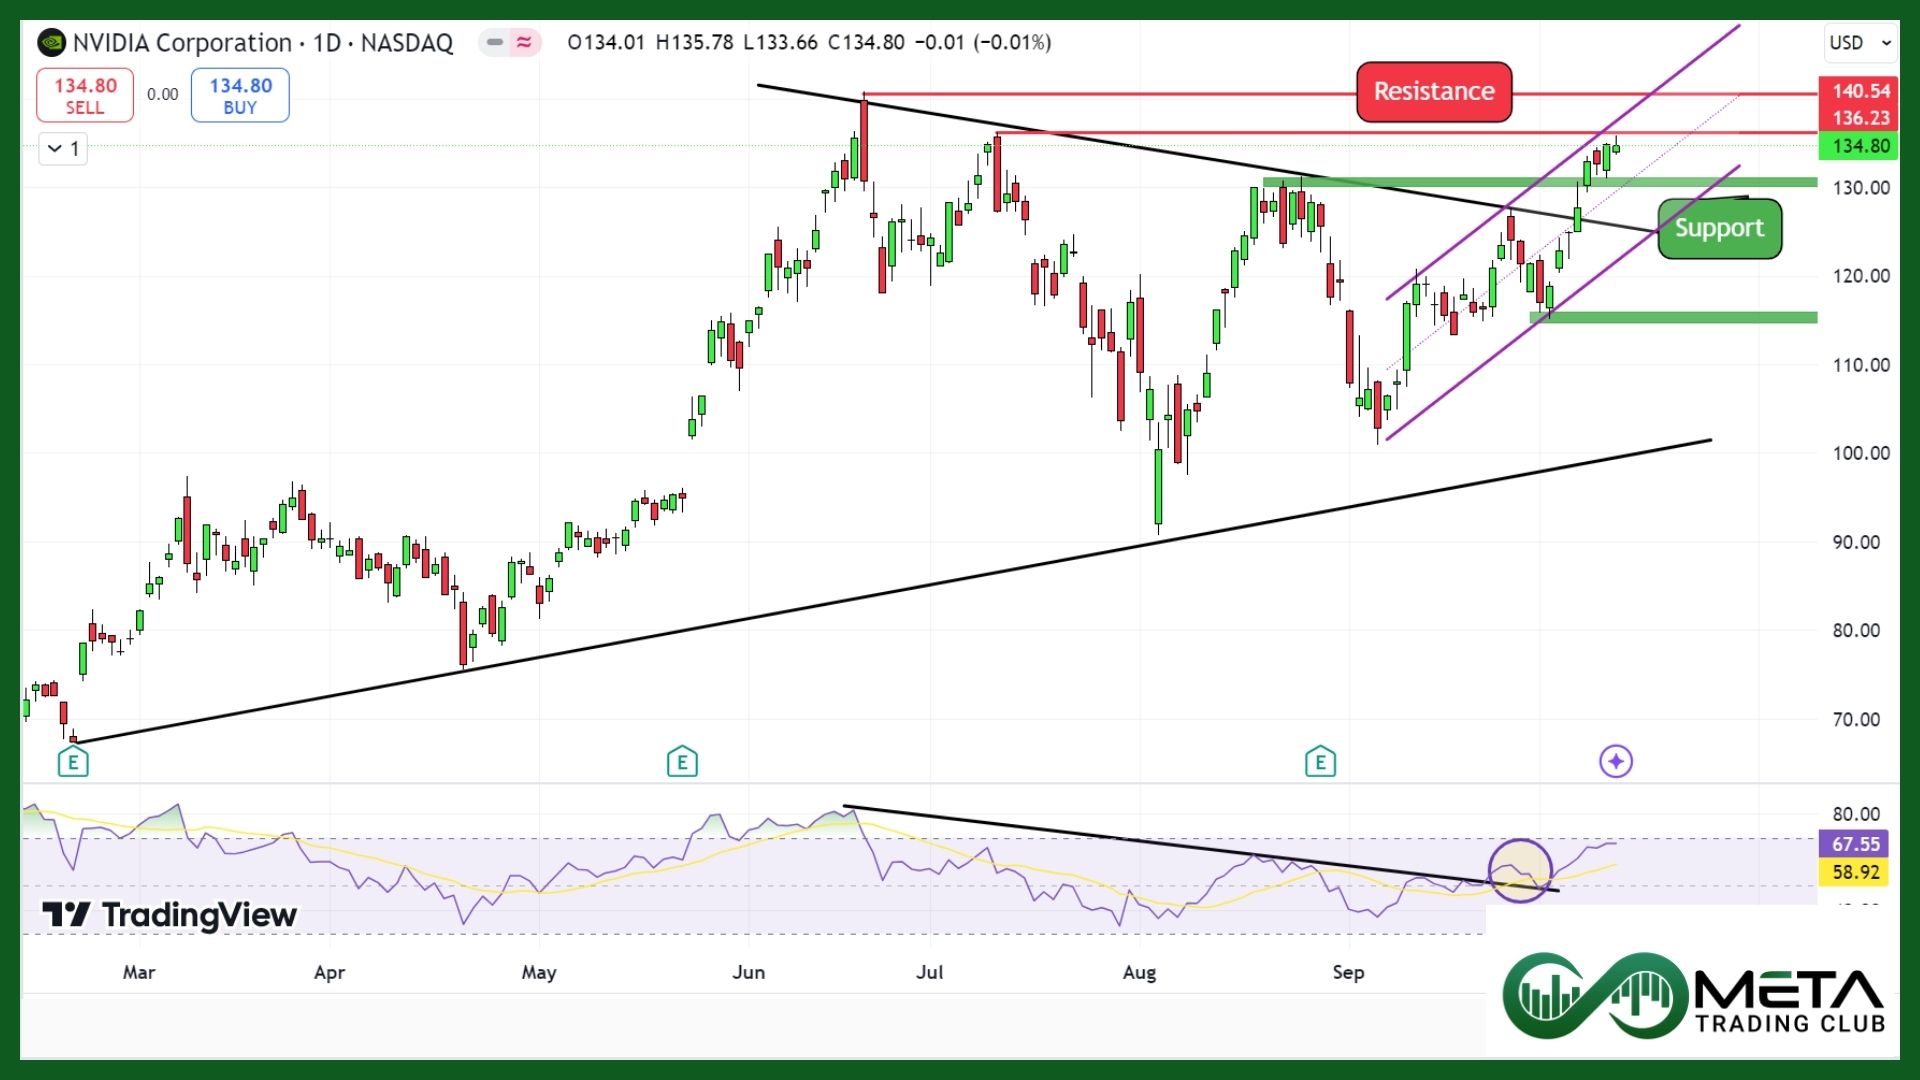
Following Nvidia’s AI Summit in October 2024, the company’s stock (NASDAQ: NVDA) saw a positive impact, rising by 8% last week. Investors react favorably to the announcements of the Blackwell chip and other AI innovations, boosting confidence in Nvidia’s continued leadership in the AI market.
Nvidia’s stock has been on a remarkable run, with its market cap soaring to over $3.3 trillion. The company’s AI-focused chips, especially the newly launched Blackwell series, have been driving this growth. Analysts remain optimistic about Nvidia’s future, predicting continued demand for its high-performance GPUs.
Read more about the Nvidia AI summit here.
NVDA Technical Analysis: Nvidia’s stock is currently trading near the top of rising channel and static resistance of 136. However, the overall trend remains bullish, with analysts predicting further upside if Nvidia continues to innovate in the AI space.
Commodity
Weekly Performance of Gold, Silver, WTI and Brent Oil:
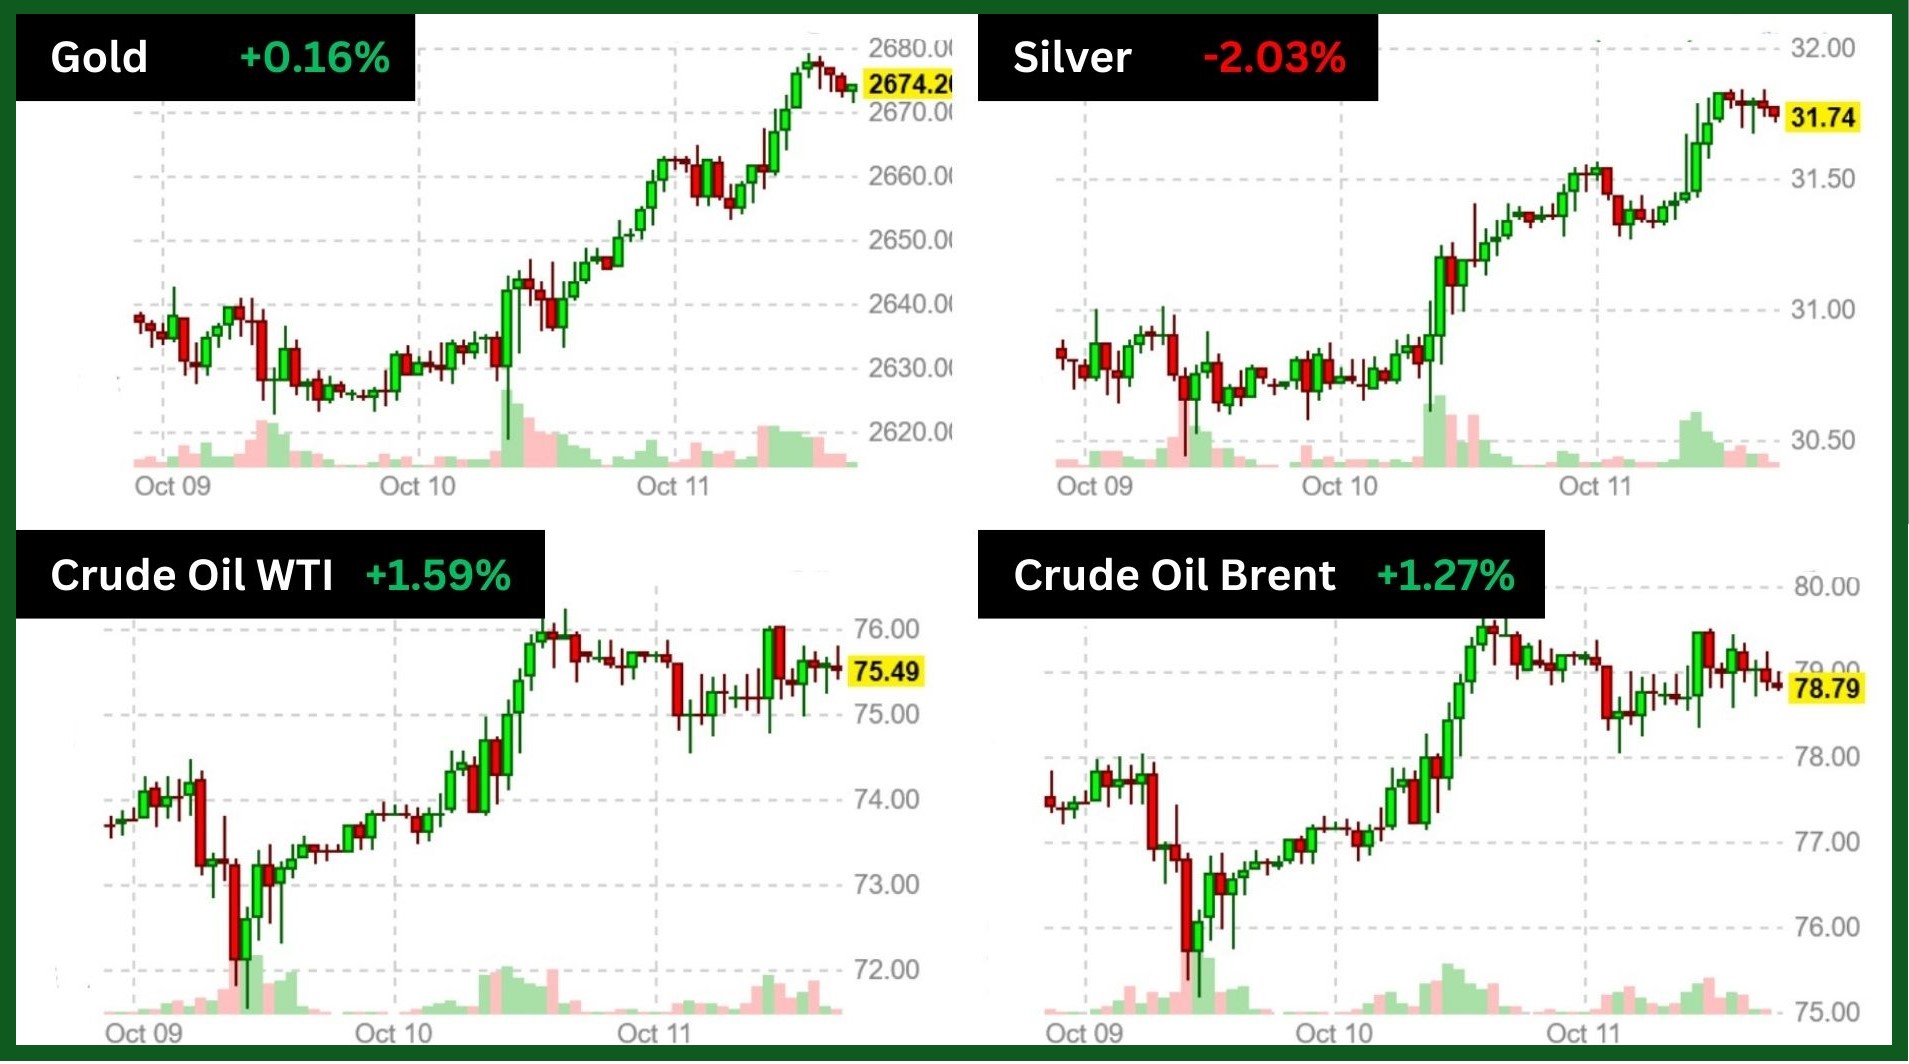
Source: Finviz
Last week, WTI crude oil rose by 1.59% to $73 per barrel, while Brent crude oil increased by 1.27% to $77 per barrel. The surge was primarily triggered by escalating tensions in the Middle East, which raised concerns about potential disruptions in oil supply.
Last week, gold rose by 0.16% to $2,615 per ounce, while silver declined by 2% to $30.4 per ounce. The slight increase in gold prices was supported by ongoing geopolitical tensions and expectations of interest rate cuts, while silver faced downward pressure due to stronger-than-expected U.S. jobs data and limited stimulus details from China.
Forex
Weekly Performance of Major Foreign Exchange Pairs:
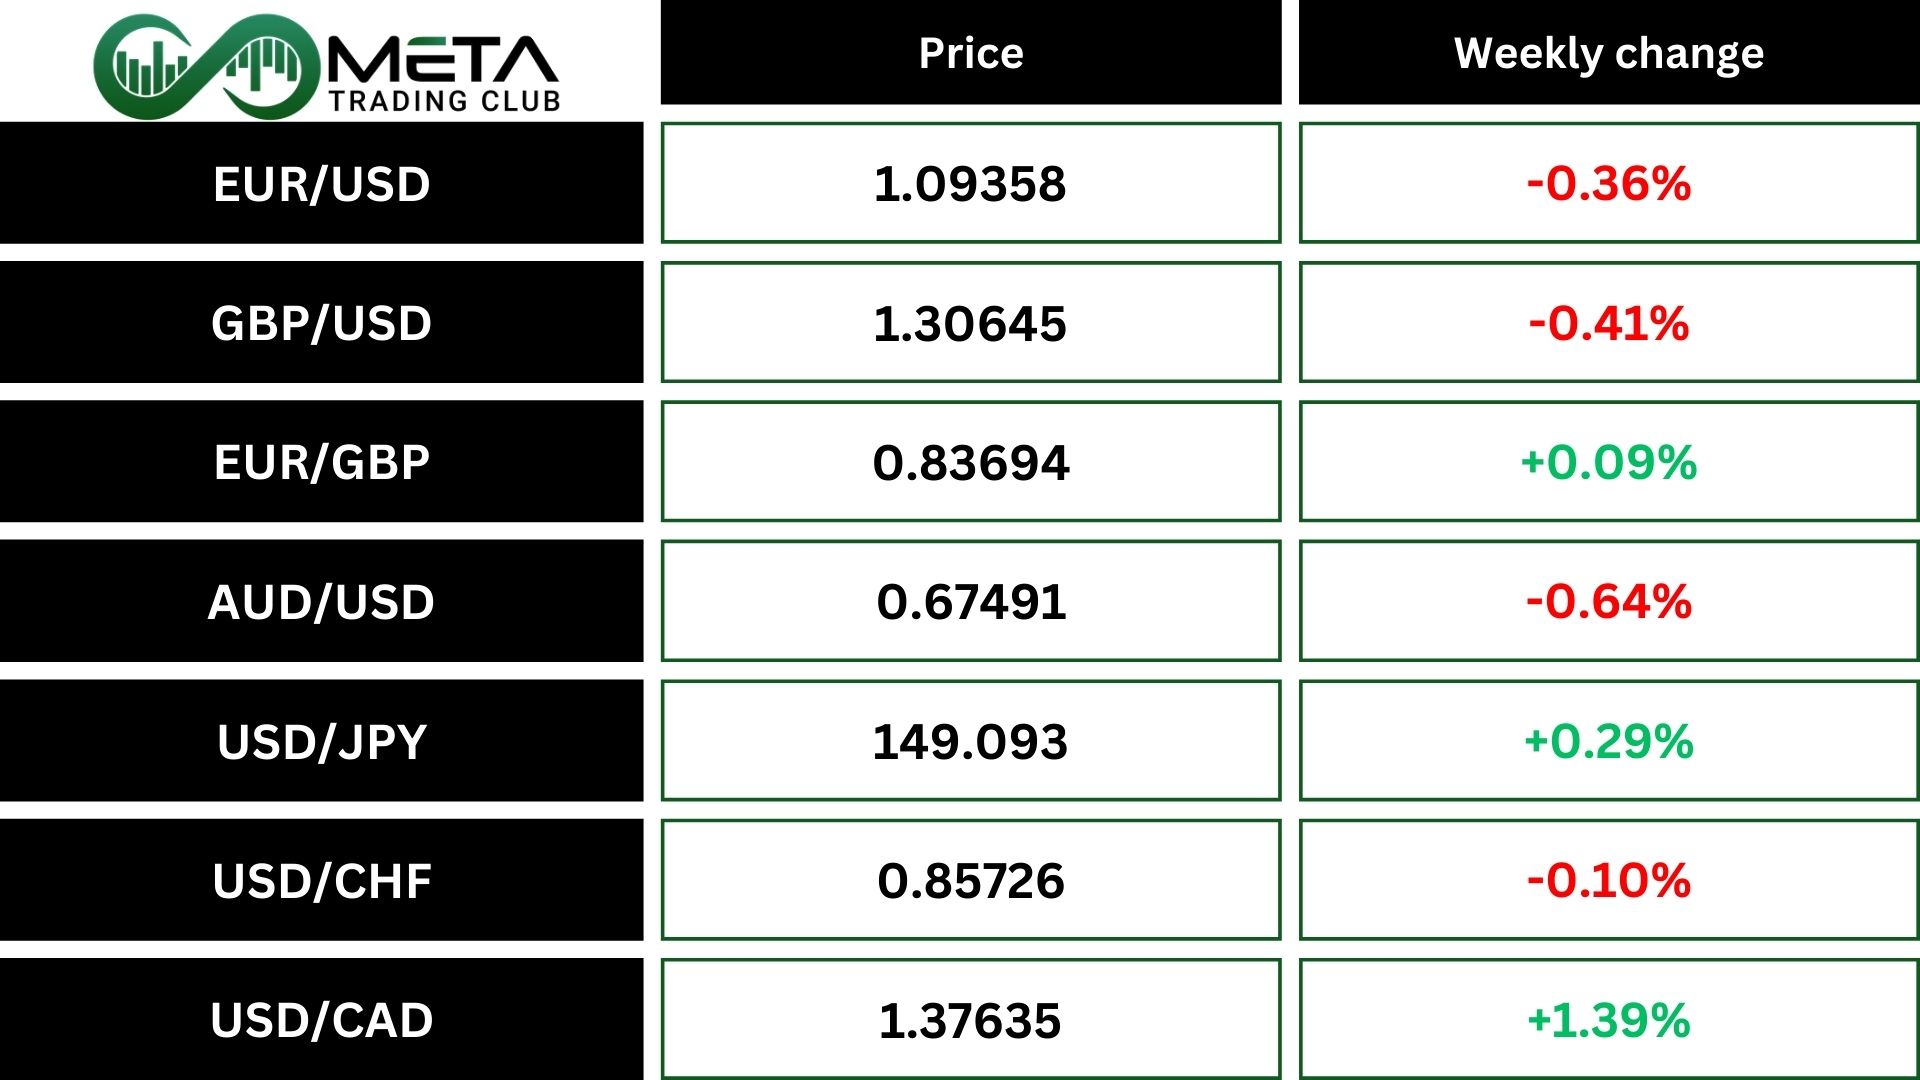
Last week, the US Dollar (USD) strengthened a bit against major currencies due to better-than-expected US inflation data and positive job market reports.
Also, the GBP/USD pair traded close to multi-week lows below 1.3100, while the EUR/USD pair faced downward pressure amid concerns over the European Central Bank’s monetary policy.
Additionally, the USD/JPY pair slighted as the Bank of Japan maintained its ultra-loose monetary policy, making the yen less attractive to investors.
Crypto
Crypto Market Weekly Performance:
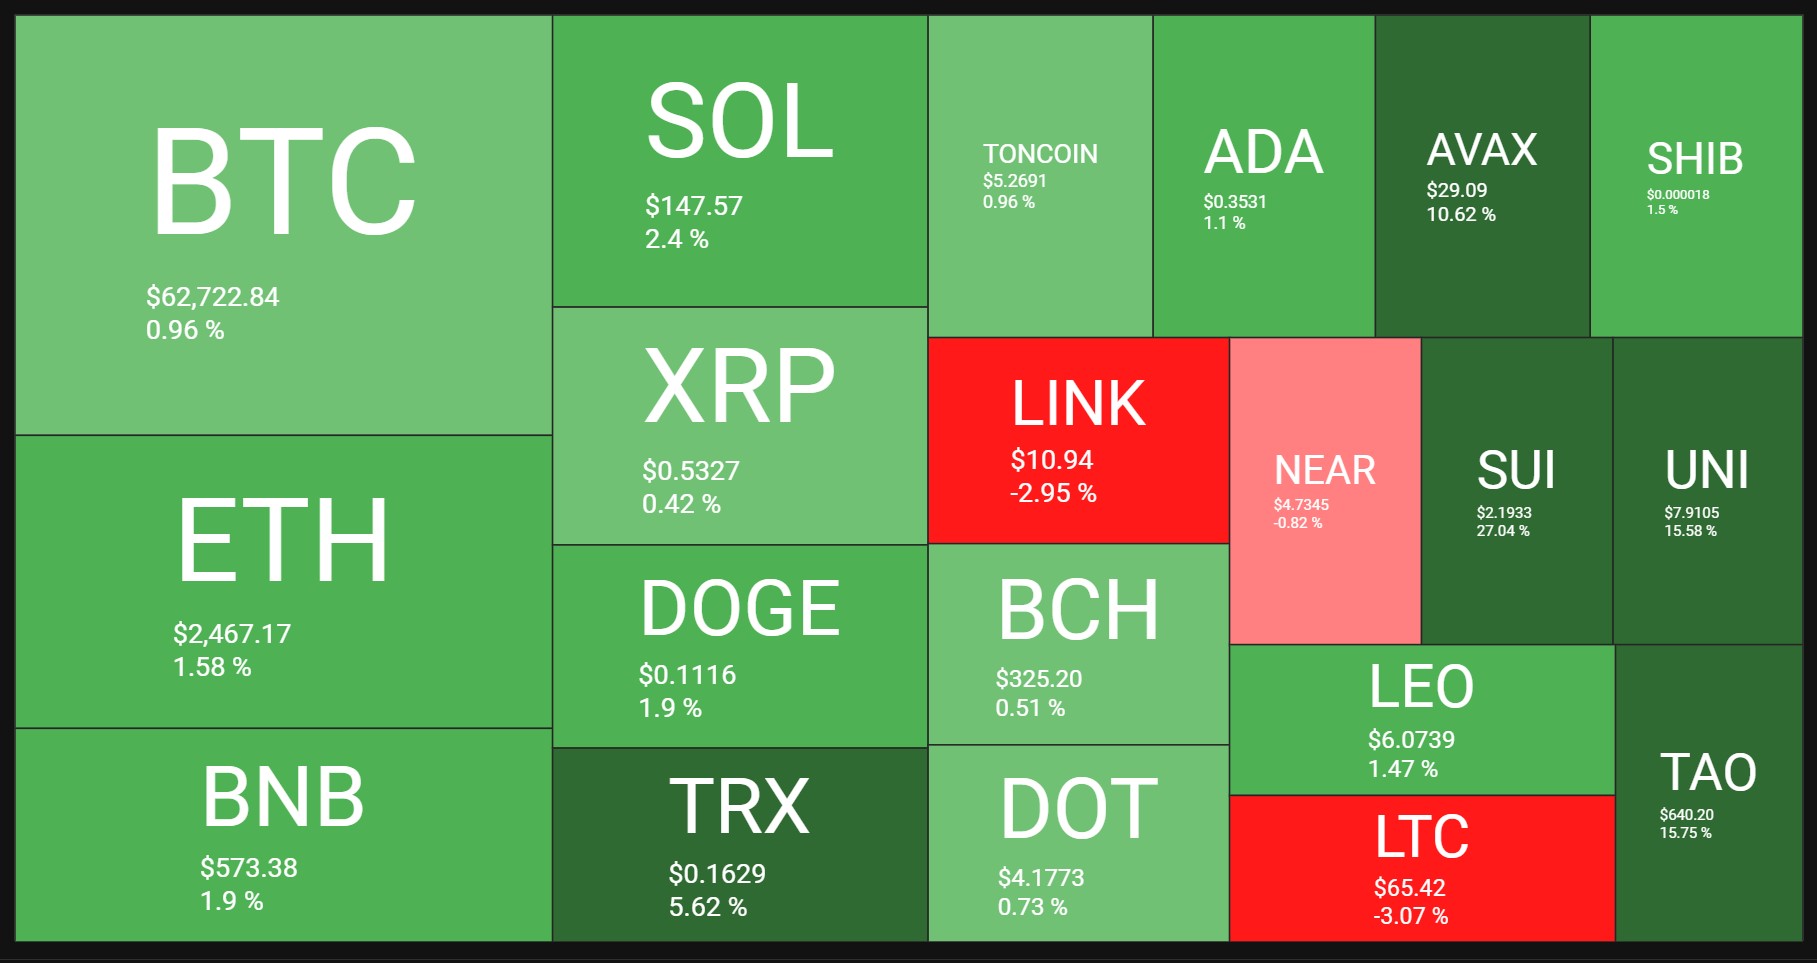
Source: quantifycrypto
Stripe announced the reactivation of USDC payments for U.S. businesses, allowing transactions through Ethereum, Solana, and Polygon.
Ripple has launched digital asset custody services for banks and fintech, integrating with its blockchain platform, the XRP Ledger. The new features include pre-configured operational settings, Anti-Money Laundering risk monitoring, and a new user interface. This move helps Ripple diversify its offerings beyond payment settlements, complementing its well-known Ripple Payments platform.
Next Week’s Outlook
Economic Events
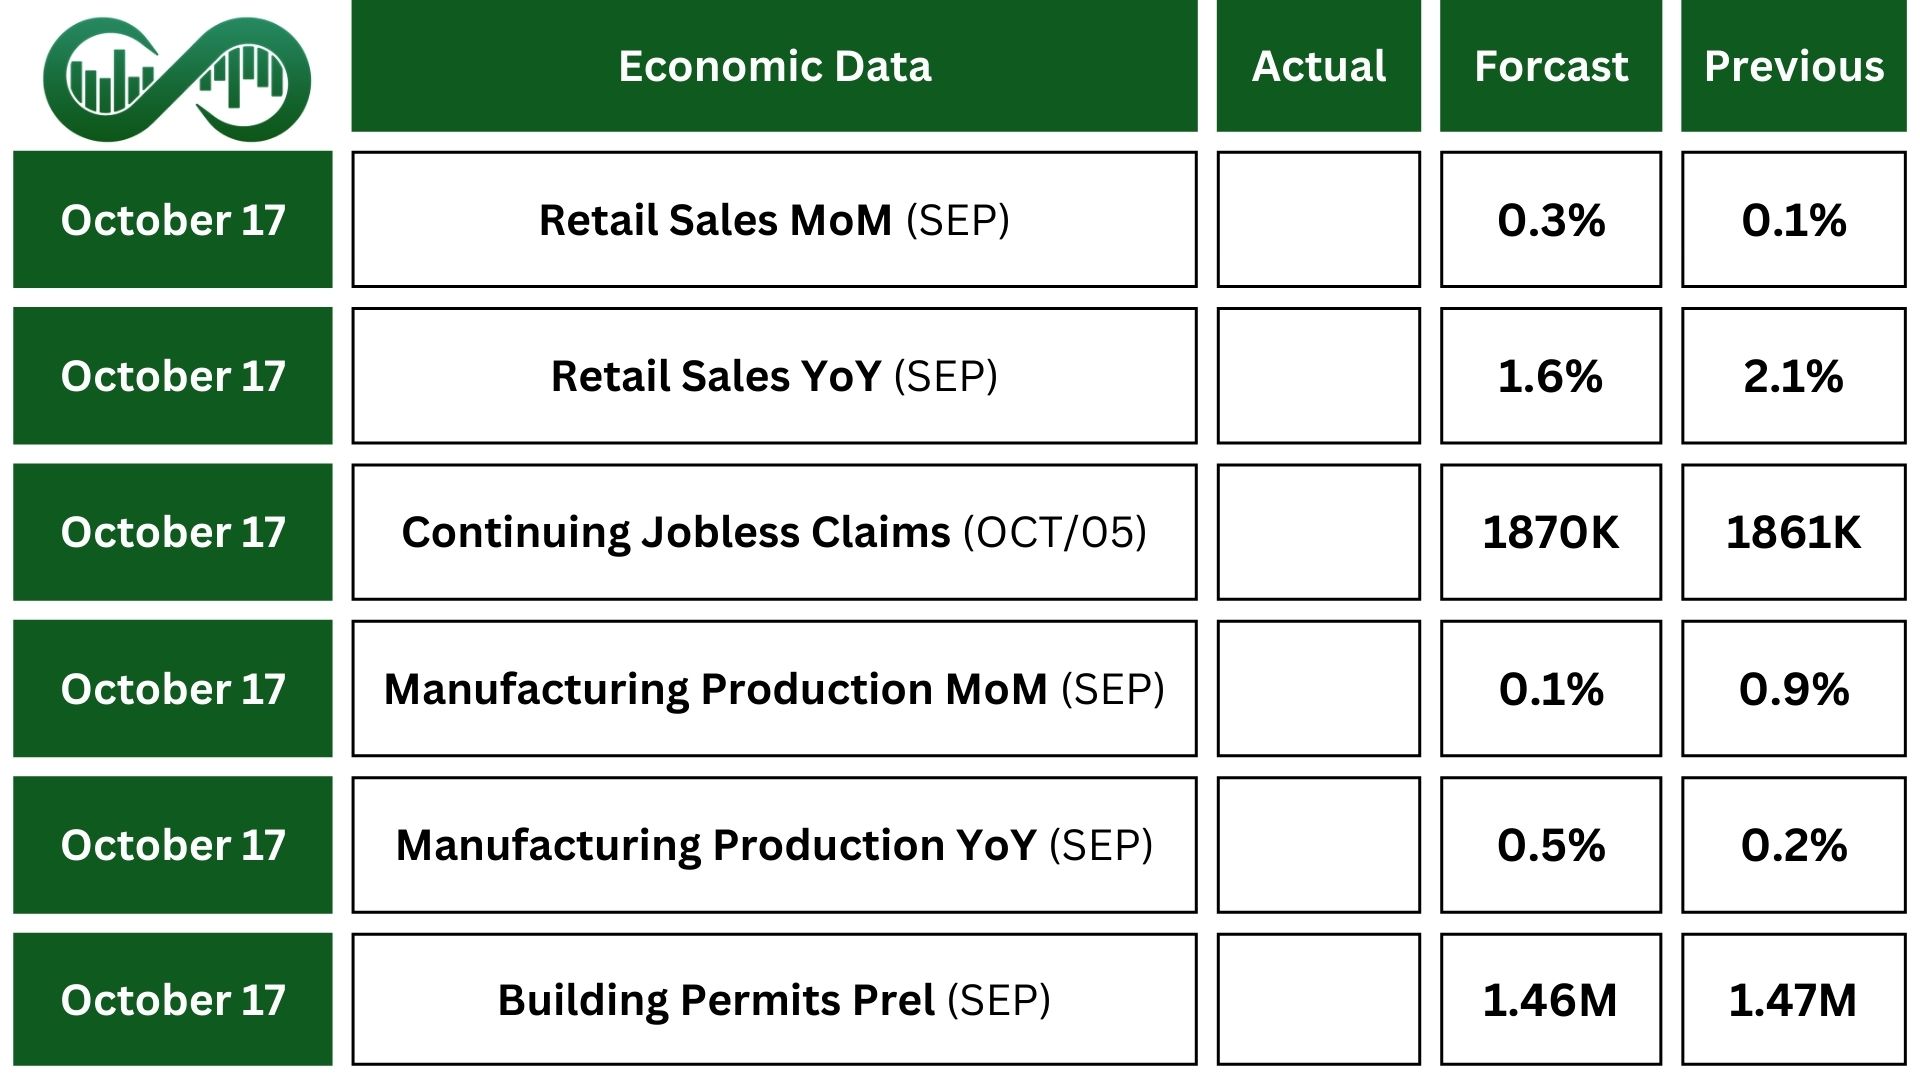
The market will receive new economic data, including the September Retail Sales which are expected to show a 0.3% increase. On the other hand, industrial production is likely to have contracted by 0.1%.
Other key economic data to follow include the NY Empire State Manufacturing Index, Philadelphia Fed Manufacturing Index and building permits.
Earning Events
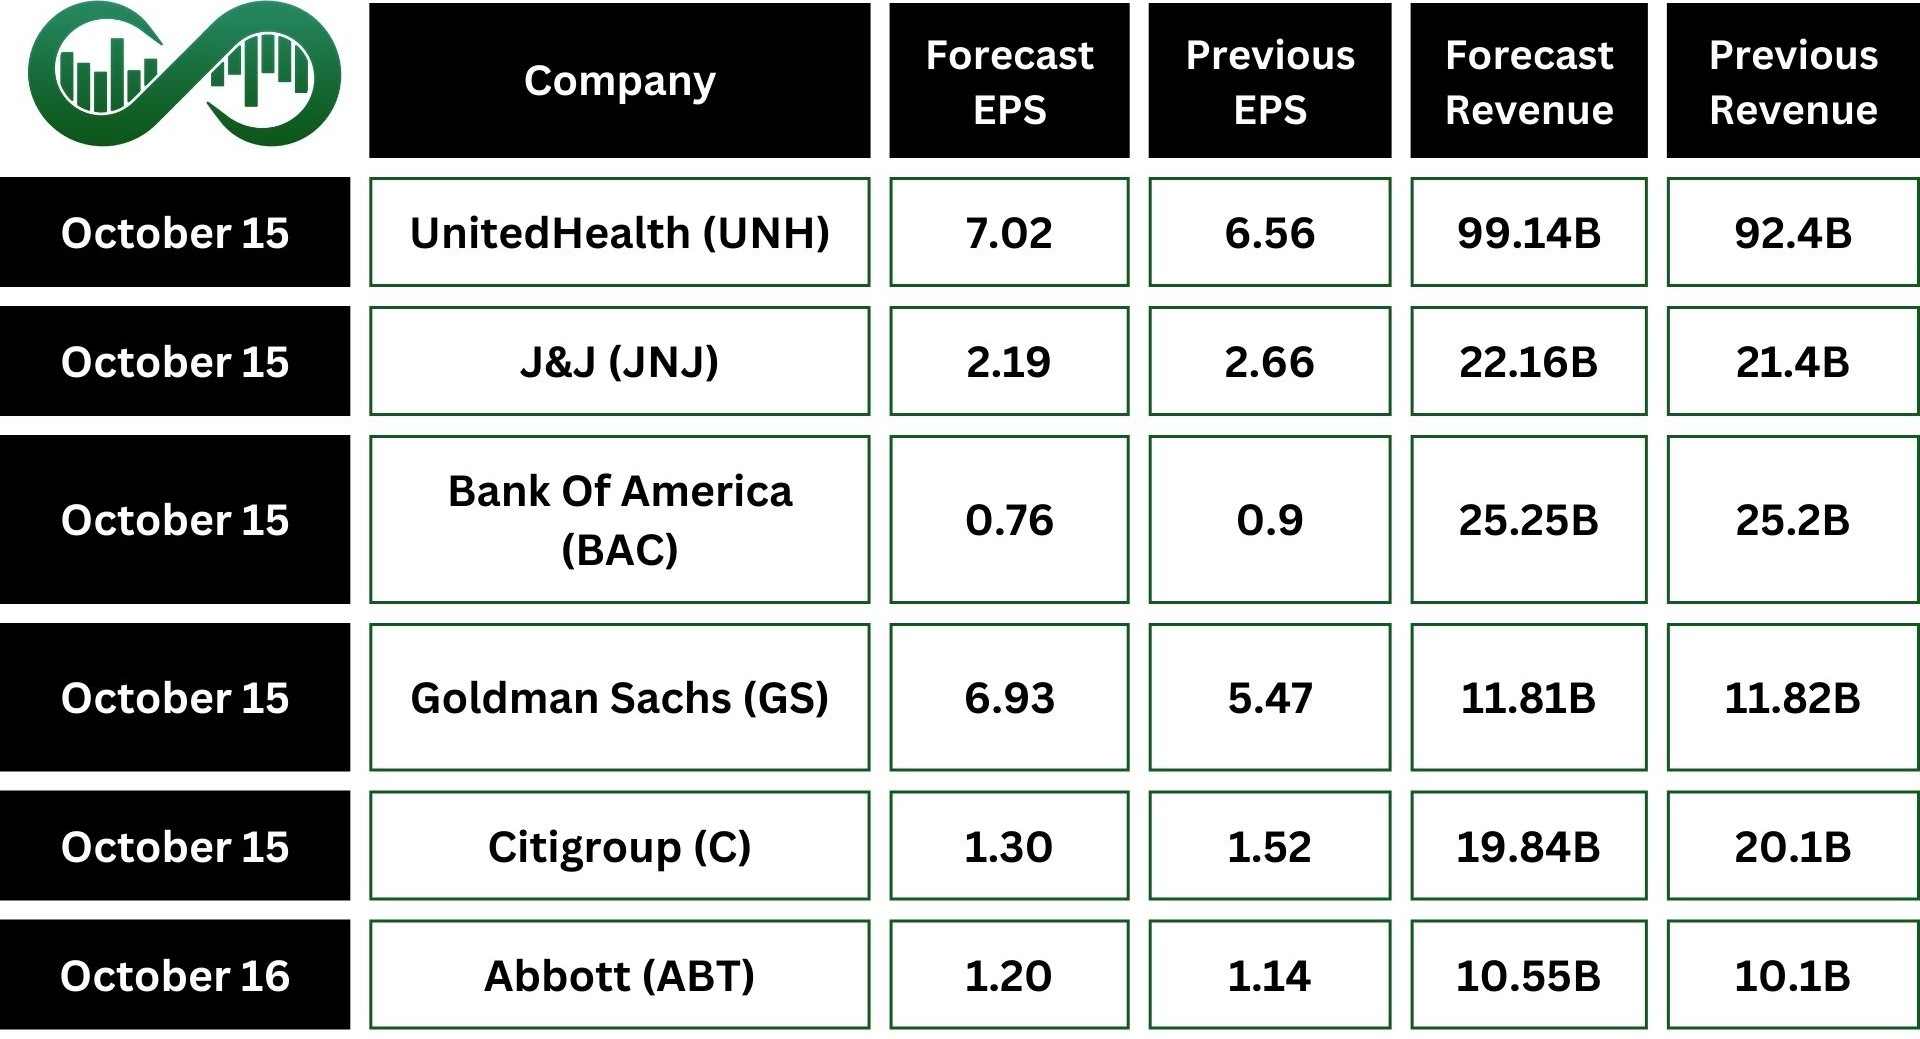
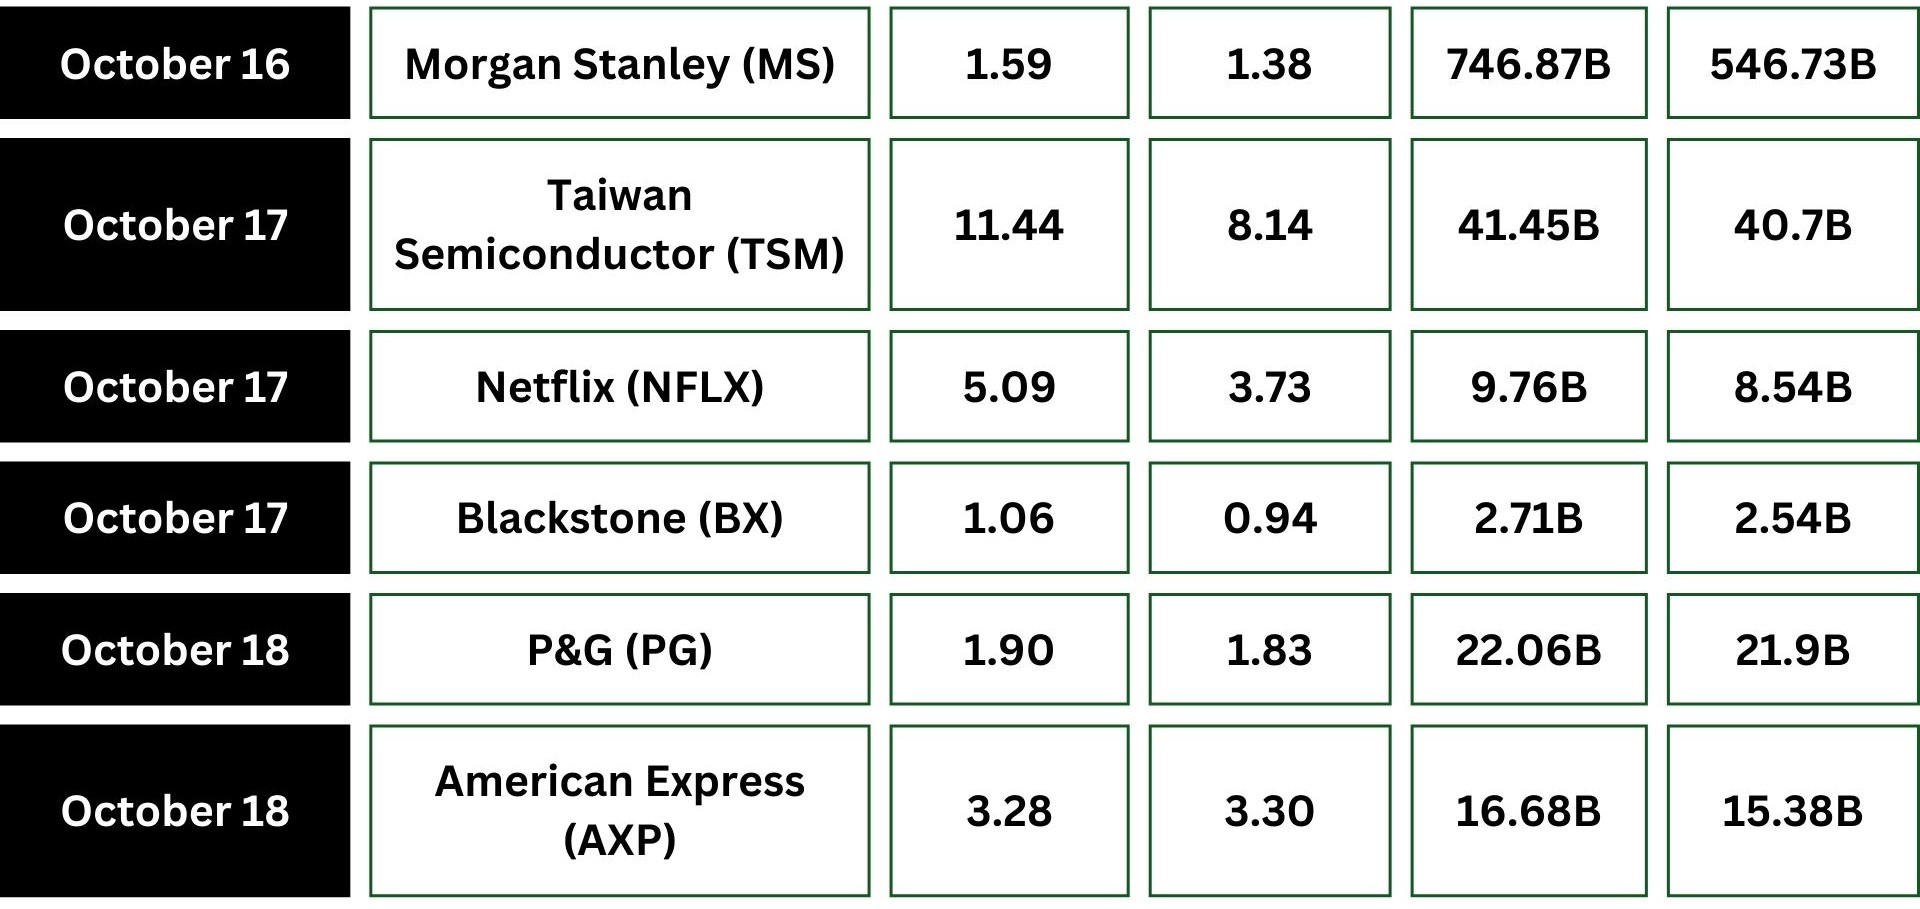
The earnings season will enter full swing with several companies reporting quarterly results including UnitedHealth, J&J, Bank Of America, Goldman Sachs, Citigroup, Charles Schwab, Abbott, Morgan Stanley, Netflix, Blackstone, P&G and American Express.