Last week’s market and economic data key points:
- December manufacturing PMI hits nine-month high
- US equity indices started 2025 on a positive note
- Low holiday trading volume amplifies market swings
- Nvidia soar as new gaming products and AI updates expected
- Alcohol beverage stocks tumble as warns of cancer risks
- Energy sector leads weekly gains as oil price surged
- Tesla plummet 9% despite Friday’s comeback
- Tariff worries loom over Fed’s rate cut decisions in 2025
- Crude oil climb on cold weather and China’s stimulus push
- Euro faces headwinds amid slower growth and tariff concerns
- Bitcoin struggles to break 6-digit barrier amid supply wall
Table of Contents
Last Week’s Reports
Economic Reports
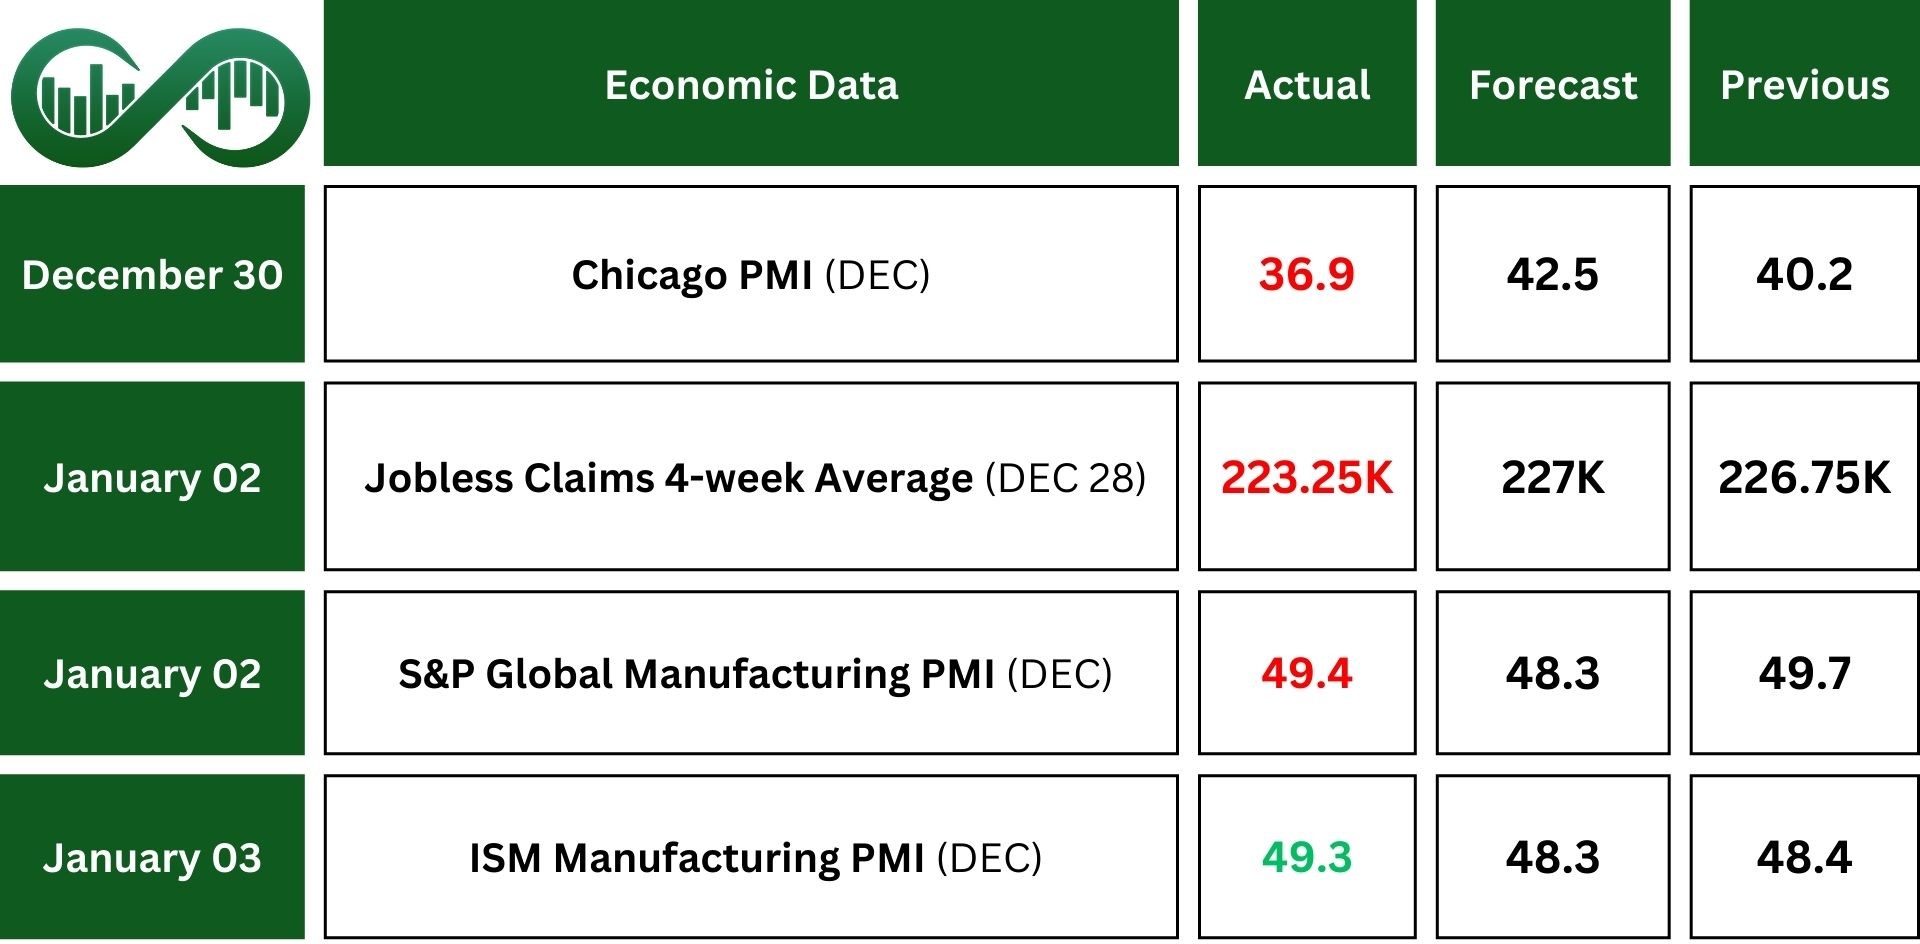
The 4-week average of jobless claims in the U.S. dropped to 223.25K on December 28, down from 226.75K the previous week, more than estimates. Also, this decline occurred in both initial and continuing jobless claims. These labor data indicate there were fewer jobless people in the last week of December.
S&P Global Manufacturing PMI fell slightly to 49.4, showing continued sector deterioration for the sixth month. New and export orders dropped due to customers’ reluctance ahead of a new administration in January.
The ISM Manufacturing PMI for December was 49.3, an improvement from November’s 48.4. The overall economy remained in expansion and exceeded forecasts. This indicates a better-than-expected performance in the manufacturing sector, and positively impacts investor sentiment and leads to a boost in stock market performance.
Indices
Indices’ Weekly Performance:
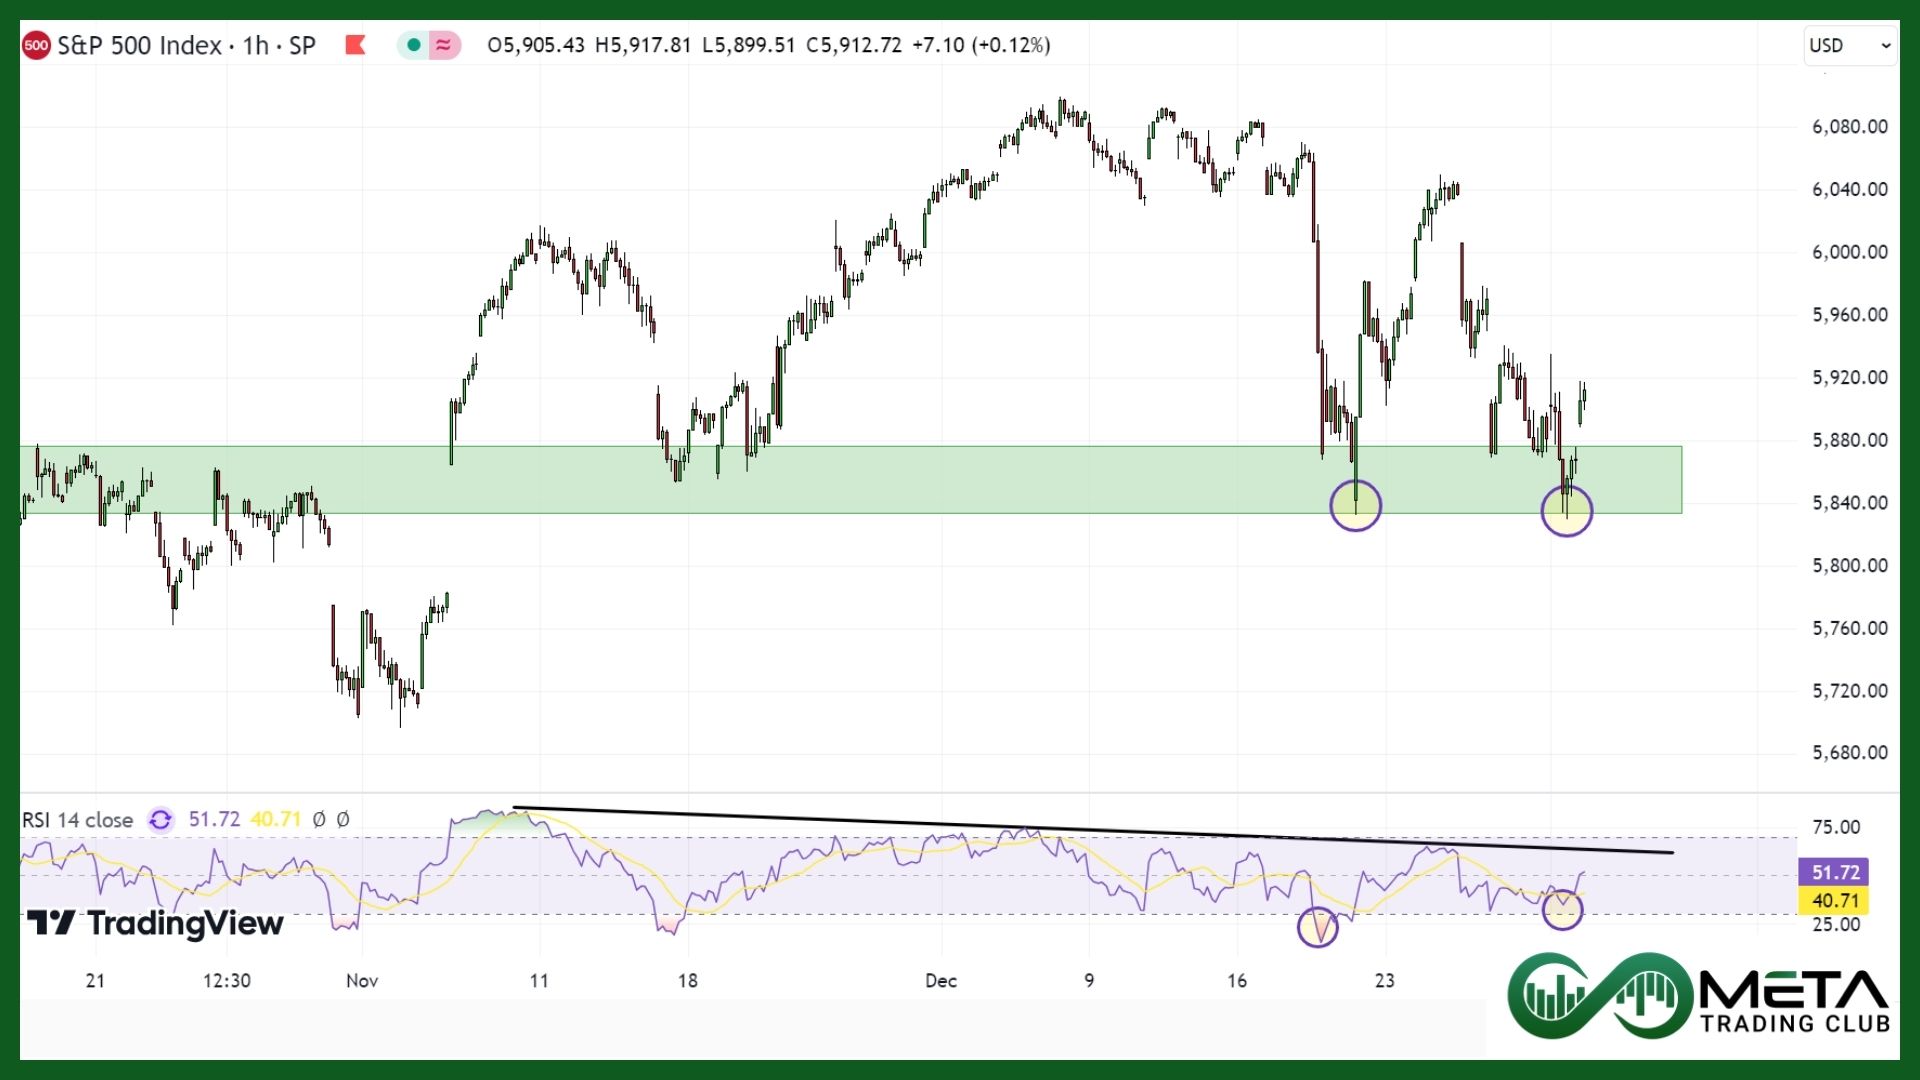
Over the week, the Dow dropped 0.6%, and the S&P 500 fell by 0.5%. The US manufacturing sector’s decline slowed in December due to increased demand, according to a survey by the Institute for Supply Management.
Overall, the report suggests that manufacturers ended the year with some optimism, but they could face significant challenges in the new year. US stock markets rose on Friday as traders analyzed new manufacturing data and comments from a Federal Reserve official.
Trading volume was, expectedly, relatively low across the three indexes this holiday-shortened week, exacerbating price moves in either direction.
Technically, the price action shows a recent dip to the support zone with a potential double bottom pattern forming. The RSI shows a downward trend but with two circled points indicating potential bullish divergence. The RSI and the double bottom pattern hint at a possible reversal to the upside.
Stocks
Stock Market Sector’s Weekly Performance:
Source: Finviz
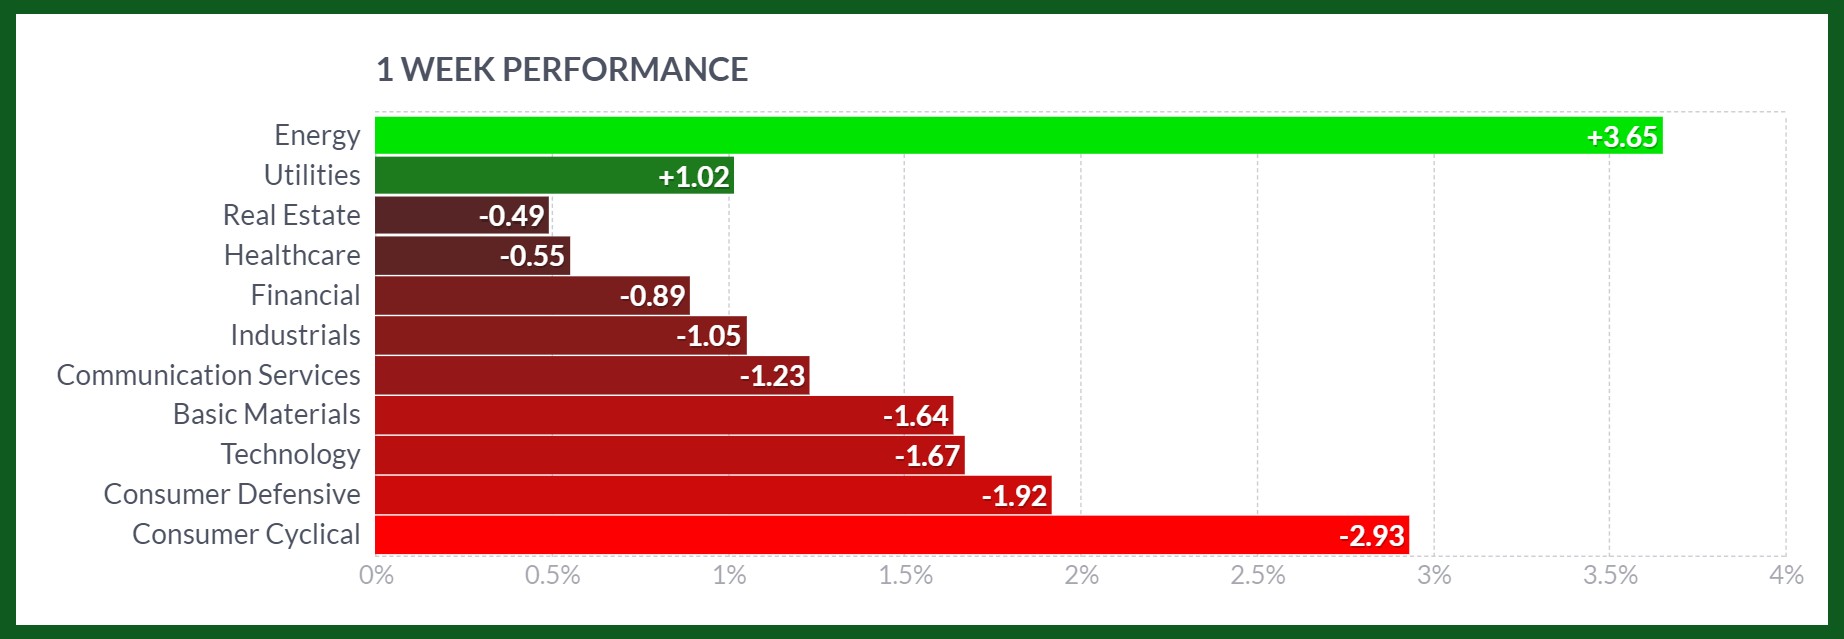
The stock market saw varied performances across different sectors last week. Here’s a breakdown of how each sector fared:
- The energy sector saw a 3.65% gain driven by rising oil prices and increased demand for energy resources.
- The utilities sector gained 1.02% after the US Department of the Treasury issued final rules outlining eligibility criteria for hydrogen producers seeking tax credits.
- The basic materials sector faced a 1.64% decline, as President Biden blocked United States Steel’s proposed acquisition by Japan’s Nippon Steel. This is citing national security concerns and supply chain risks.
- The technology sector saw a 1.67% decline, influenced by market corrections and profit-taking after recent gains.
- The consumer defensive sector experienced a 1.92% decline, as shares of alcohol beverage makers dropped. This was after the US Surgeon General Vivek Murthy issued a warning about the link between alcohol consumption and cancer, and called for cancer warning labels on alcoholic drinks.
- The consumer cyclical sector saw a 2.93% drop, likely due to concerns about consumer spending, and a general market downturn.
Stock Market Weekly Performance:
Source: Finviz
Top Performing Stocks of Last Week
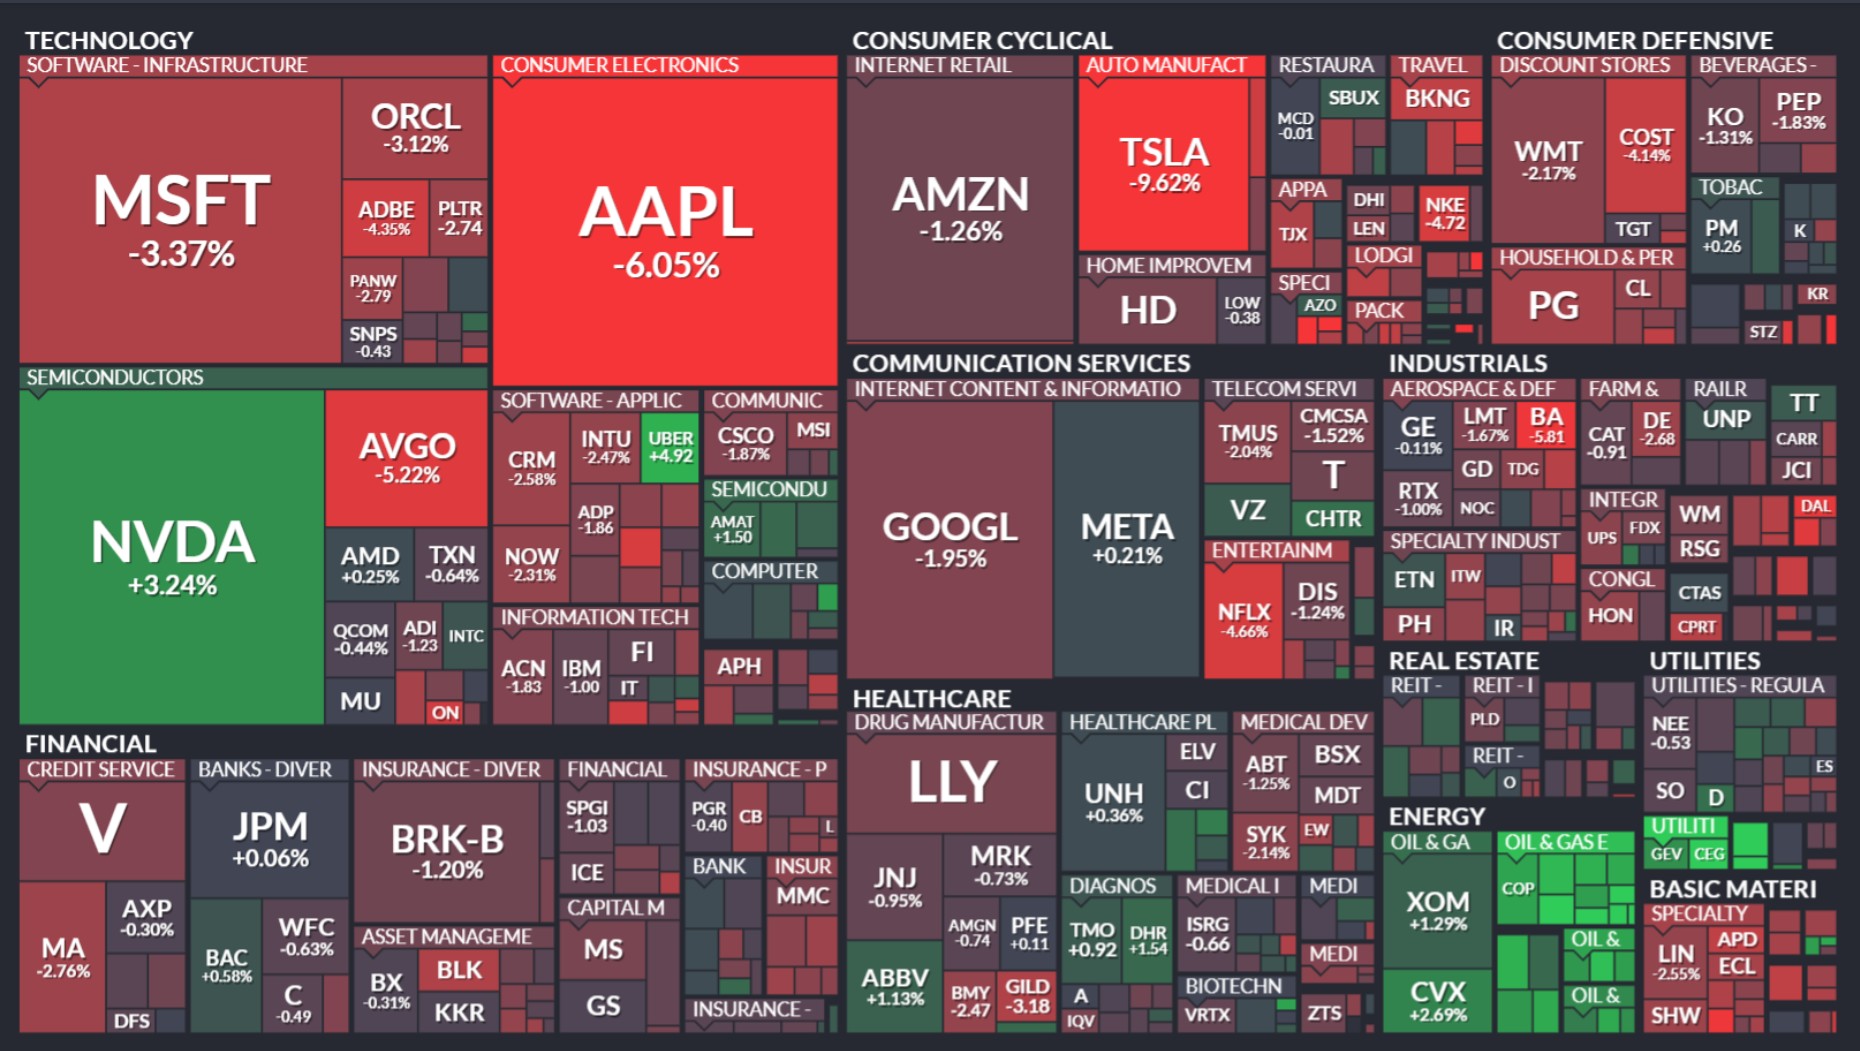
The stock market saw some impressive performances last week, with several stocks making significant gains. Here are the top performers and the reasons behind their success:
- Vistra (VST): Surged 16.2% as UBS raised its price target on the stock to $174 from $161.
- Constellation Energy (CEG): Gained 11.4% after the US Department of the Treasury issued final rules outlining eligibility criteria for hydrogen producers seeking tax credits.
- Arm Holdings (ARM): Rose 9.2% following positive investor’s sentiments.
- GE Vernova (GEV): Increased 6% by the increasing worldwide adoption of clean energy across industries.
- Uber Technologies (UBER): Advanced 5.6% after turning to buy from big banks.
- NVIDIA (NVDA): Surged 5.4% as expected to announce new gaming products at the upcoming CES tech show.
- EOG Resources(EOG): Rose 5.1% benefiting from higher oil prices.
Commodity
Weekly Performance of Gold, Silver, WTI and Brent Oil:
Source: Finviz
Gold prices fell on Friday, reducing the week’s gains due to the Fed’s hawkish expectations. The ISM data indicated growth in manufacturing orders and production in December, suggesting a potential recovery for the sector. However, the survey also highlighted concerns about tariffs from the incoming administration, which could increase inflation and hinder further rate cuts by the Fed. Markets are now divided on whether the central bank will implement one or two rate cuts this year.
Technically, the price is consolidating within a symmetrical triangle, suggesting a potential breakout. A breakout above the upper trend line could signal a bullish move, while a breakdown below the lower trend line could indicate a bearish move. The RSI suggests potential weakening of the uptrend, and you should watch for a breakout from the triangle pattern to determine the next directional move.
Crude oil prices rose last week due to cold weather in Europe and the U.S., and China’s announcement of new economic stimulus measures. China’s efforts to boost growth included raising wages for government workers and increasing funding to support business investment and consumer initiatives. The expected increase in demand for heating oil due to colder weather also contributed to the rise in oil prices.
Forex
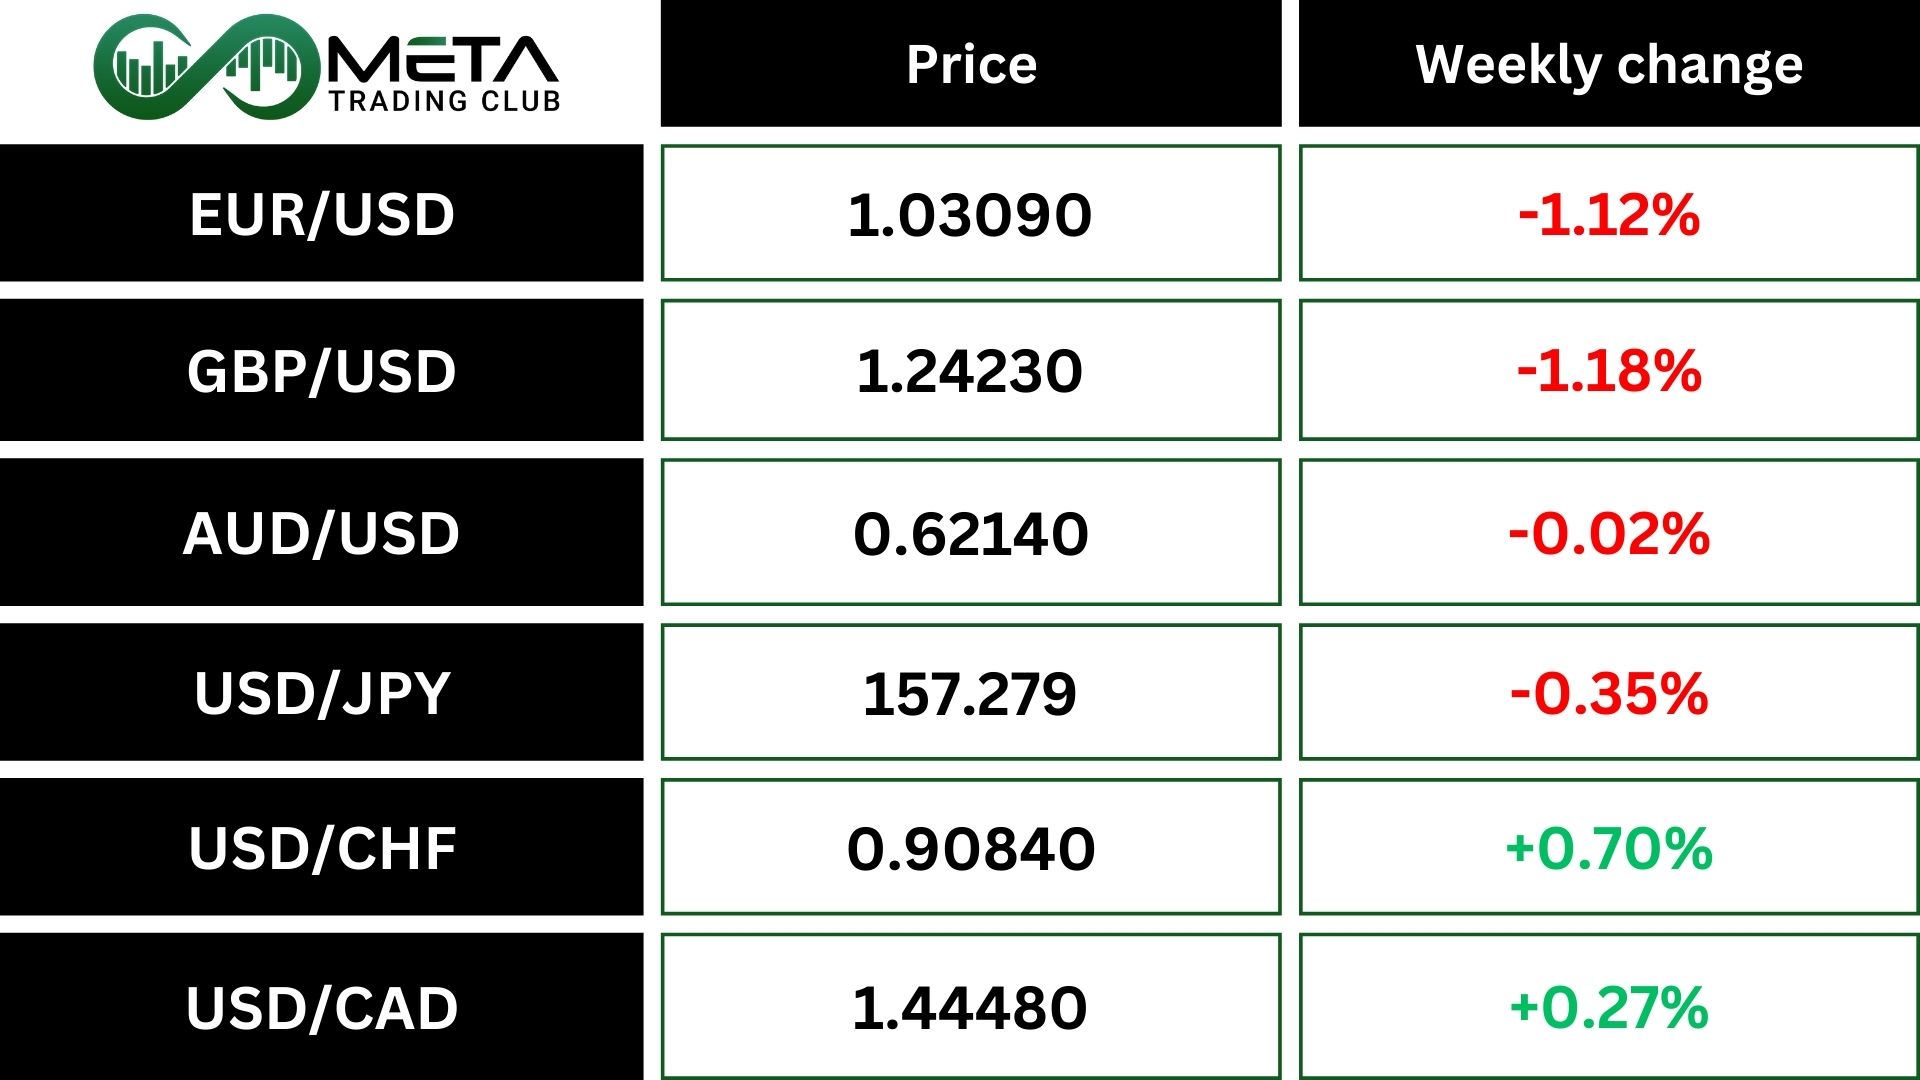
Weekly Performance of Major Foreign Exchange Pairs:
The dollar briefly reduced its losses after U.S. manufacturing data showed improvement in December.
The Euro is facing challenges due to slower growth and possible U.S. tariffs, with the ECB expected to cut rates more than the Fed this year. Traders expect the ECB to cut rates by 100 basis points by the end of the year, while the Fed may cut rates by 50 basis points.
The dollar fell 0.35% to 157.28 yen, with the yen suffering due to the interest rate difference between the U.S. and Japan, and the Bank of Japan’s cautious stance on rate increases.
Crypto
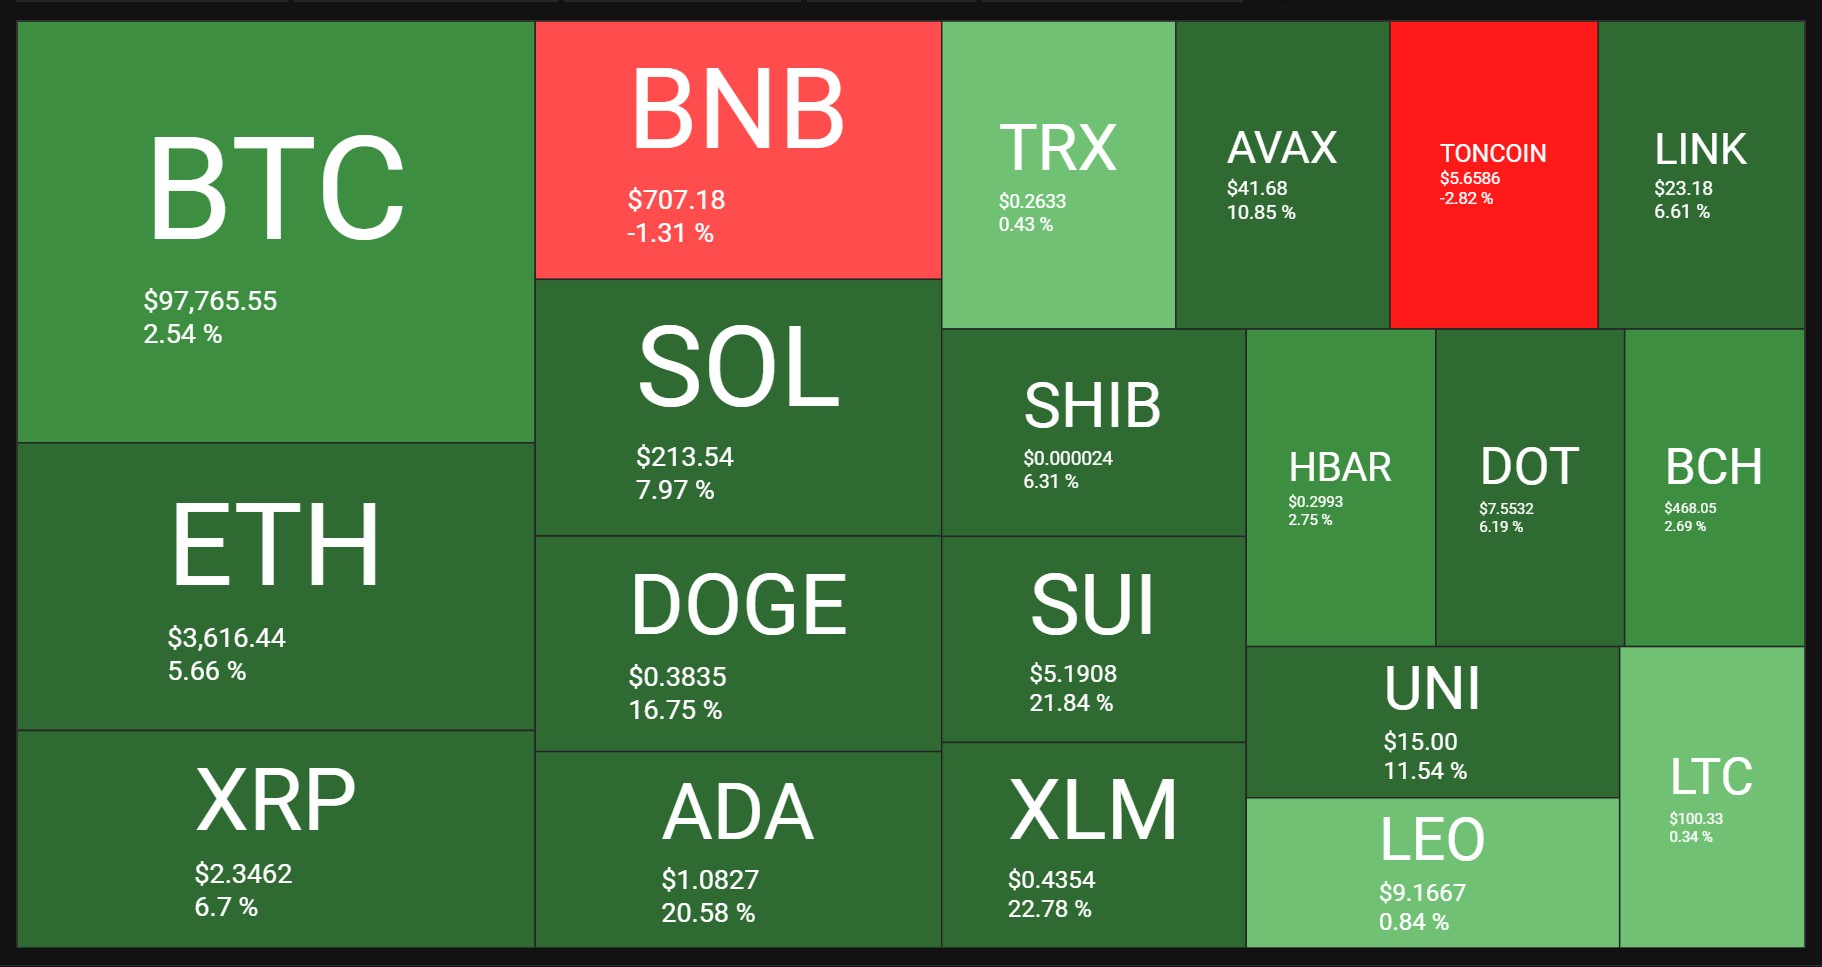
Crypto Market Weekly Performance:
Source: quantifycrypto
Bitcoin‘s price has rebounded from a significant decline earlier this week, recovering to above $97,000 after hitting a monthly low of $91,300 on December 30, 2024. Despite this recovery, Bitcoin is struggling to return to the six-digit territory. A major factor holding it below $100,000 is the “stiff supply wall” at current levels, where many investors have accumulated BTC holdings between $98,000 and $100,000, creating critical resistance.
The Bitcoin chart indicates a period of consolidation with potential for a significant breakout. You should closely monitor the support and resistance levels for signs of a directional move.
Next Week’s Outlook
Economic Events
Next week, key employment data will be released. ADP’s monthly employment report is expected on Wednesday, and the Labor Department’s report (Non-farm payrolls and Unemployment) is due on Friday.
Additionally, November factory orders will be announced on Monday, Services PMI on Wednesday, and preliminary January consumer sentiment on Friday.
Disclaimer:
The views and opinions expressed in the blog posts on this website are those of the respective authors and do not necessarily reflect the official policy or position of Meta Trading Club Inc. The content provided in these blog posts is for informational purposes only and should not be considered as financial advice. Readers are encouraged to conduct their own research and consult with a qualified financial advisor before making any investment decisions. Meta Trading Club Inc shall not be held liable for any losses or damages arising from the use of information presented in the blog posts.


