

What You Gained by Reading Last Week’s Market Mornings and What You Missed If You Didn’t!
Last Week’s report
Economic Reports
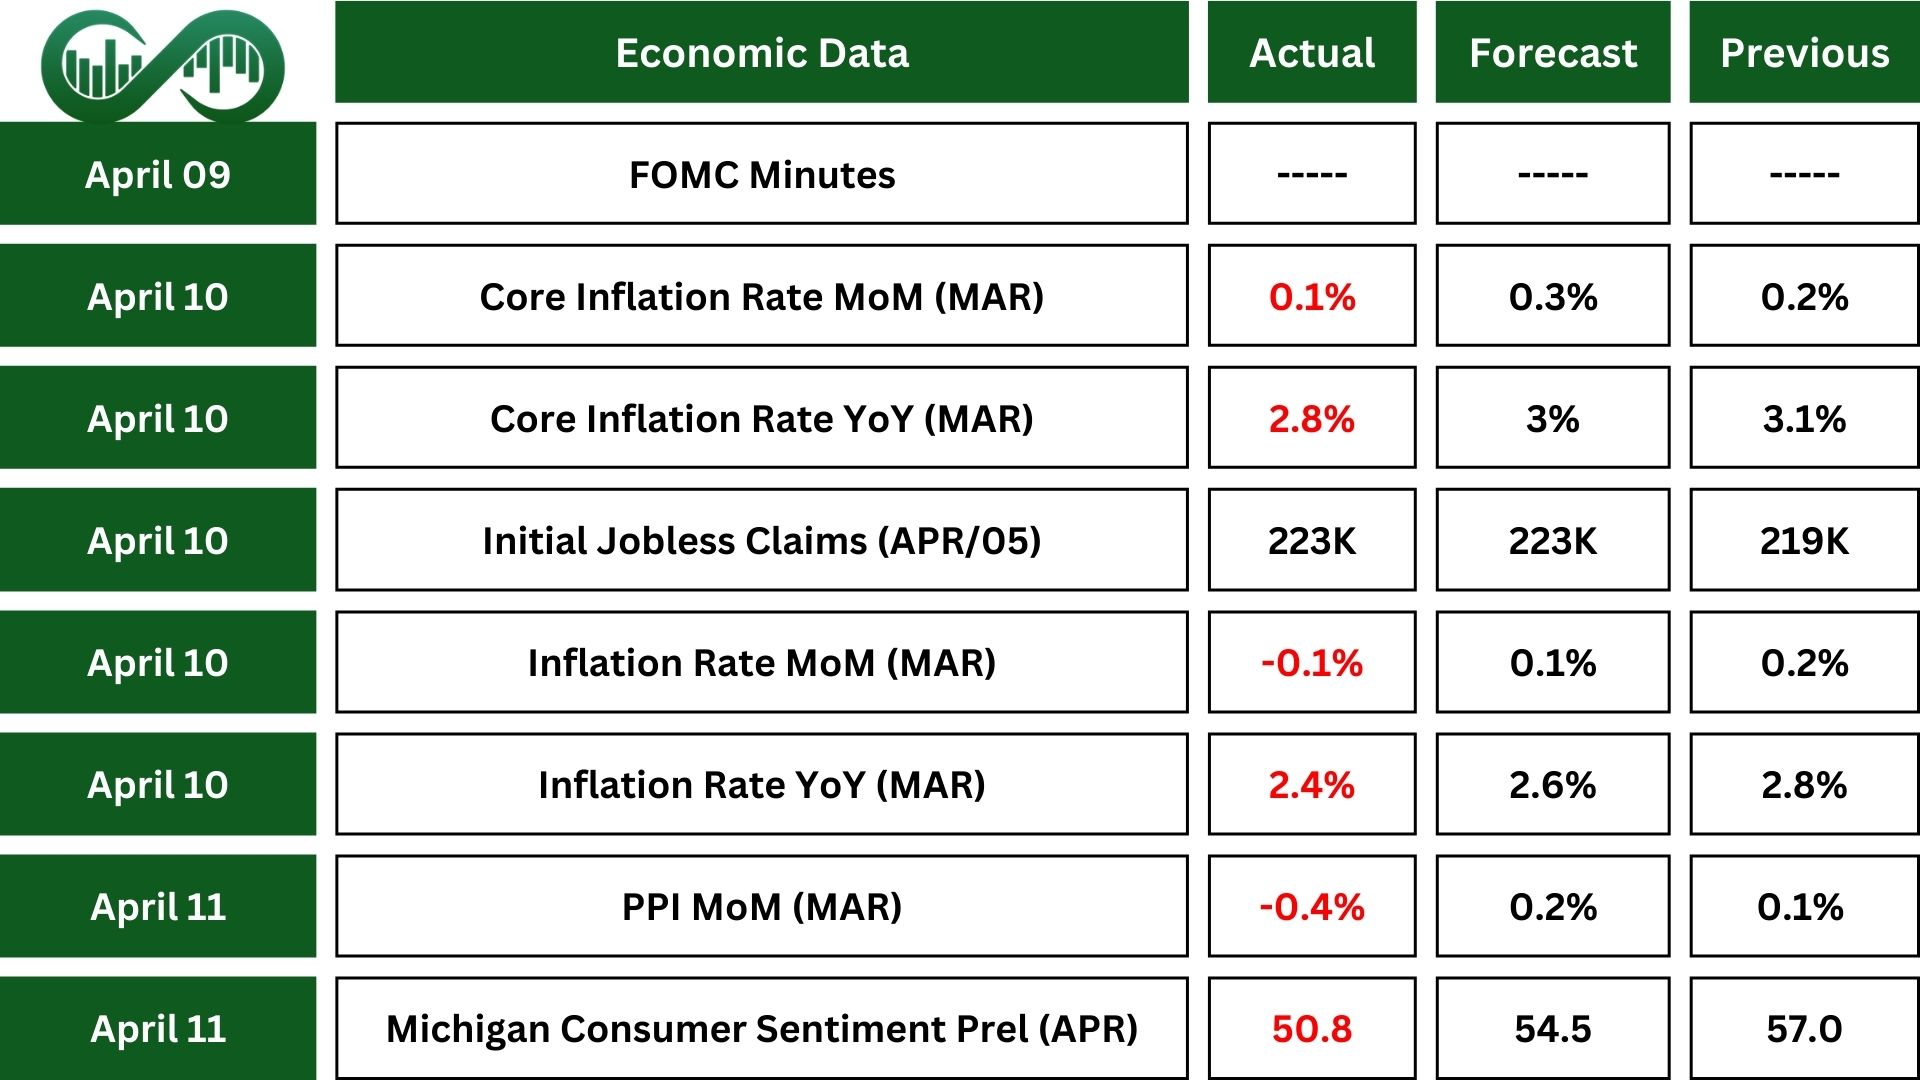
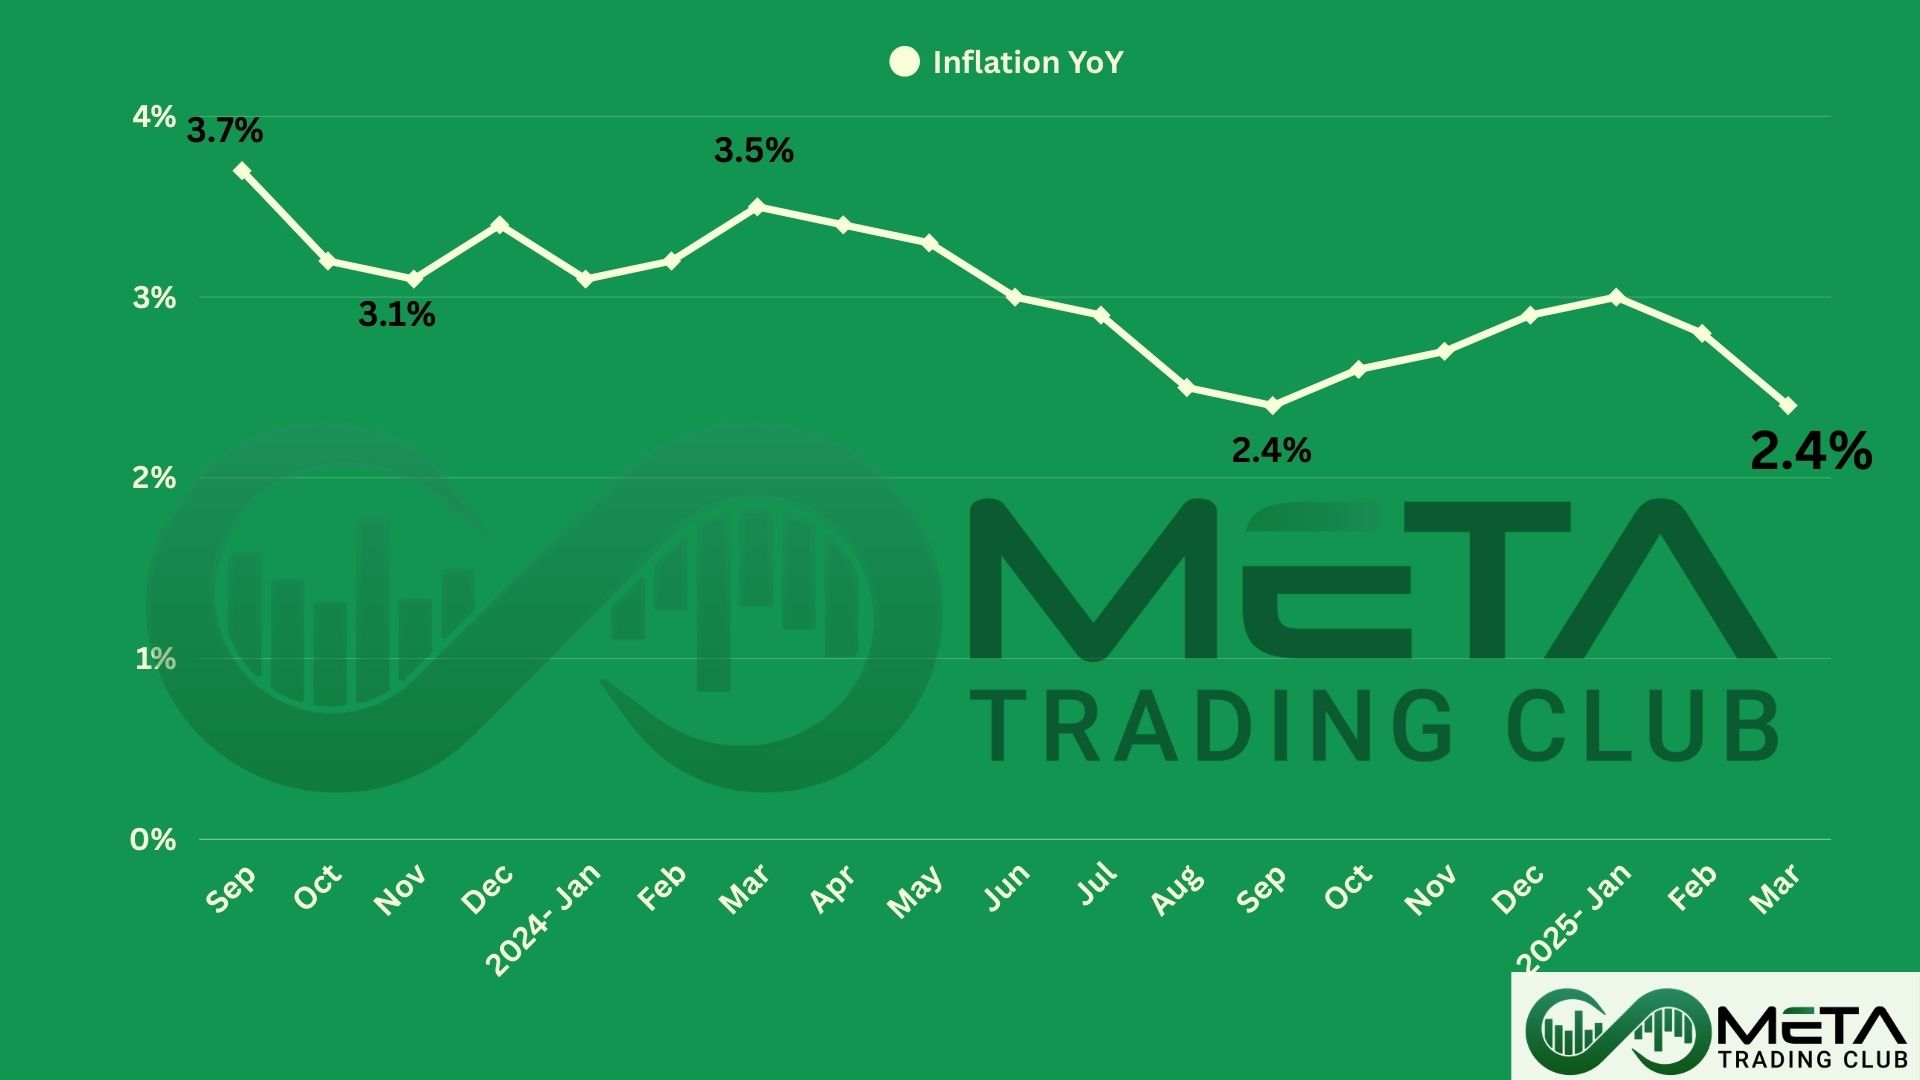
Inflation in the U.S. slowed to 2.4% in March, down from 2.8% in February and lower than the expected. This decrease was driven by a 3.3% drop in energy prices. Food costs increased by 3%.
The March CPI report revealed a 0.1% monthly drop (the first decline in five years). This lower inflation could boost investor confidence, benefiting growth sectors like technology. However, rising food costs could impact consumer spending. Also, the slight CPI decrease may also indicate weaker economic momentum, maintaining market volatility.
Initial Jobless claims in the U.S. rose by 4K to 223K in early April, staying near historically low levels. Continuing claims decreased by 43K to 1.85 million in late March, indicating progress in job placements.
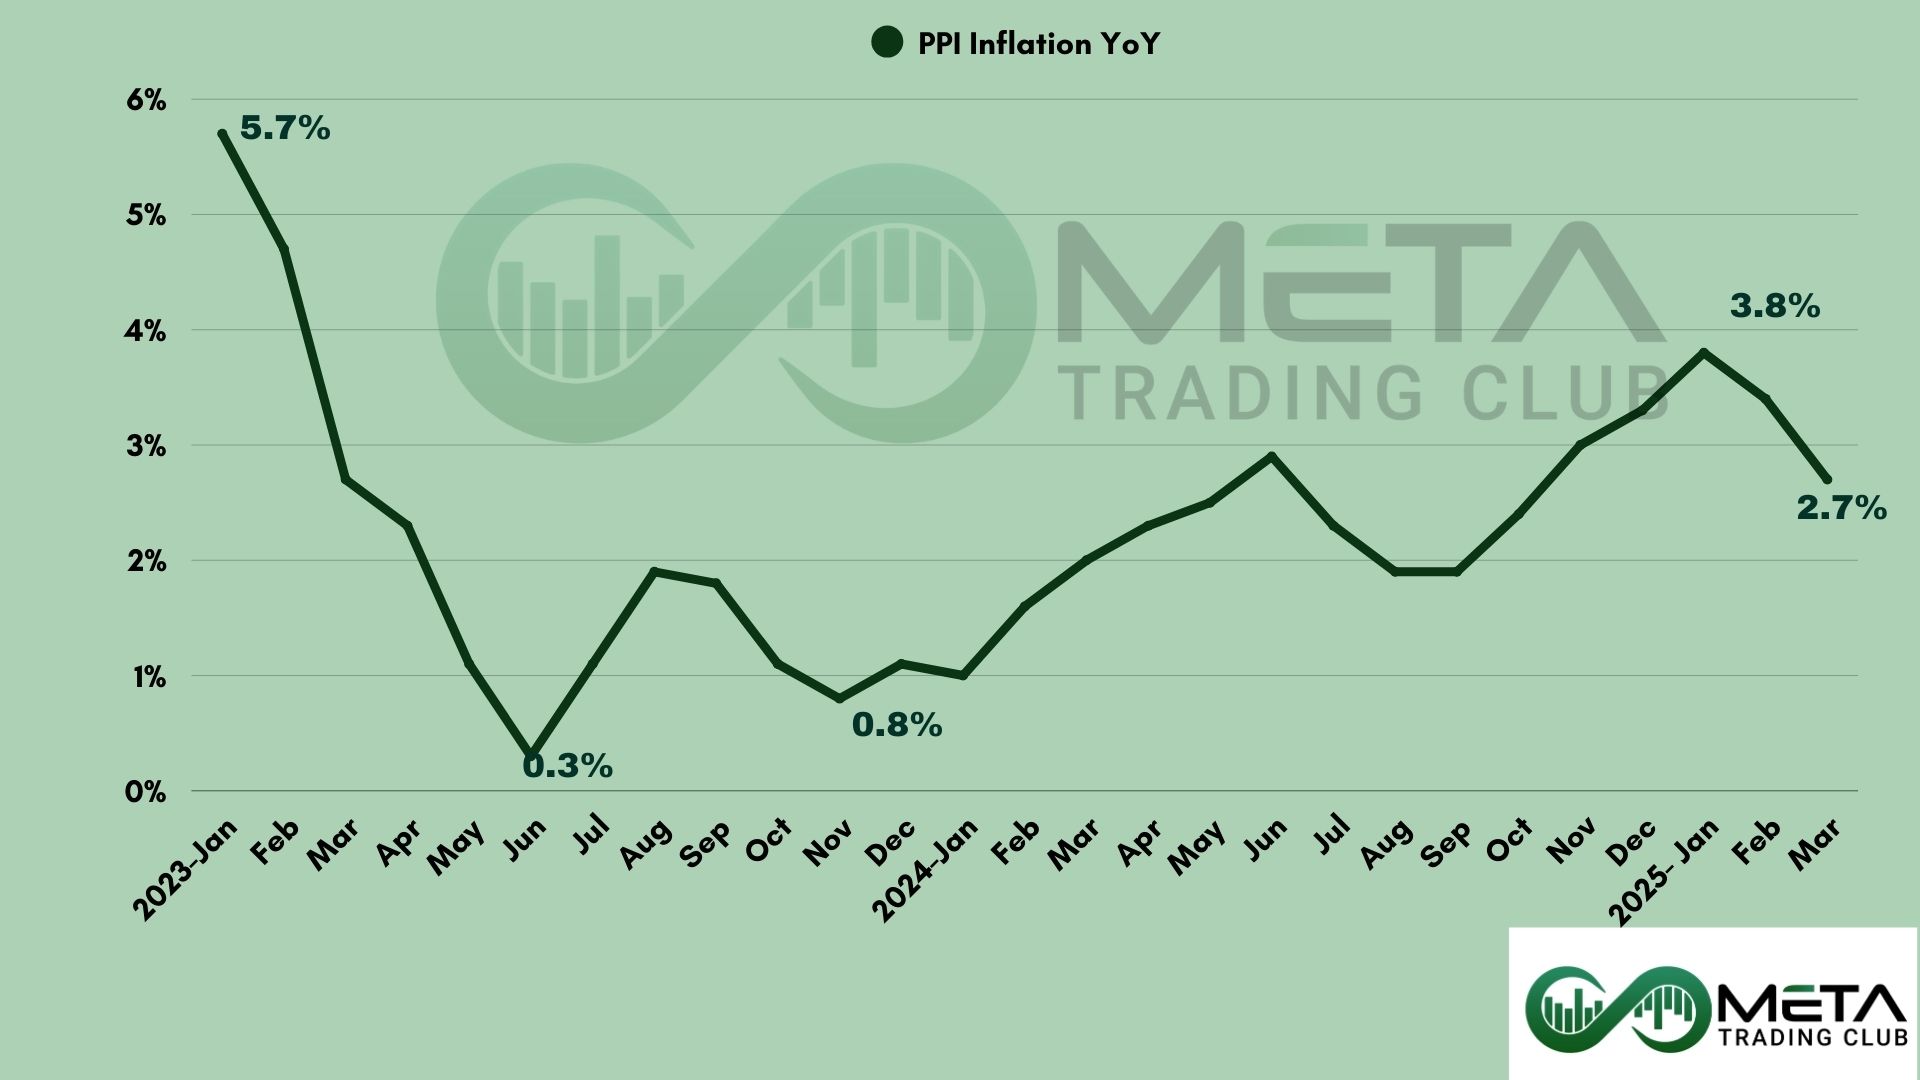
March’s PPI data showed a 0.4% drop, hinting at easing inflation pressures that could influence Federal Reserve decisions. The 11.1% decline in gasoline prices was a major factor, reducing business costs and benefiting consumers. This unexpected drop might also increase investor optimism about a potential slowdown in inflation.
Michigan Consumer sentiment fell for the fourth straight month, dropping 11% since March and over 30% since December 2024. Concerns about trade wars, worsening personal finances, and labor market fears drove this decline across all demographics.
Unemployment expectations hit their highest level since 2009, while short-term inflation expectations spiked to 6.7%, the highest since 1981. Long-term inflation expectations also rose to 4.4%. The report highlights cautious spending, slower economic growth, and increased recession risks.
Earnings Reports
BlackRock
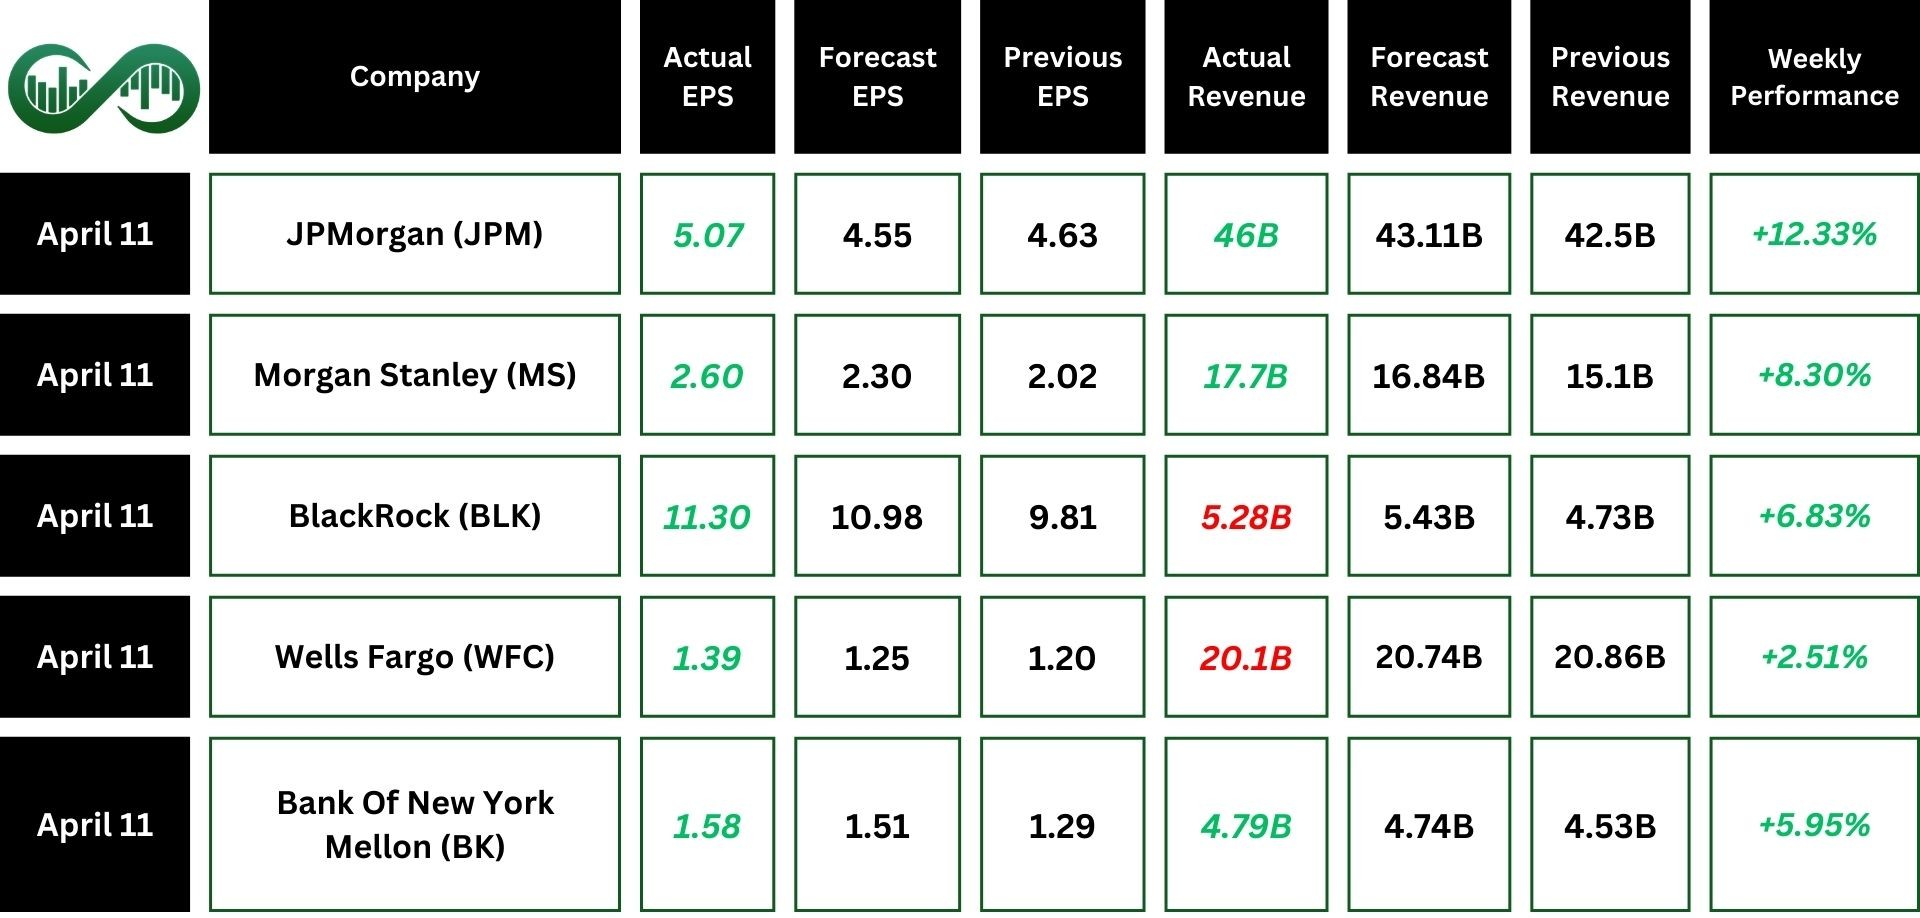
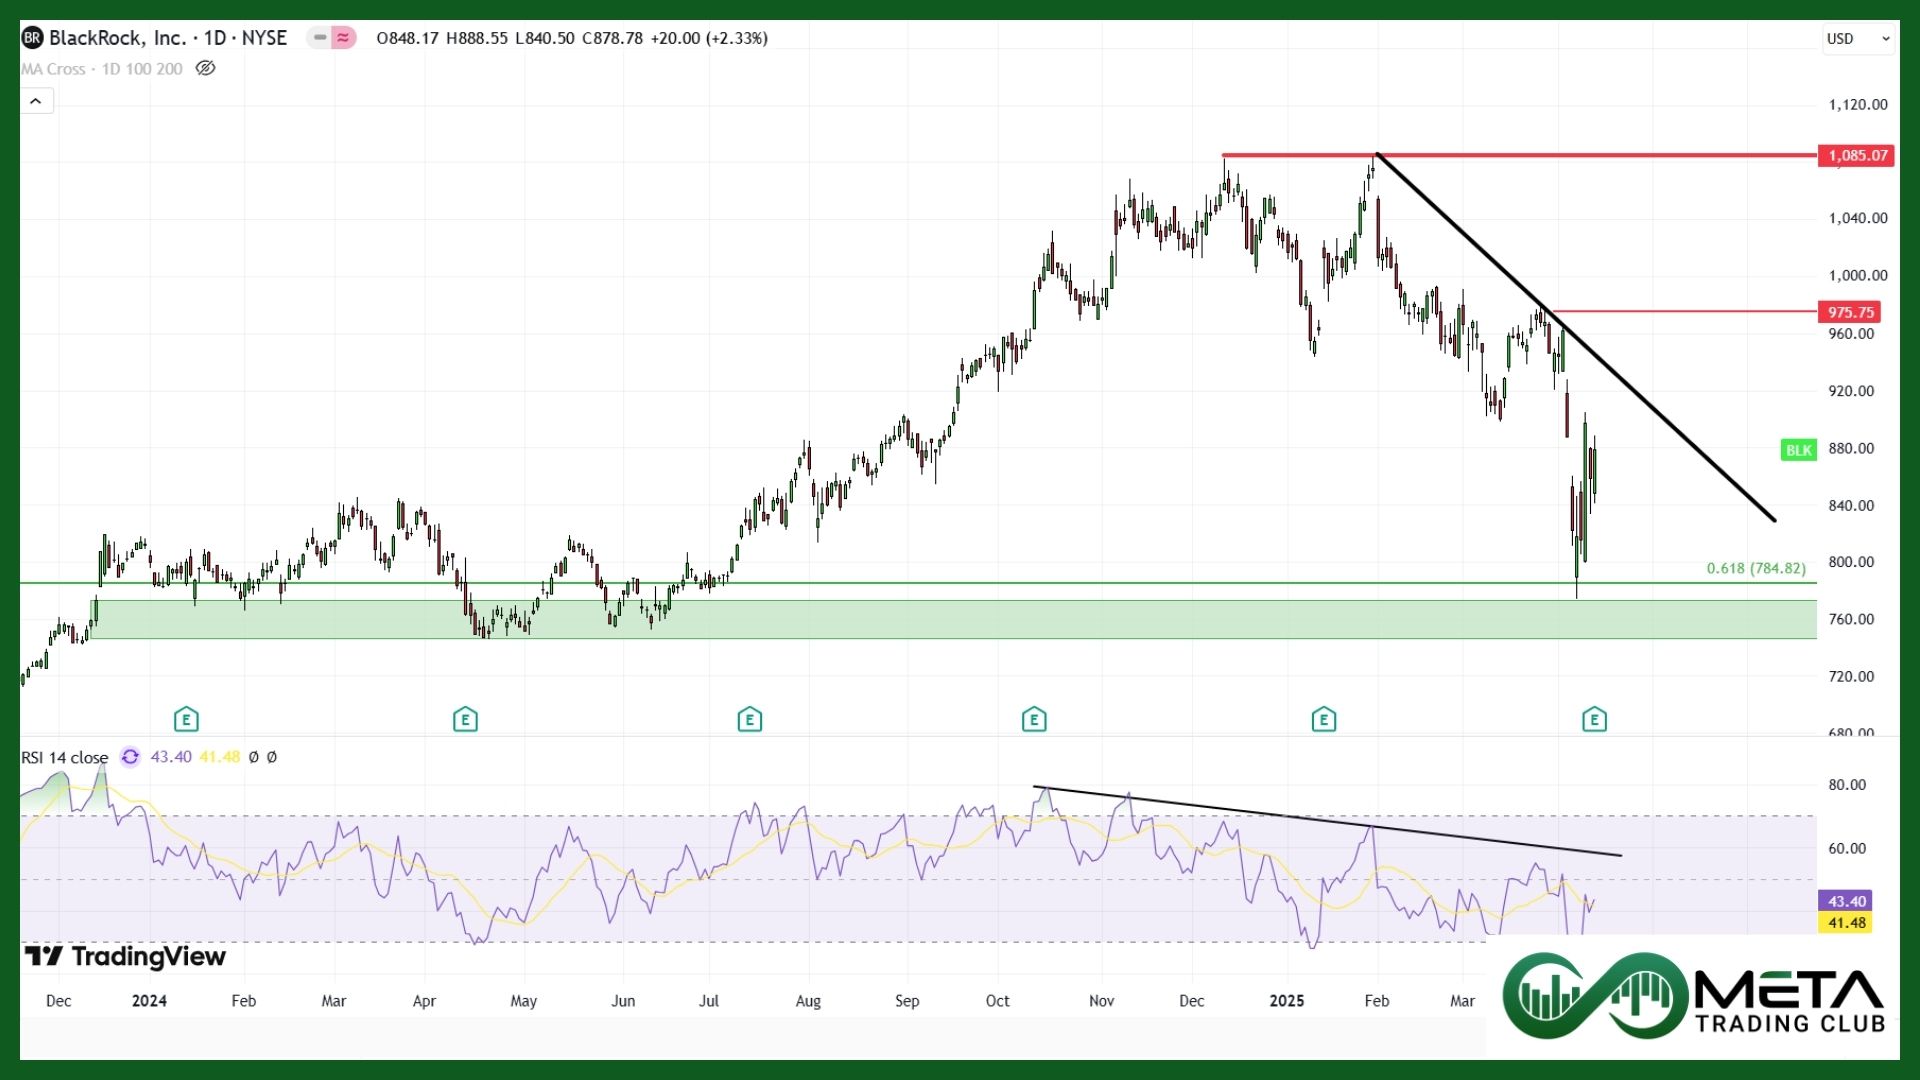
BlackRock (BLK) delivered strong Q1 2025 results, with adjusted diluted EPS of $11.30, surpassing expectations. Revenue grew by 12% year-over-year, though it missed projections. Net inflows reached $84 billion, driven by record growth in iShares ETFs, private markets, and active inflows.
Technology services revenue rose 16%, supported by Aladdin and the Preqin acquisition. Adjusted operating income increased by 14%, while adjusted EPS grew by 15%. Shareholder returns included $375 million in buybacks and a 2% dividend increase.
Despite missing revenue expectations, BlackRock showed resilience, delivering significant value in a challenging market environment.
JP Morgan Chase
JPMorgan (JPM) delivered an impressive Q1 performance with $45.3 billion in revenue and $46.0 billion in managed revenue.
The firm raised $840 billion in credit and capital and showcased strong ROE (31% in Consumer Banking, 18% in Investment Banking, and 39% in Asset Management).
Assets Under Management grew 15% year-over-year to $4.1 trillion. Shareholder value was enhanced with $3.9 billion in dividends and $7.1 billion in stock buybacks, highlighting the firm’s resilience in a challenging economic landscape.
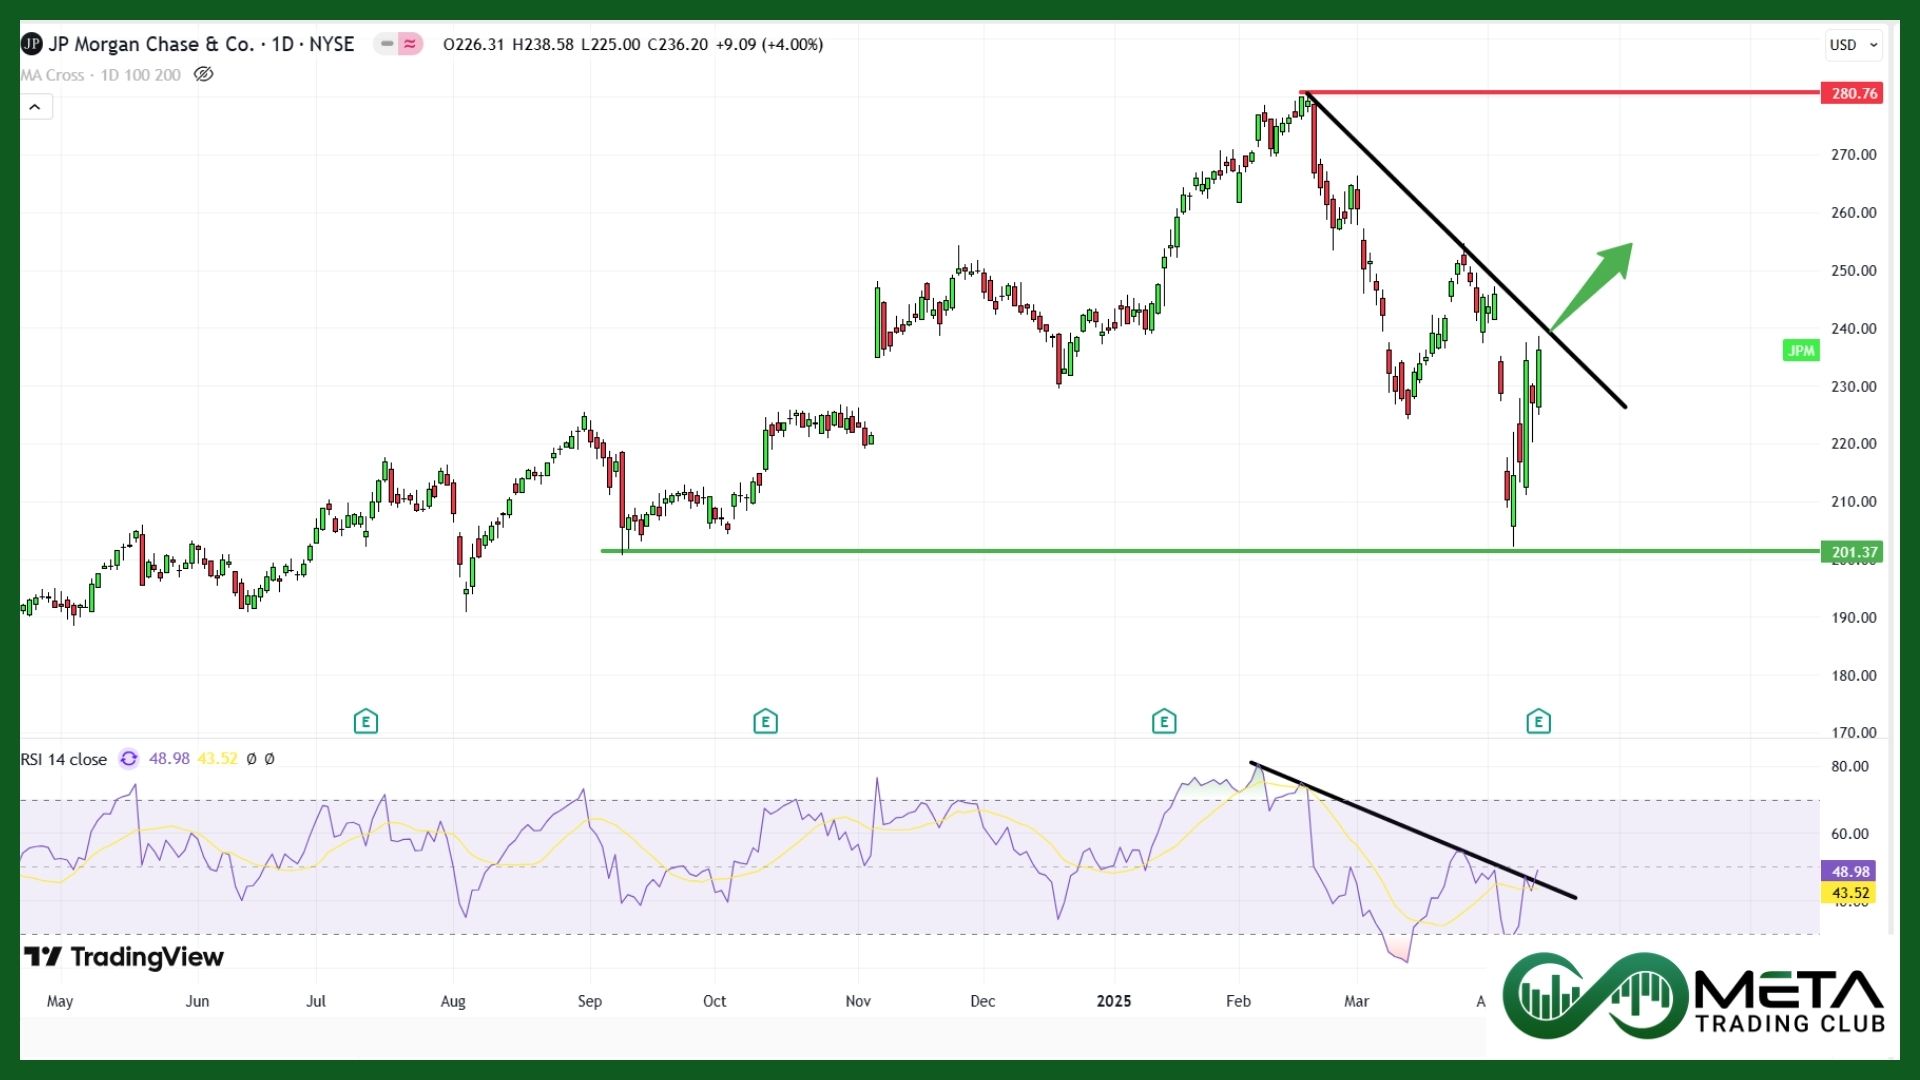
Technically, JPM experienced a reversal from a strong support level at $205. Boosted by its impressive Q1 earnings, the stock gained momentum in its RSI. If this trend persists and the stock successfully breaks its downtrend line, further increases are expected. However, if it fails to break the trendline, it may drop back to $205.
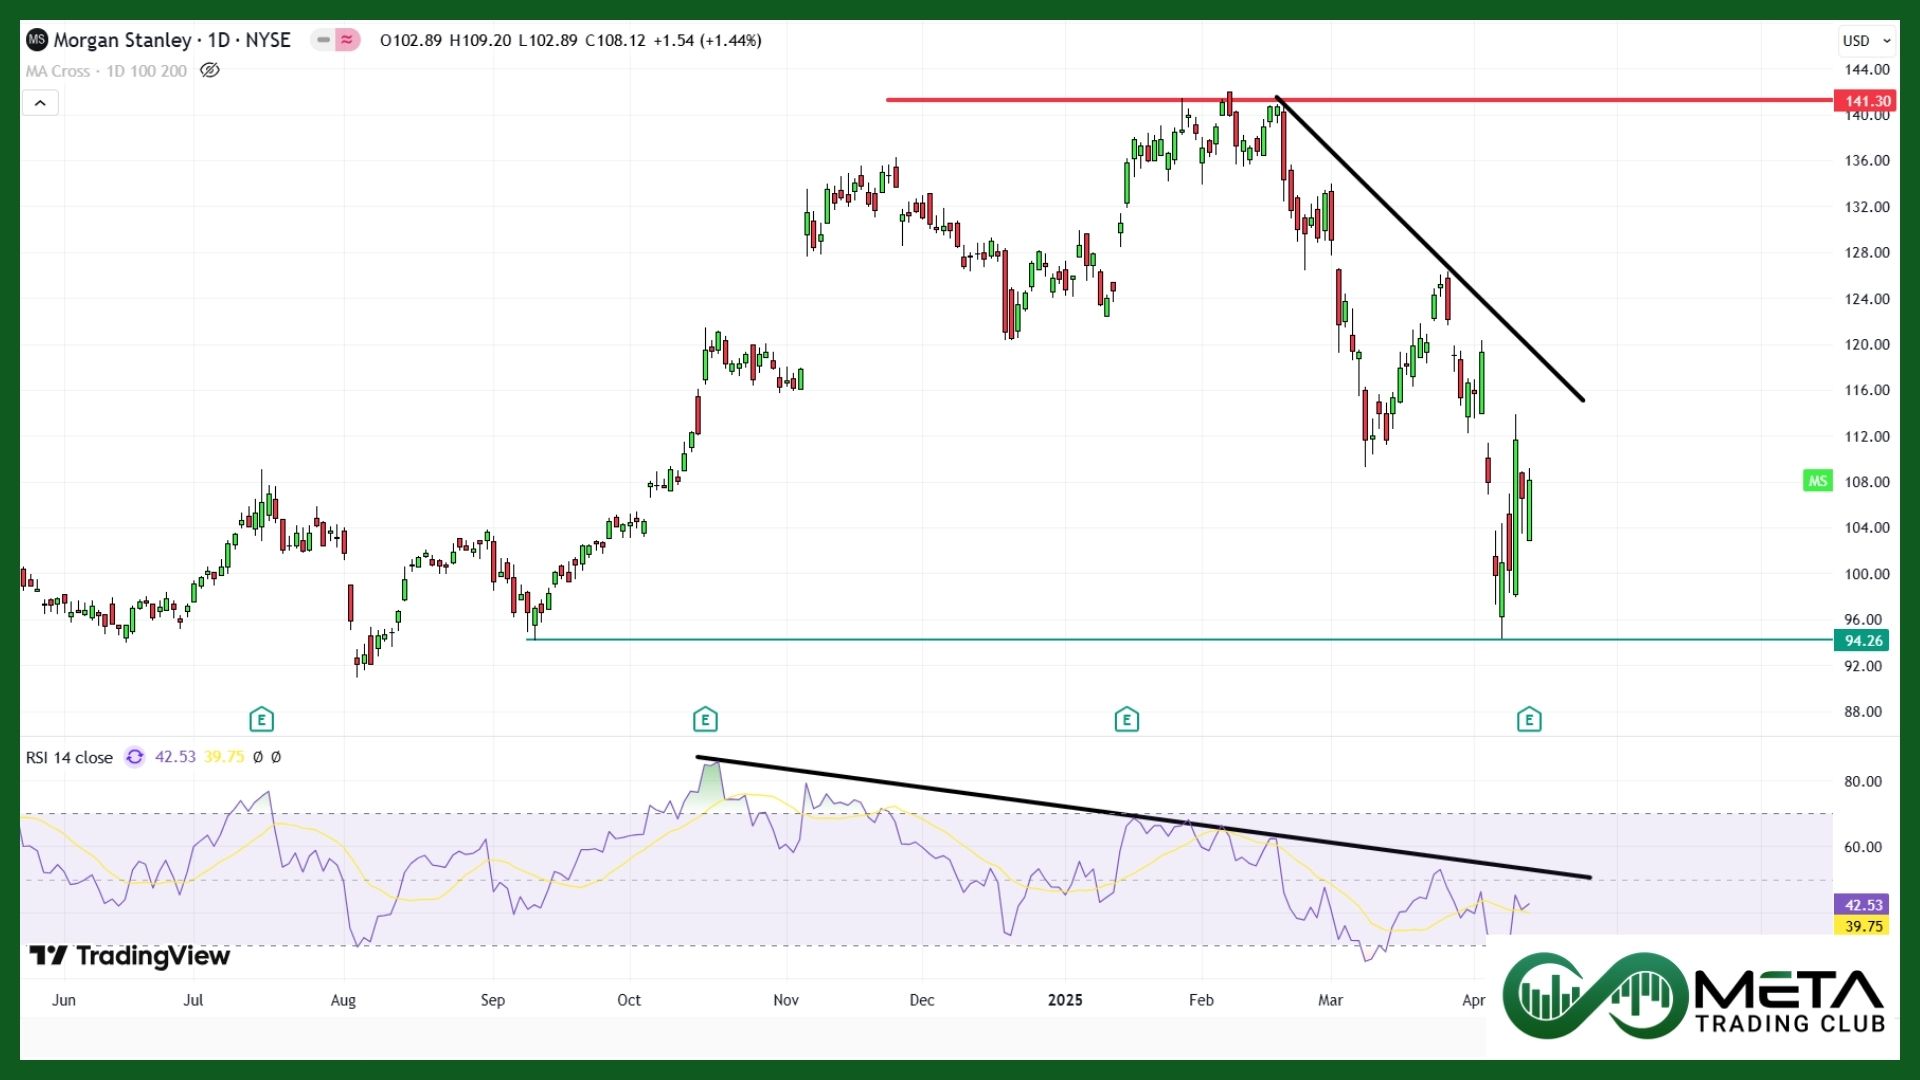
Morgan Stanley
Morgan Stanley (MS) delivered impressive Q1 results, achieving record revenues of $17.7 billion across all business segments. The firm maintained an efficient expense ratio of 68%, including $144 million in severance costs.
Institutional Securities reported $9 billion in net revenues, driven by strong equity performance and investment banking results.
Wealth Management generated $7.3 billion in net revenues and investment Management posted $1.6 billion in net revenues.
Tariff Reports
President Trump announced a 90-day pause on reciprocal tariffs for over 75 countries, aiming to create space for trade negotiations. During this period, a flat 10% tariff will apply to imports from these nations. However, tariffs on Chinese goods were sharply increased to 125%, reflecting a tougher stance amid ongoing trade tensions.
Also, China raised tariffs on U.S. goods from 84% to 125%, escalating trade war tensions. Beijing declared American exports to China unviable and criticized U.S. tariffs as violating WTO rules, filing another complaint. Countermeasures include higher tariffs and limits on U.S. movie imports.
In response, the White House clarified that total tariffs on China are now 145%, not 125%.
Indices
Indices’ Weekly Performance:
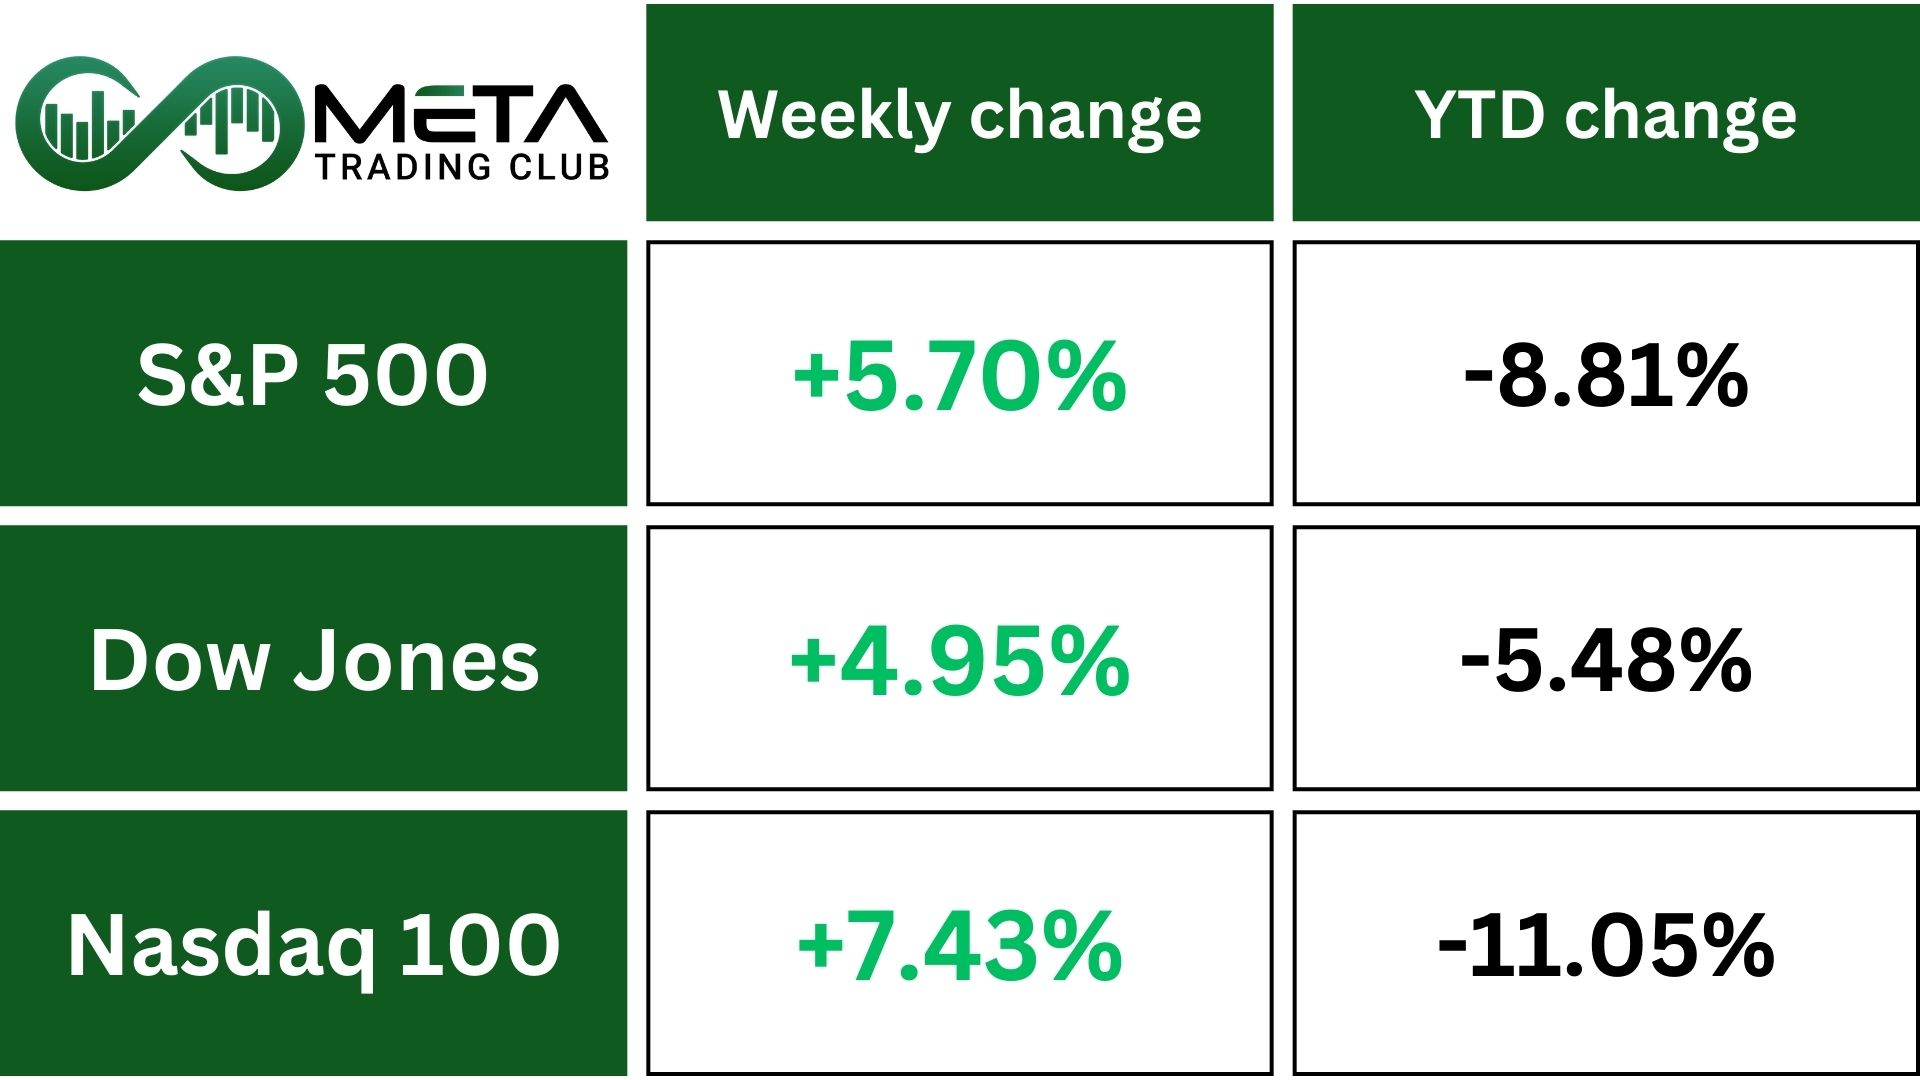
US equities closed higher, wrapping up a volatile week. Traders faced uncertainty while trying to assess how the escalating trade war between the US and China might affect the global economy.
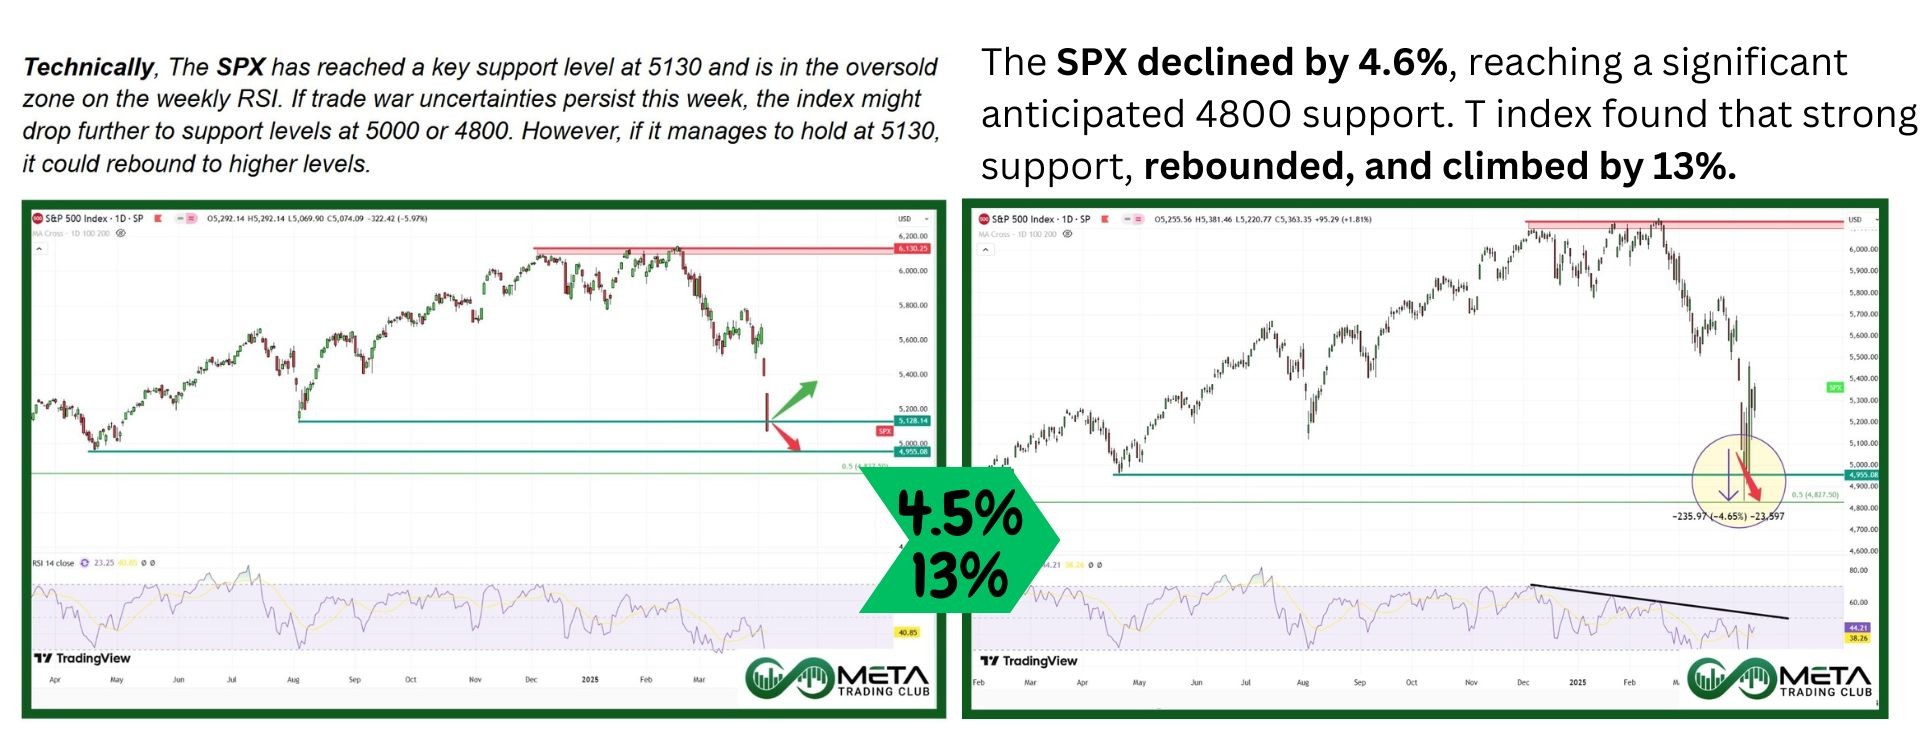
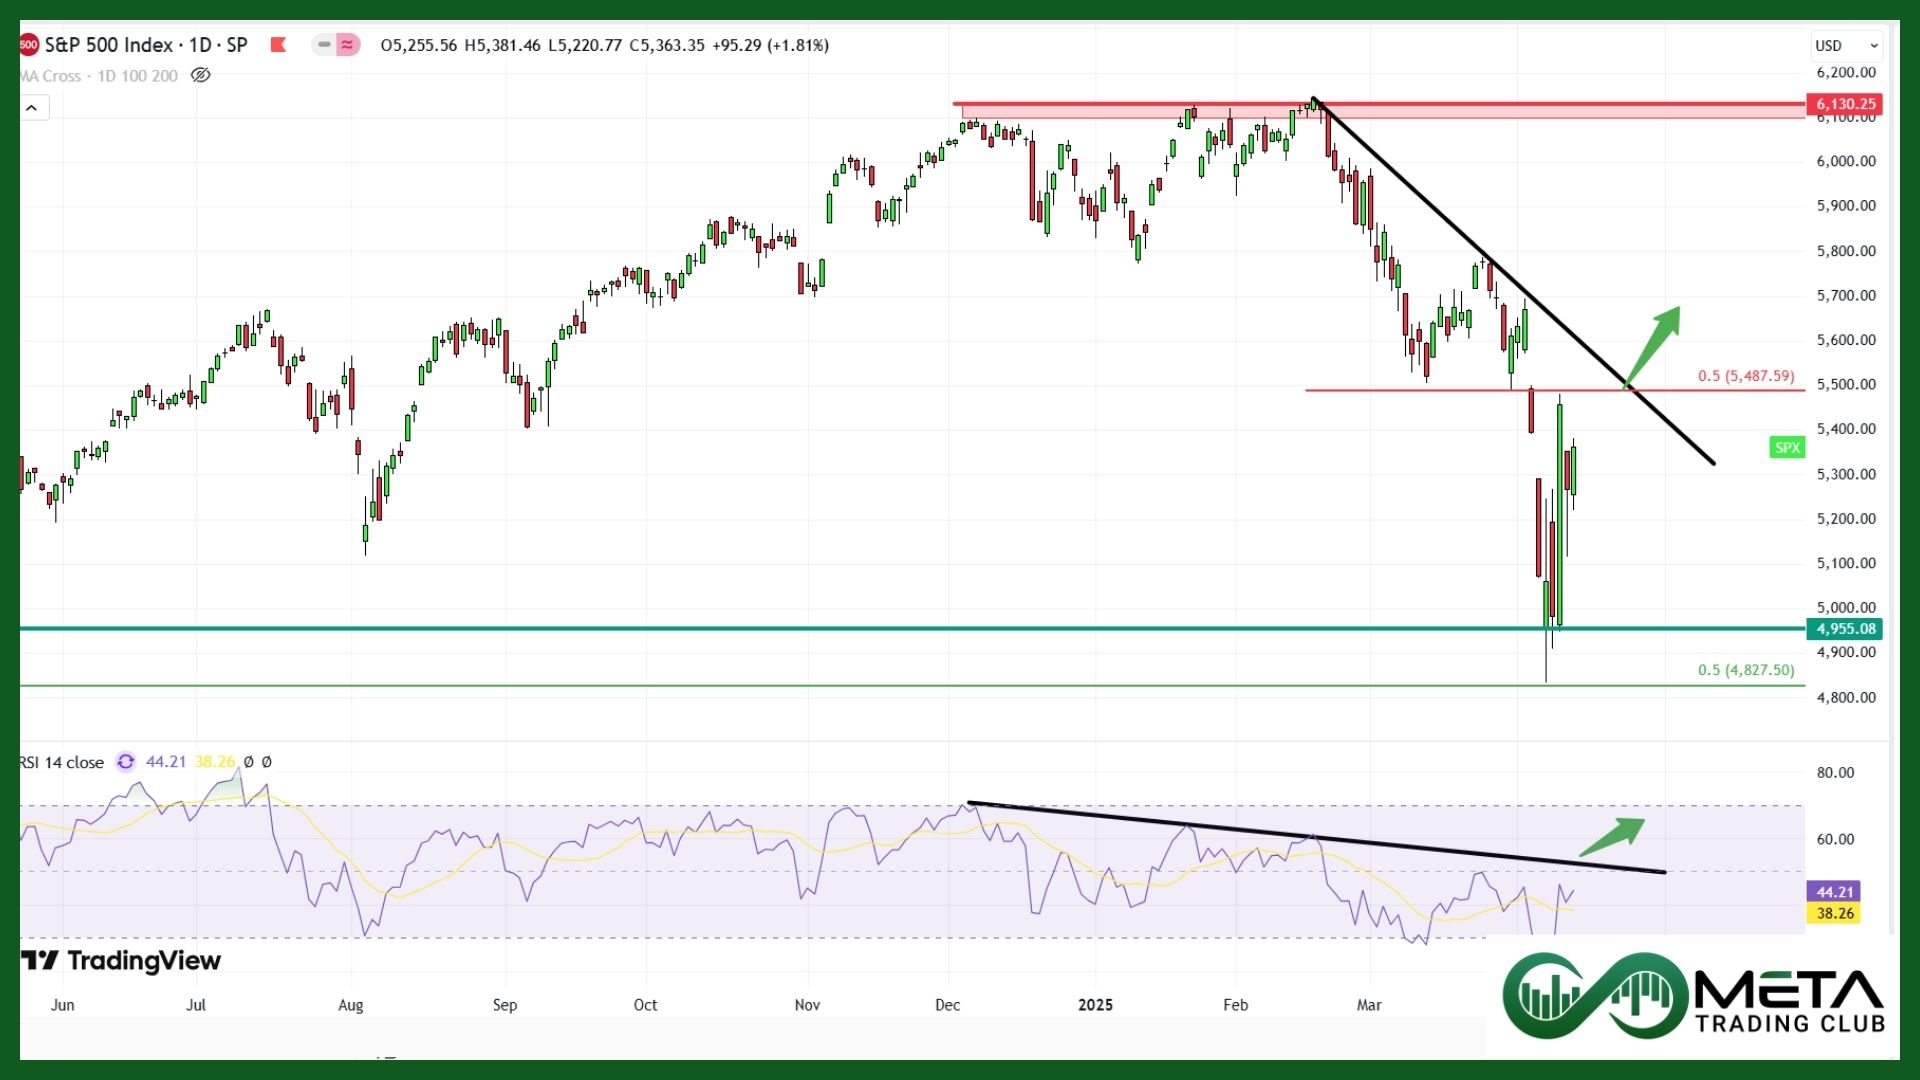
The S&P 500 (SPX) ended a wild week up 5.7%, breaking a two-week losing streak. The Dow (DJI) gained 5%, and the Nasdaq (NDX) climbed 7.3%.
At the start of the week, SPX and Nasdaq seemed headed for more losses, but both found support and reversed course. Even so, the S&P 500 still faced tough chart resistance, while the Nasdaq showed signs of potential recovery.
It was a highly volatile week, with SPX’s weekly range reaching the highest since the pandemic market low. The fear index (VIX) closed at 37, signaling high uncertainty, after spiking above 50 earlier in the week.
Technically, SPX reached the Fibonacci resistance near 5500. If it builds momentum and breaks both the downtrend line and the 5500 resistance, further growth is likely. However, if it fails to break these levels, the index may retreat to the lower support at 5000.
Stocks
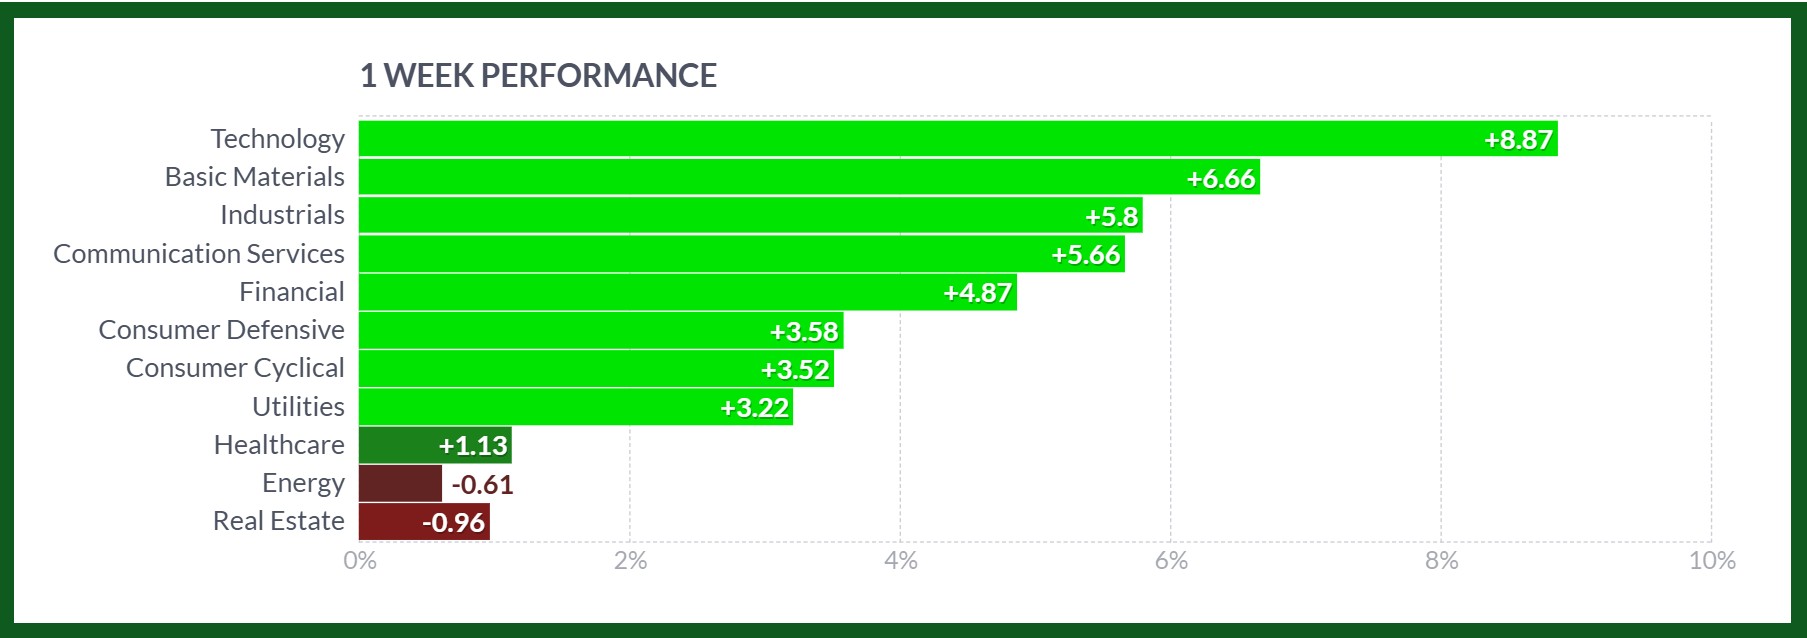
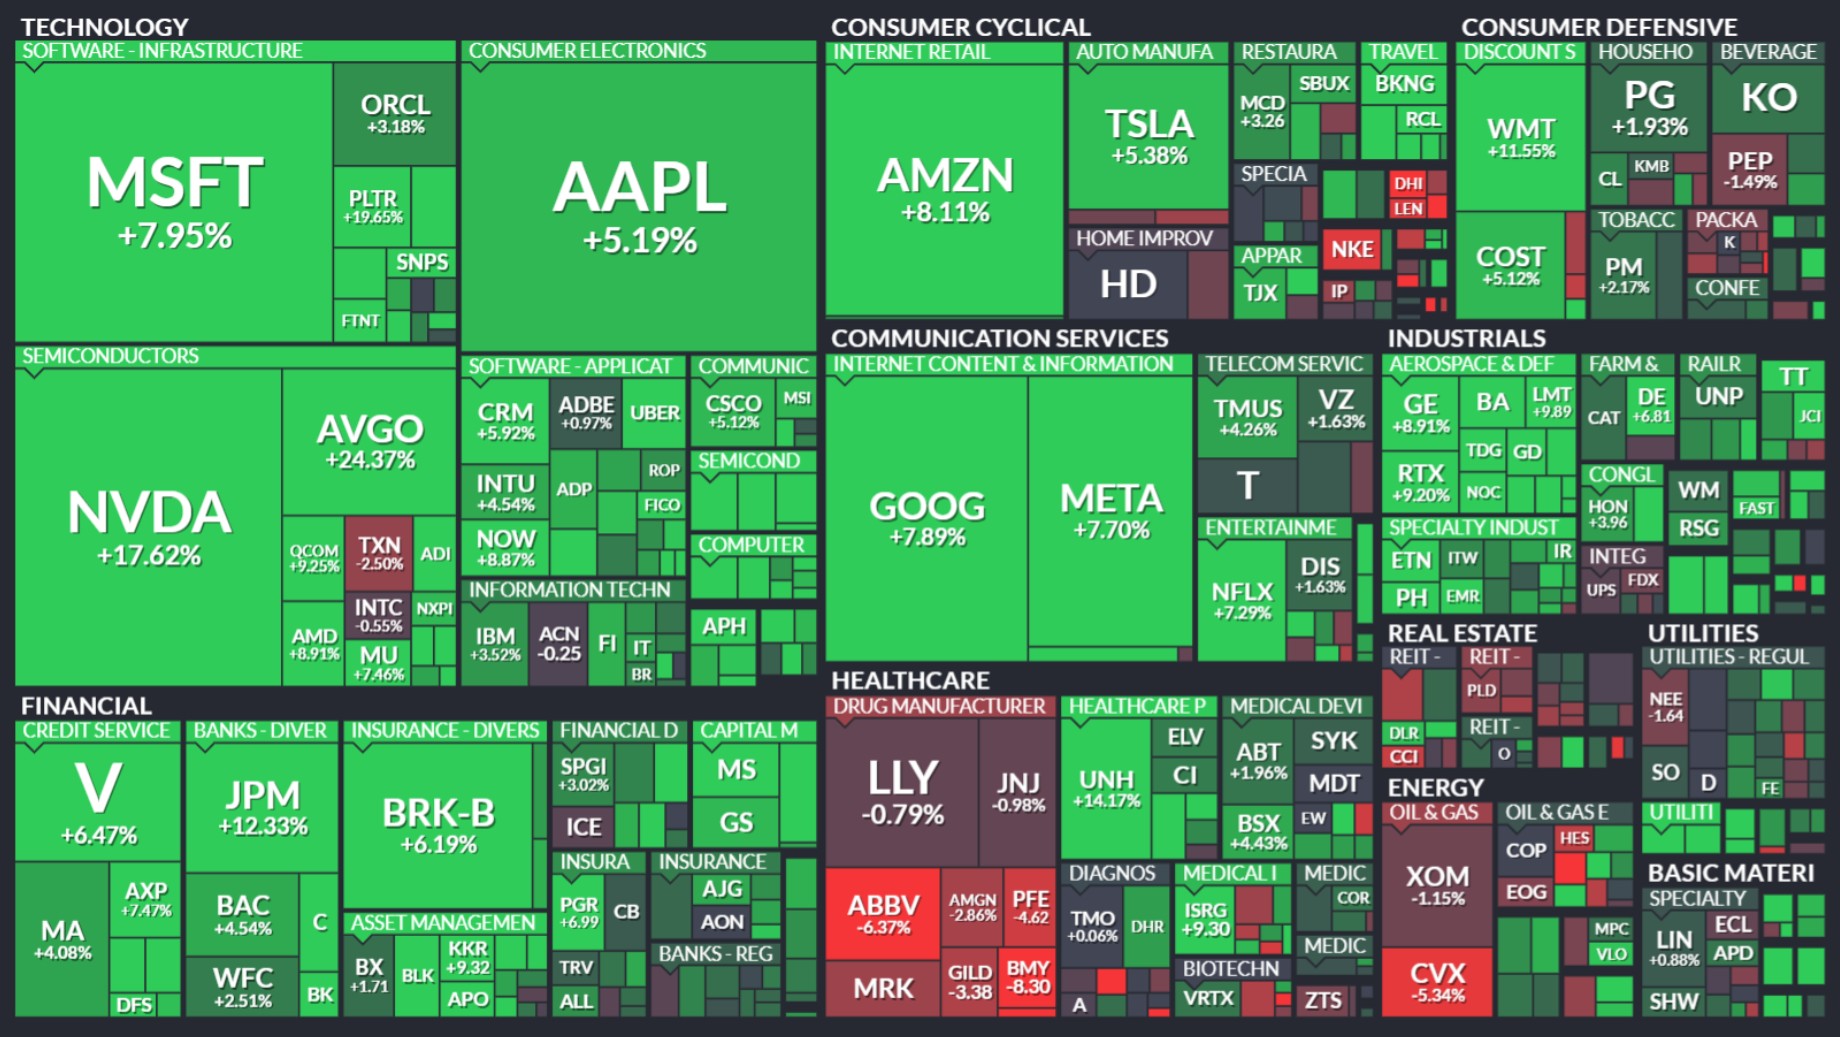
Sector’s Weekly Performance:
Source: Finviz
Almost every sector showed gains this week, with Technology leading the way, while Real Estate and Energy struggled:
- Technology: Up 9% as Broadcom surged 24% after announcing a $10 billion stock buyback. Semiconductor index jumped 11%.
- Materials: Up 6.6% as gold miners soared as gold prices hit a record high, helped by a weak dollar and trade war fears. Newmont Corp had a standout 24% weekly gain.
- Industrials: Up 6.5% as Airlines initially rose on a tariff pause but later lost momentum. Delta Air Lines climbed after beating profit expectations but dropped its 2025 forecast due to reduced demand.
- Financials: Up 5% as JPMorgan, Wells Fargo, and Morgan Stanley posted strong earnings, boosting the banking index by 7%, though regional banks slipped slightly.
- Consumer Discretionary: Gained 3.5% albeit CarMax fell 10% due to affordability concerns as tariffs raised costs.
- Healthcare: Rose 1.2% as Health insurers UnitedHealth and Humana gained 14% and 16% after an increase in Medicare reimbursement rates.
- Energy: Fell 0.6% as Oil prices hit a four-year low due to tariffs but recovered after delays were announced. Escalating trade tensions caused losses for oil companies later in the week.
- Real Estate: Dropped 1%, hurt by rising yields. Alexandria Real Estate Equities fell 5%.
Stock Market Weekly Performance:
Source: Finviz
Top Performers
Last week saw remarkable stock market performance, with several companies standing out as top gainers:
- Broadcom (AVGO): Led the large caps charge with a 24% surge, fueled by its $10 billion stock buyback plans.
- Palantir (PLTR): Gained 20%, likely driven by optimism around its expanding tech solutions.
- Arm (ARM): Rose by 18.5%, reflecting strong investor confidence in its semiconductor business.
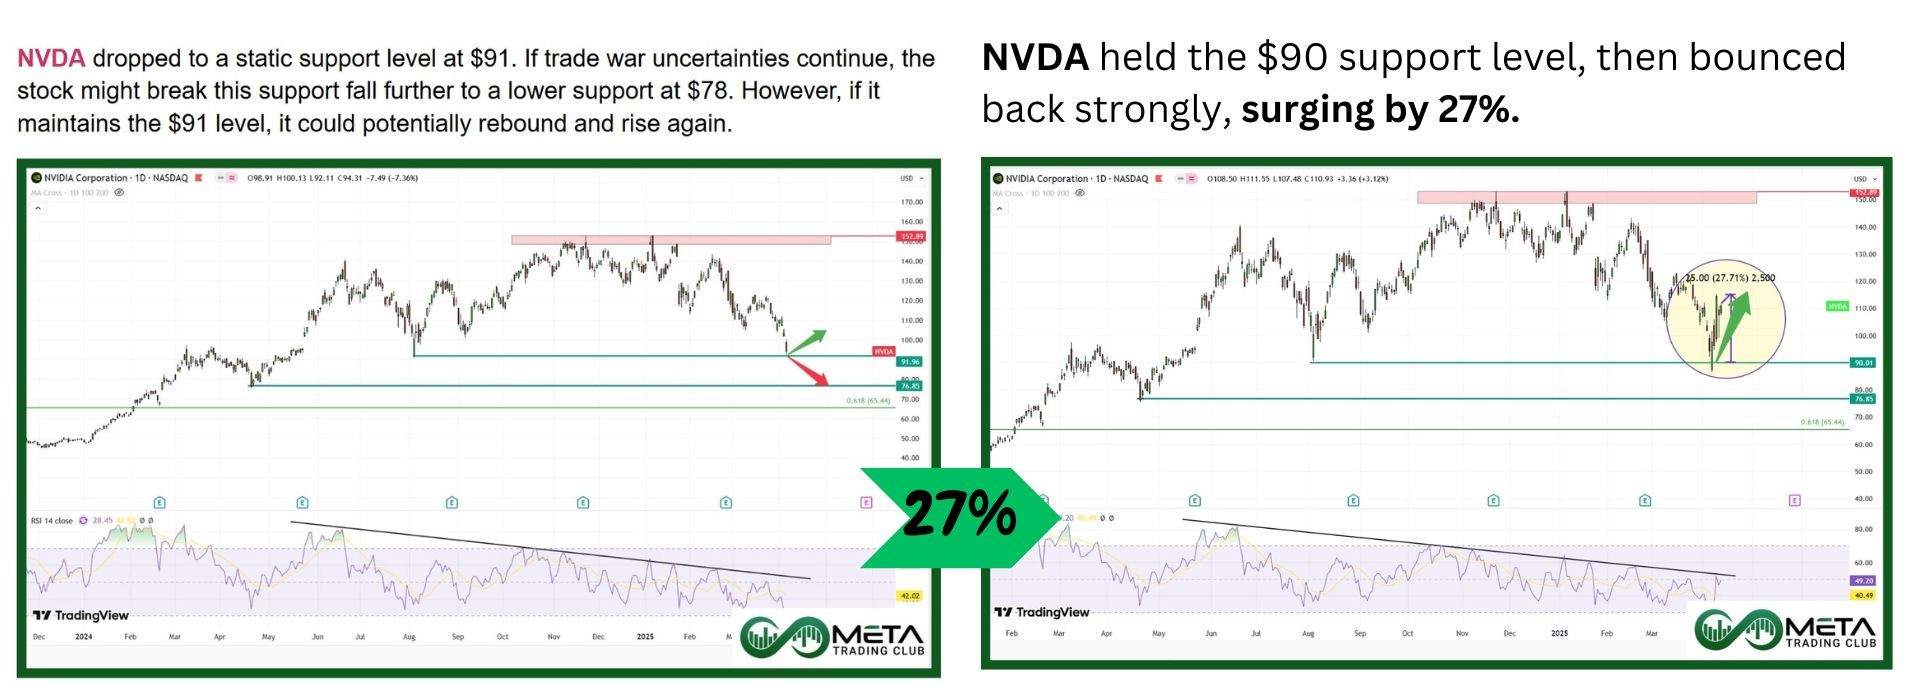
- NVIDIA (NVDA): Climbed 17.6%, continuing its upward momentum in the AI and chip markets.
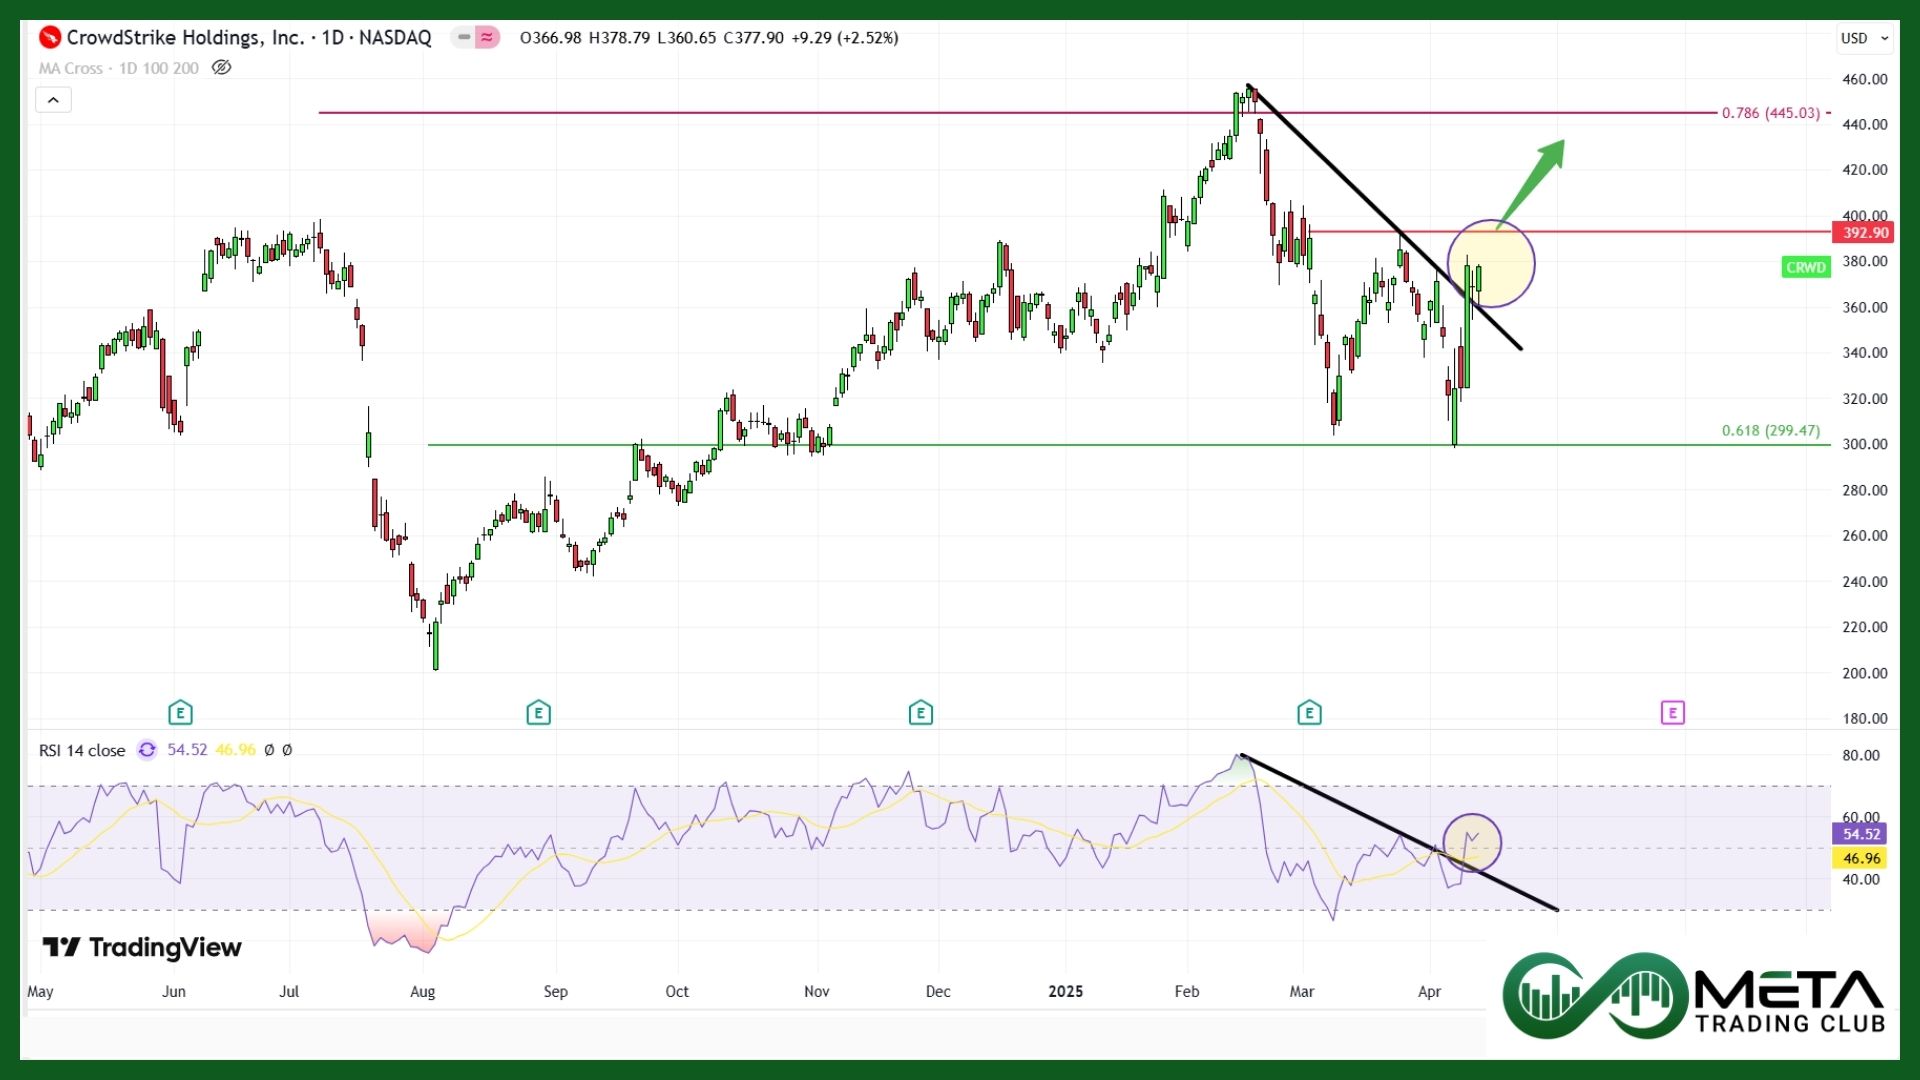
- CrowdStrike (CRWD): Increased 17.5%, as cybersecurity remains a priority for businesses.
- Boeing (BA): Gained 15%, recovering amid optimism on a tariff pause.
- UnitedHealth (UNH): Rose 14%, boosted by positive developments in Medicare reimbursement rates.
- Applied Materials (AMAT): Climbed 14%, as demand for semiconductor equipment remains robust.
- JP Morgan Chase (JPM): Increased 13%, supported by better-than-expected Q1 earnings.
- Uber (UBER): Up 12%, reflecting strong growth in its mobility and delivery segments.
Action Point
CRWD has broken its downtrend line, driven by its rising momentum. The next resistance level is at $392. If it manages to break through this resistance, it could see further gains. However, if rejected at this level, it may decline toward lower support levels.
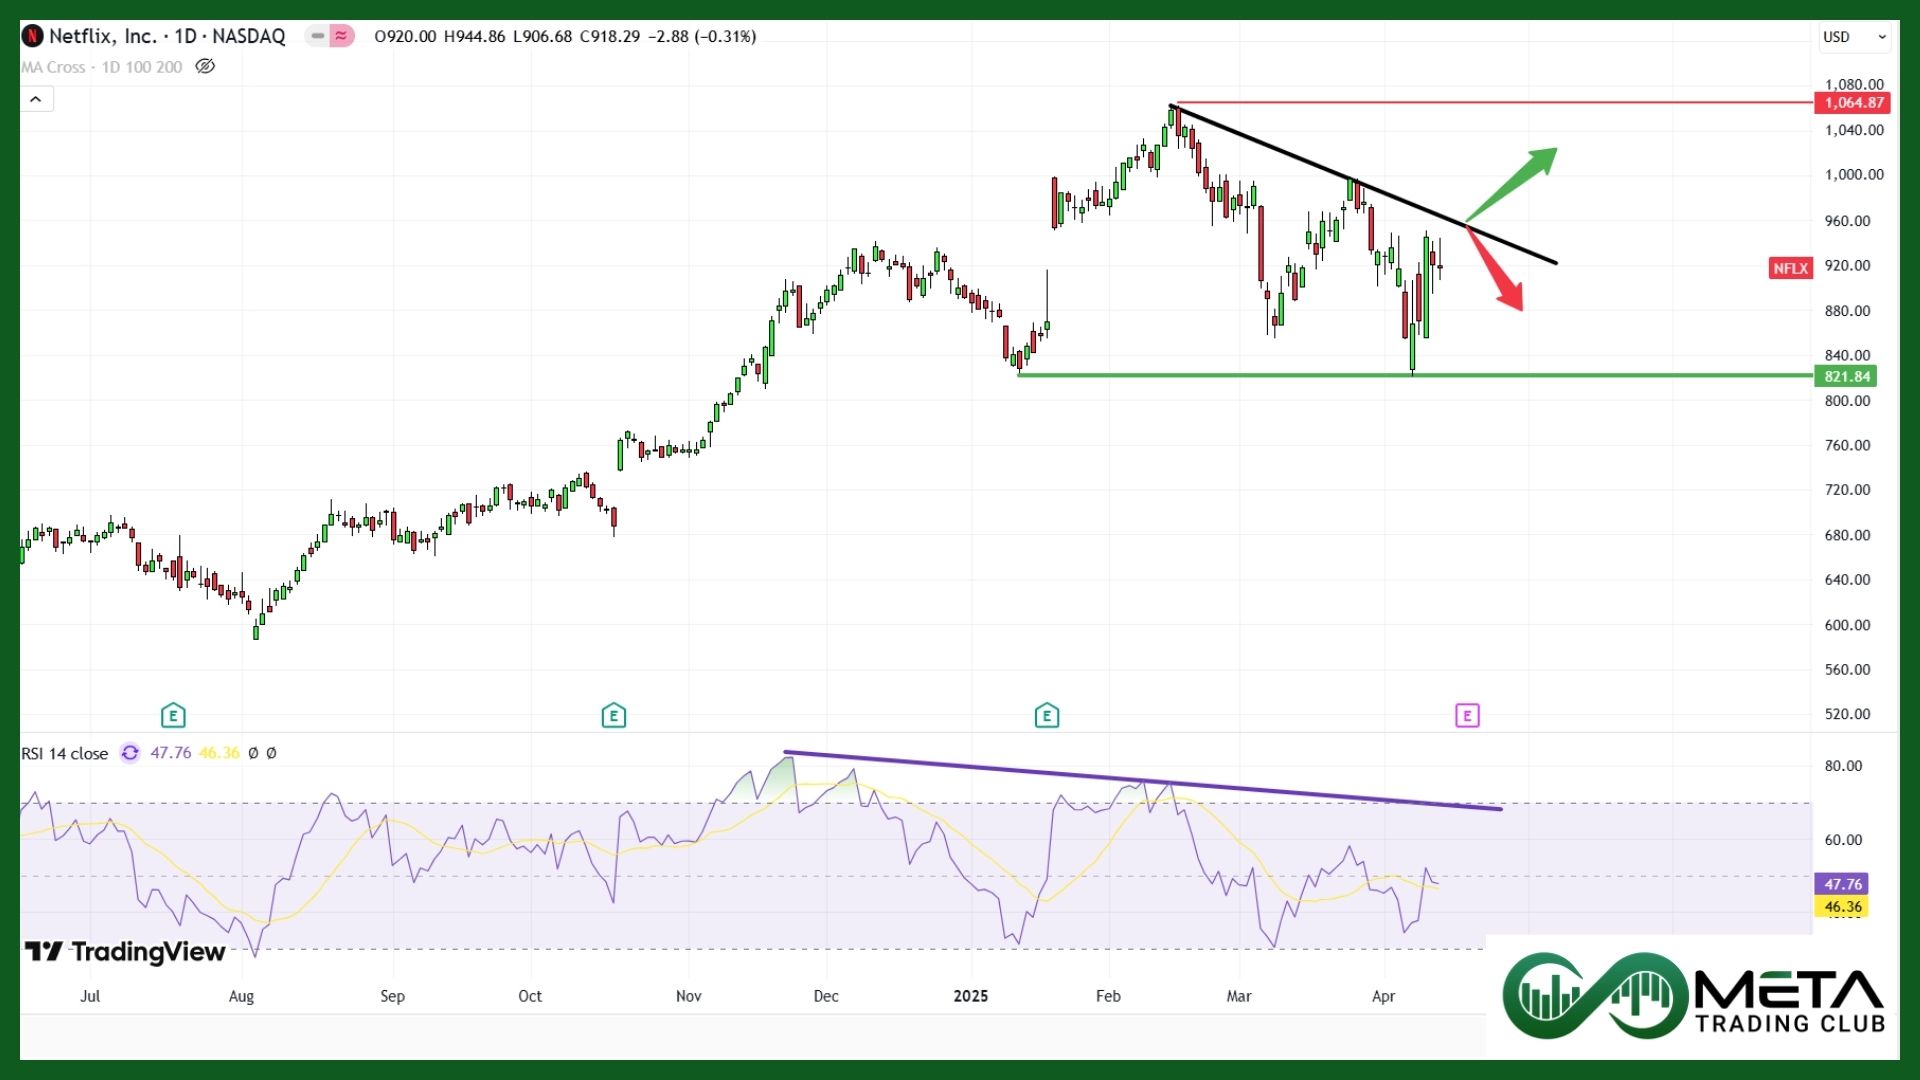
NFLX is set to release its earnings this week. A strong earnings report could enable the stock to break its downtrend line and continue its upward trajectory. However, if the earnings fall short of expectations, the stock might face rejection from this trend line and drop to the $821 support level.
Commodity
Weekly Performance of Gold, Silver, WTI and Brent Oil:
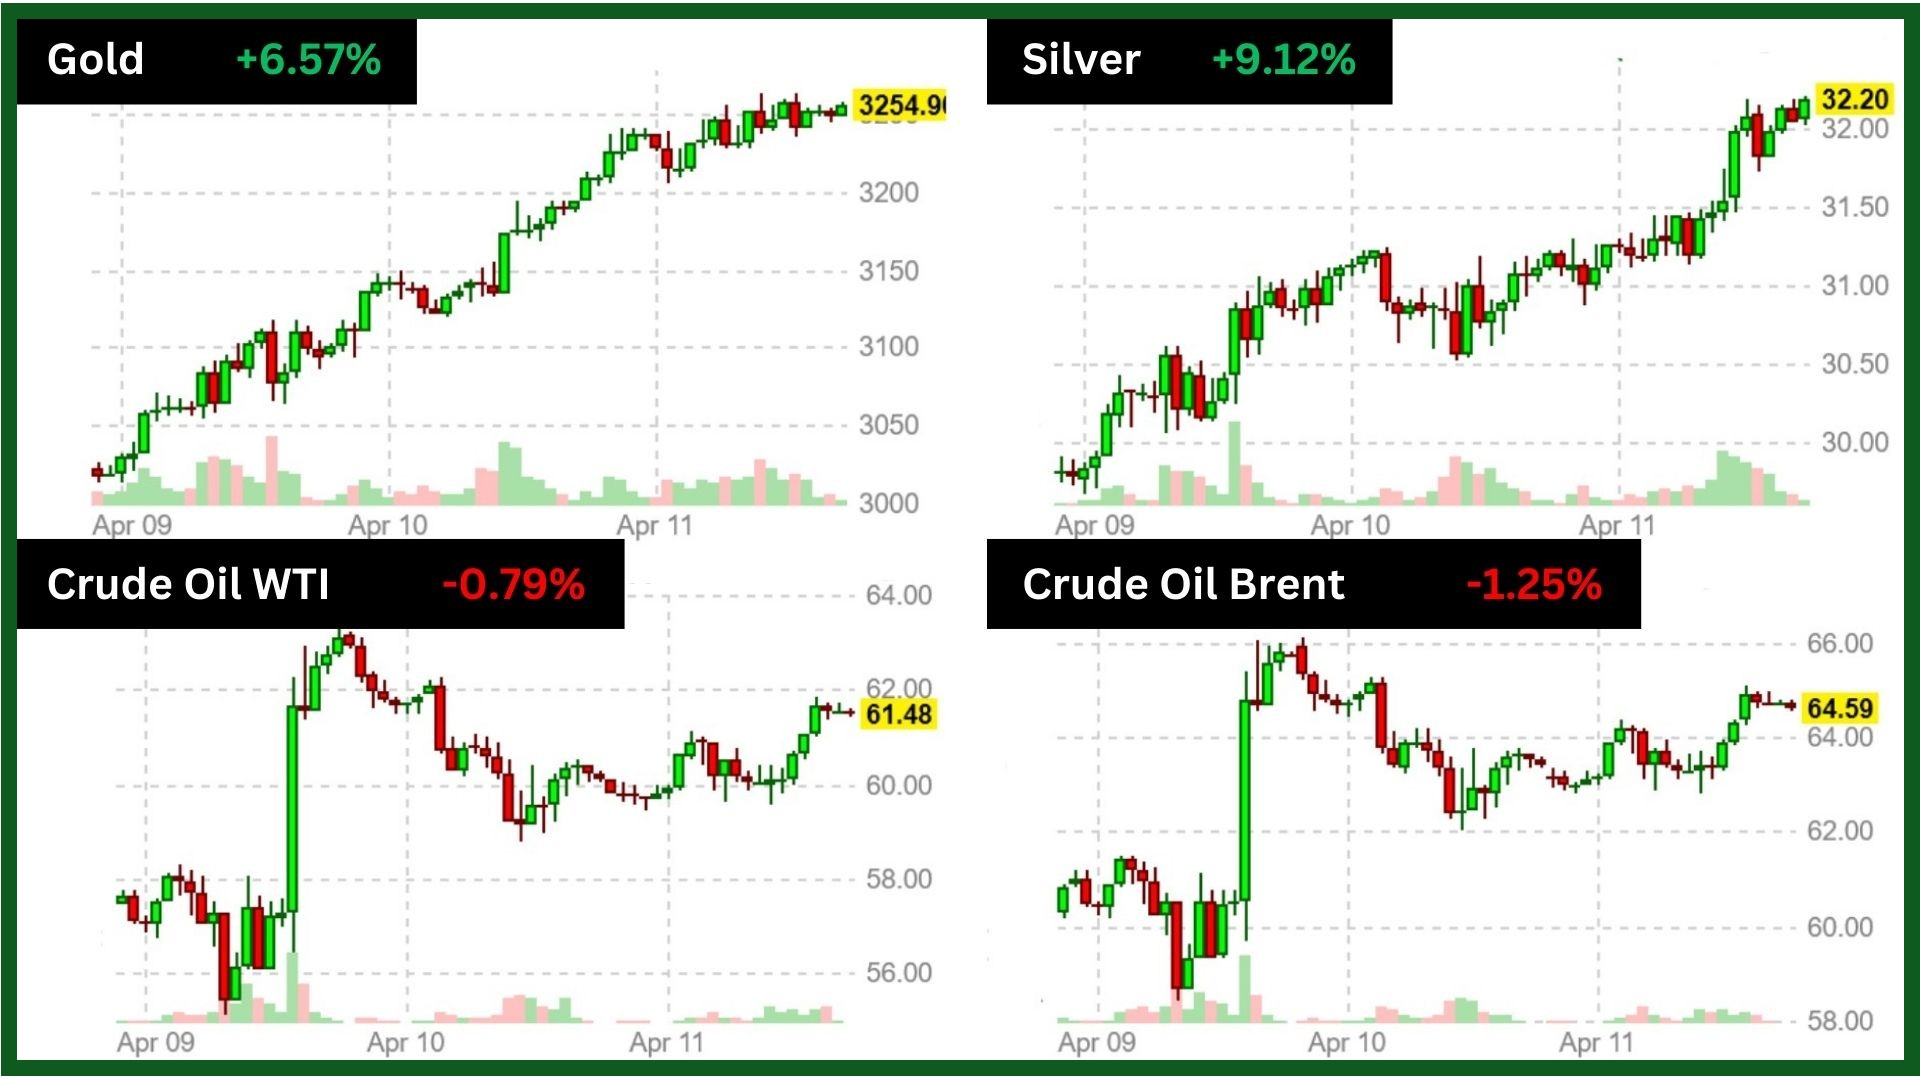
Source: Finviz
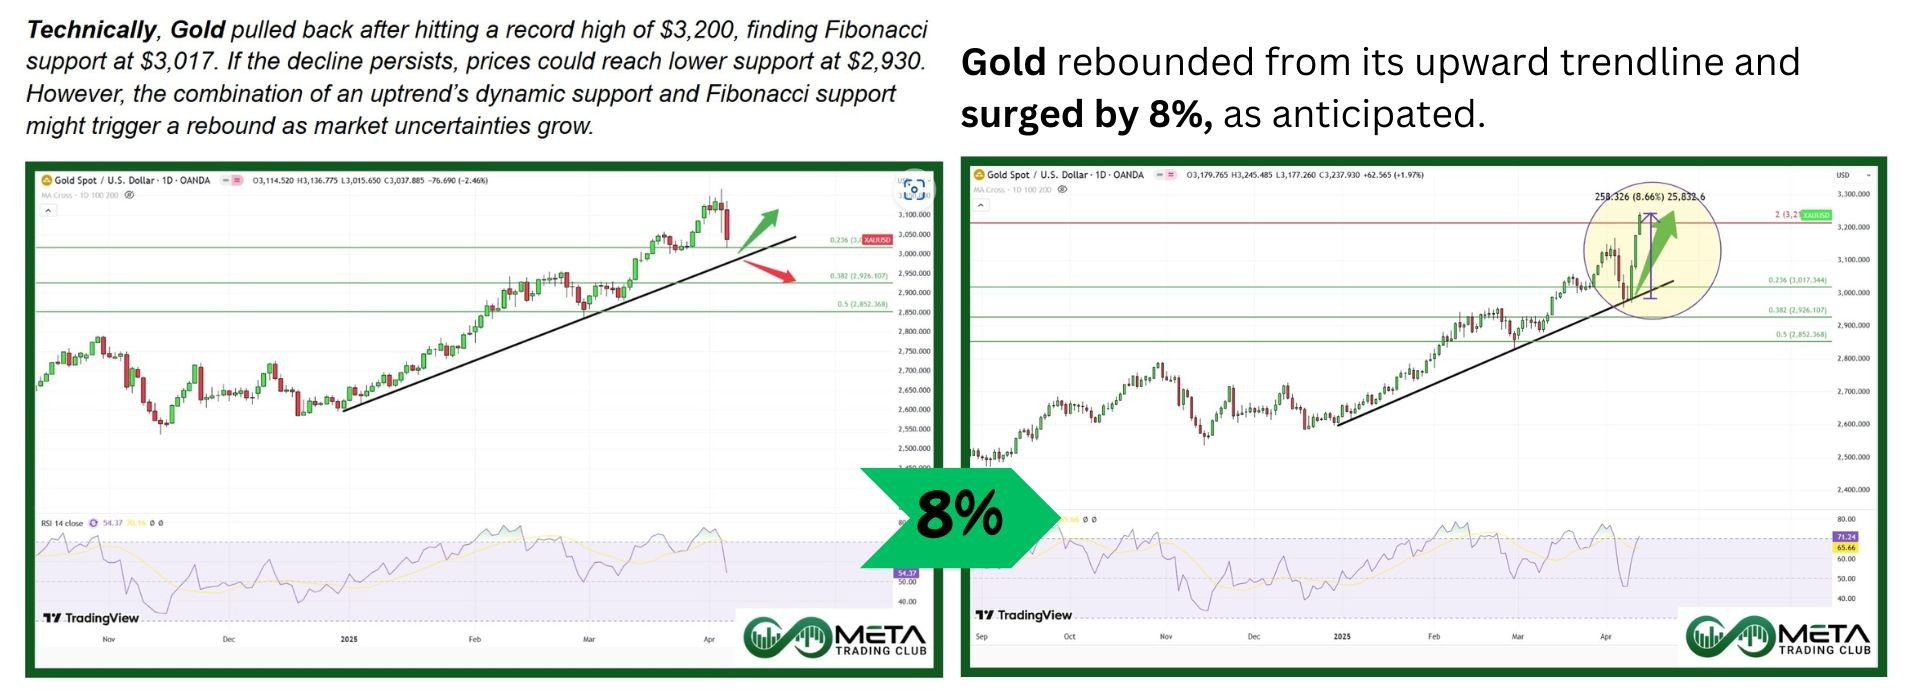
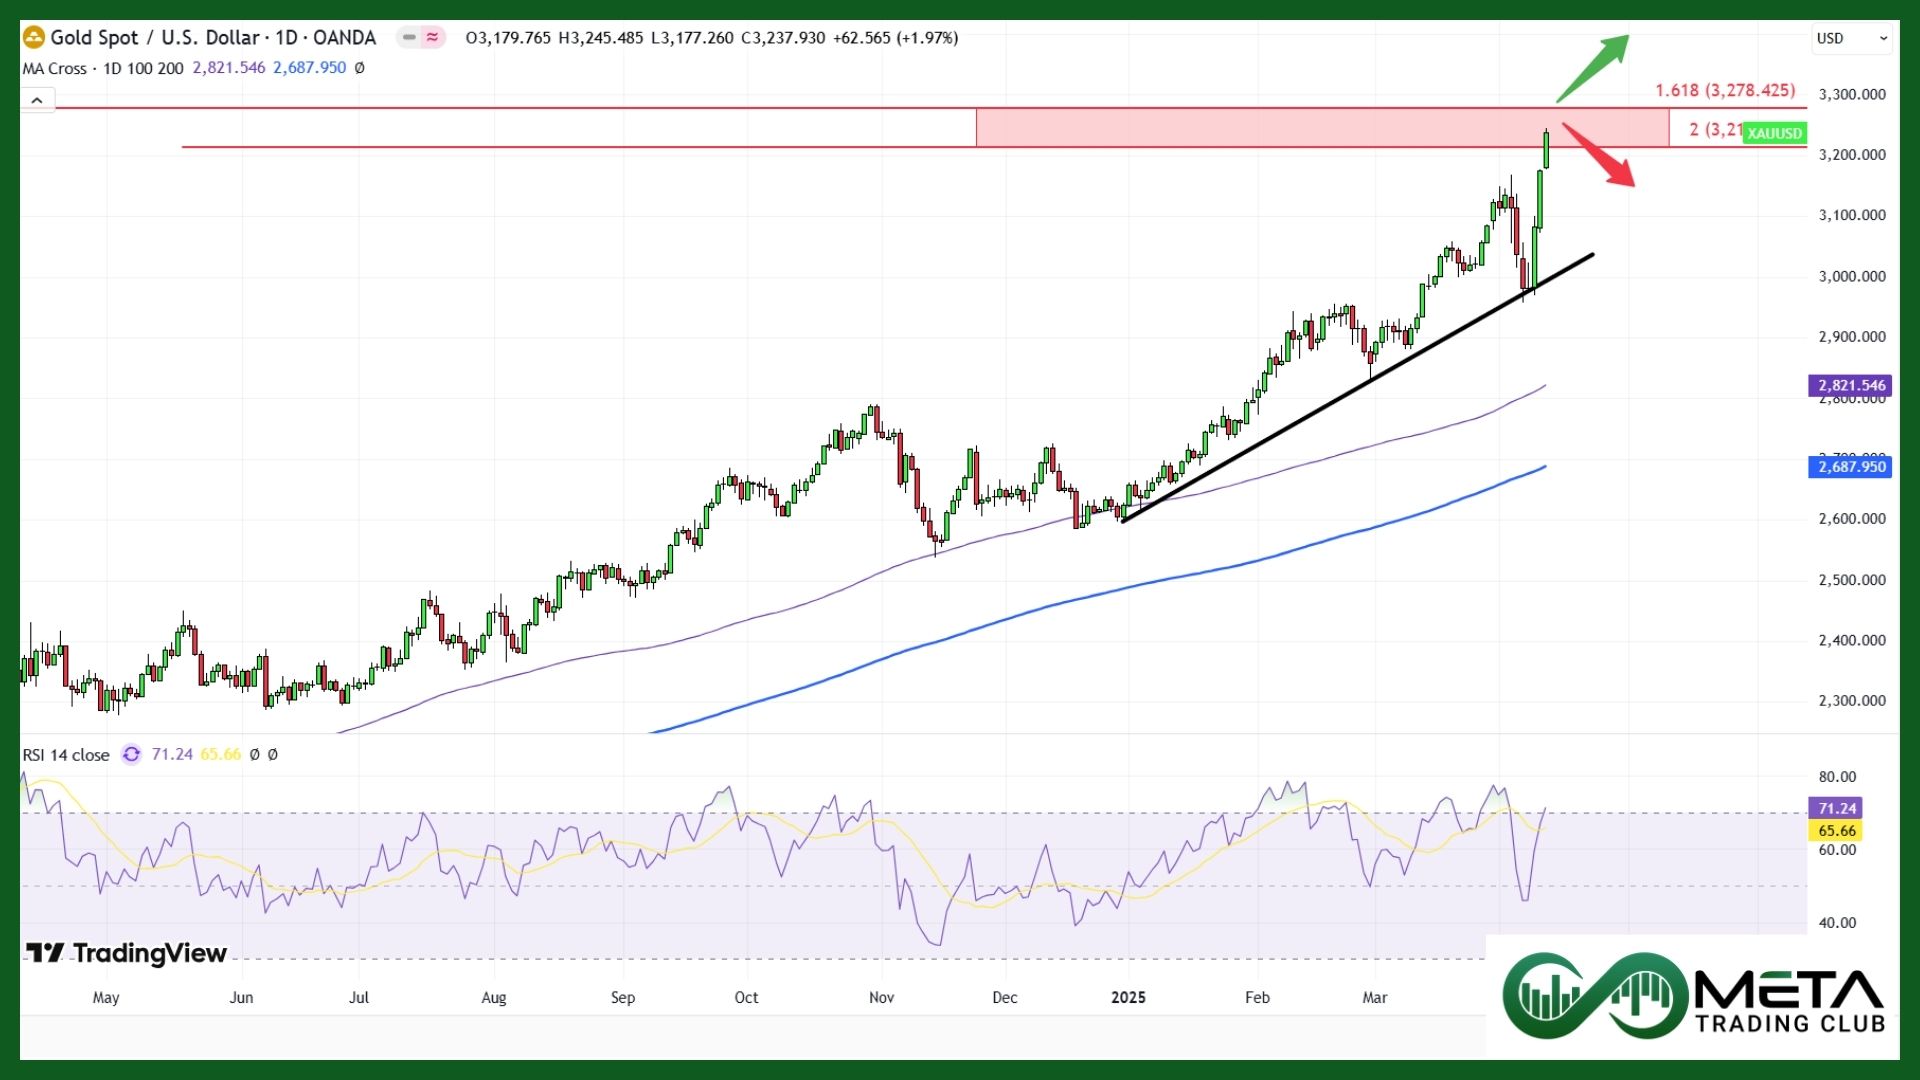
Gold (XAUUSD) prices soared to a record high of $3,250 per ounce, rising over 6% last week. This surge was driven by escalating US-China trade tensions and growing economic uncertainty, prompting traders to seek safety in gold. The weakening US dollar, which hit a two-year low, further fueled the rally.
Meanwhile, Swiss bank UBS remains optimistic about gold, predicting prices could climb to $3,400–$3,500 per ounce in the coming months.
Technically, gold has achieved a new record high, reaching a Fibonacci cluster zone resistance between 3200 and 3280. Since the metal appears overbought across various timeframes, it may react to this level with a potential decline. However, if gold breaks through this zone with strong momentum, it could climb to even higher prices.
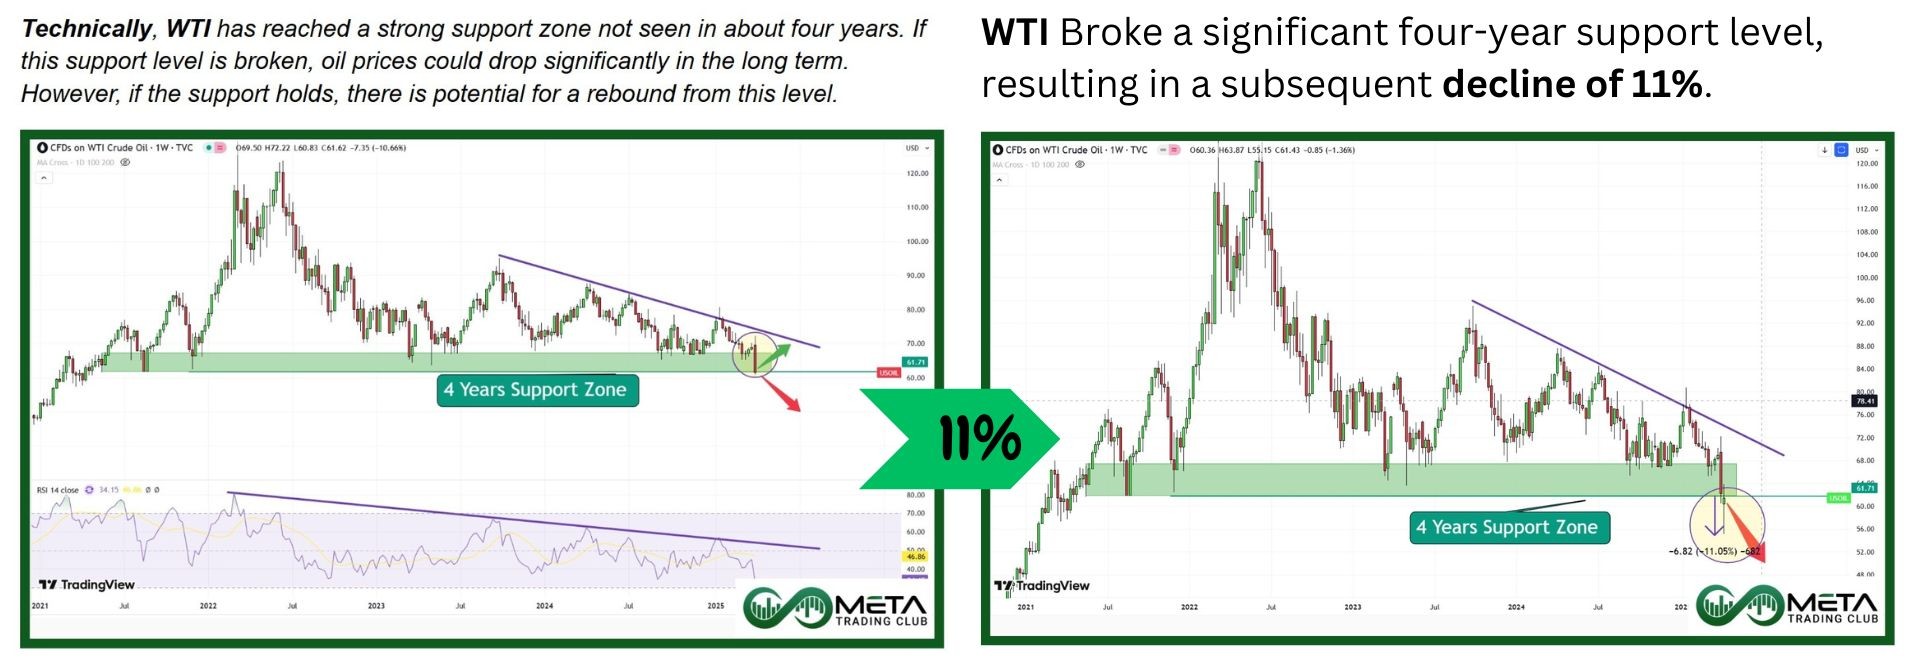
Crude oil futures experienced volatile movement last week, falling 10% before rebounding as the U.S. signaled potential action to block Iran’s oil exports. However, the ongoing US-China trade dispute, marked by sharp tariff increases, continued to weigh on demand expectations.
The U.S. Energy Information Administration lowered its global oil demand forecast, citing concerns over prolonged trade tensions. Additionally, OPEC+ raised fears of oversupply by accelerating output plans.
With both supply and demand risks at play, WTI crude slipped 0.76% for the week, following a larger decline of 10.6% in the previous period, hitting its lowest level since April 2021.
Forex
Weekly Performance of Major Foreign Exchange Pairs:
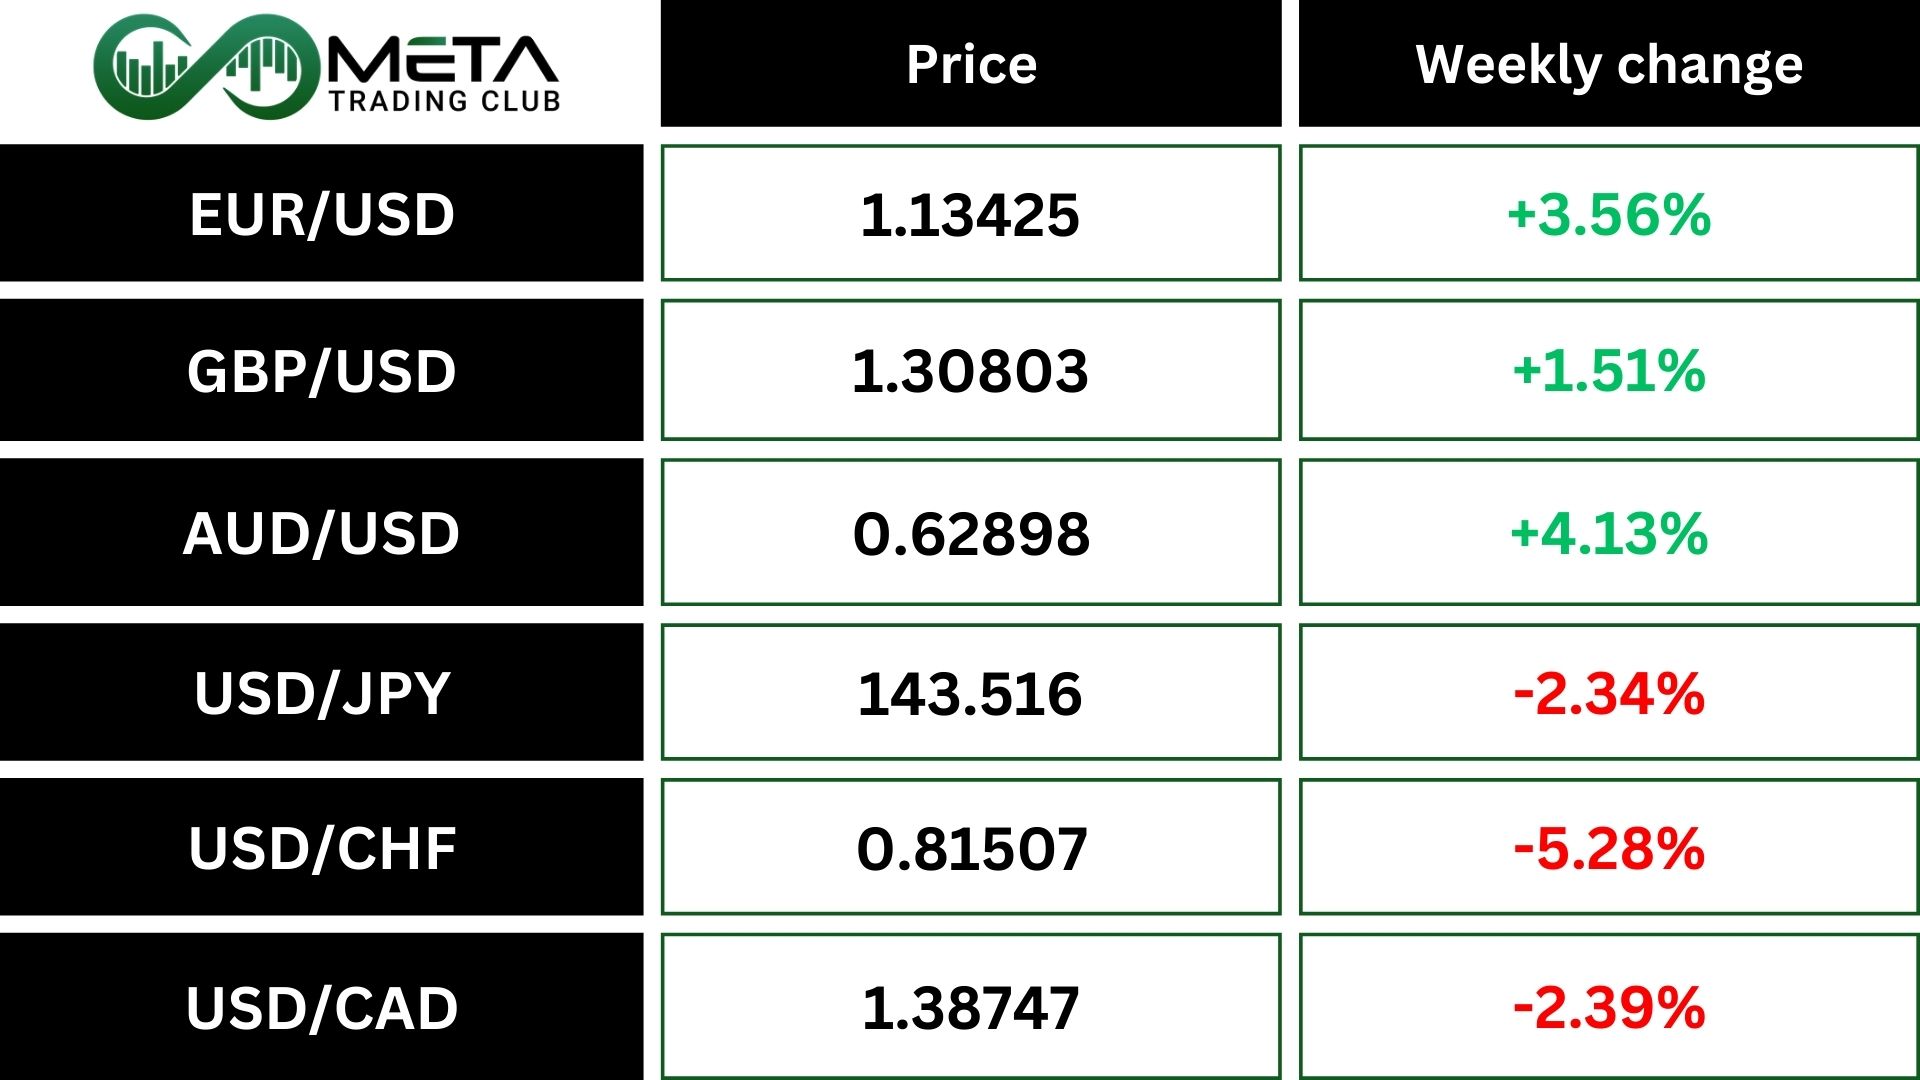
The EUR/USD pair reached a three-year high, climbing 3.5%, as traders favored the euro over the weakening US dollar due to uncertain growth prospects. The ongoing US-China trade tensions and inconsistent tariff policies further eroded confidence in the dollar.
The US dollar index fell to a two-year low of 99.70, affected by disappointing inflation data. March consumer prices rose only 2.4%, falling short of the expected 2.8%, raising concerns that the Federal Reserve might lean towards cutting interest rates sooner than anticipated.
Crypto
Crypto Market Weekly Performance:

Source: QuantifyCrypto
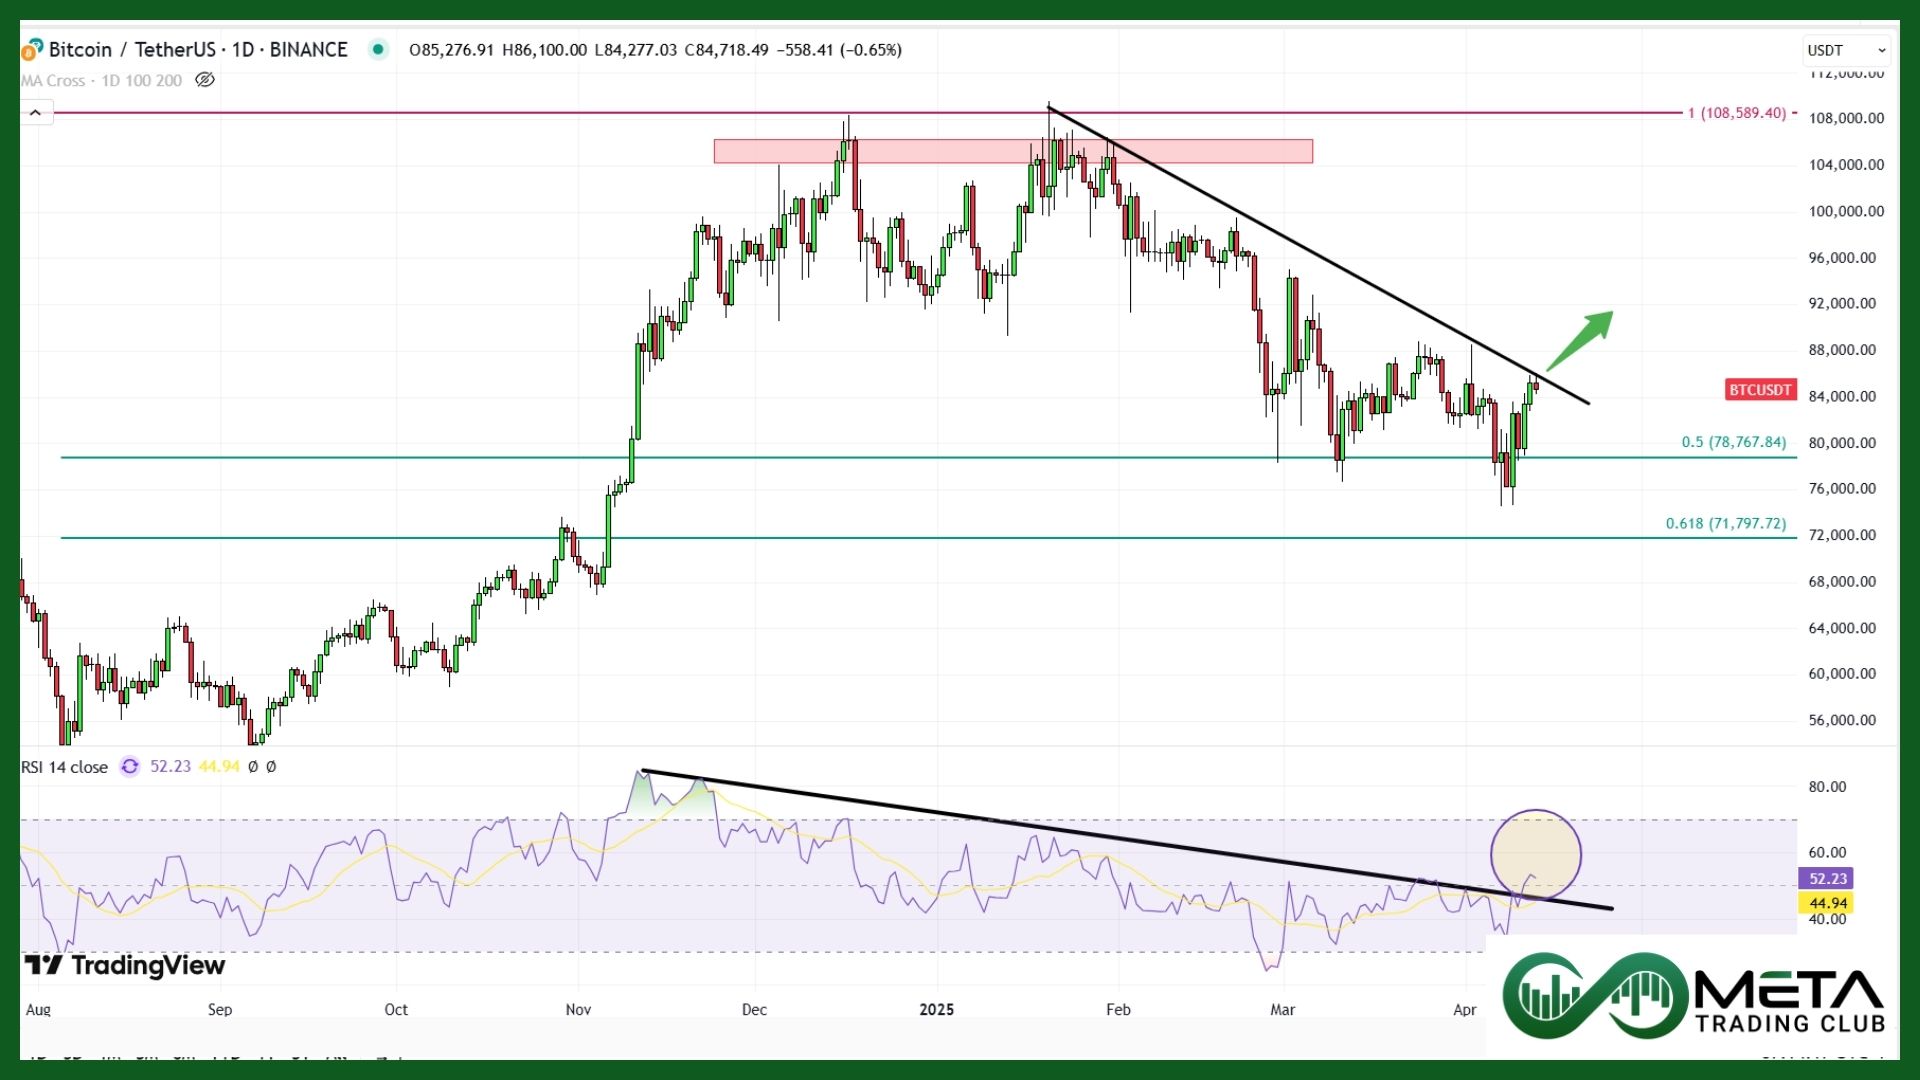
Bitcoin (BTCUSD) made slight gains for the week after hitting five-month lows earlier. The rally followed news of US President Trump excluding key products from trade tariffs on China. However, weekend trading brought lower liquidity, leading to increased volatility and Bitcoin dipping under $84,000 before the weekly close.
Bitcoin’s ongoing movement around the 200-day exponential moving average (EMA) at $85,000 suggests more volatility ahead, fueled by upcoming news on tariffs.
Technically, BTC has approached its downtrend line. If its upward momentum persists and the coin manages to break through this downtrend line, it could experience further growth. On the other hand, a rejection at this level might push BTC down toward lower support levels.
Next Week’s Outlook
Economic Events
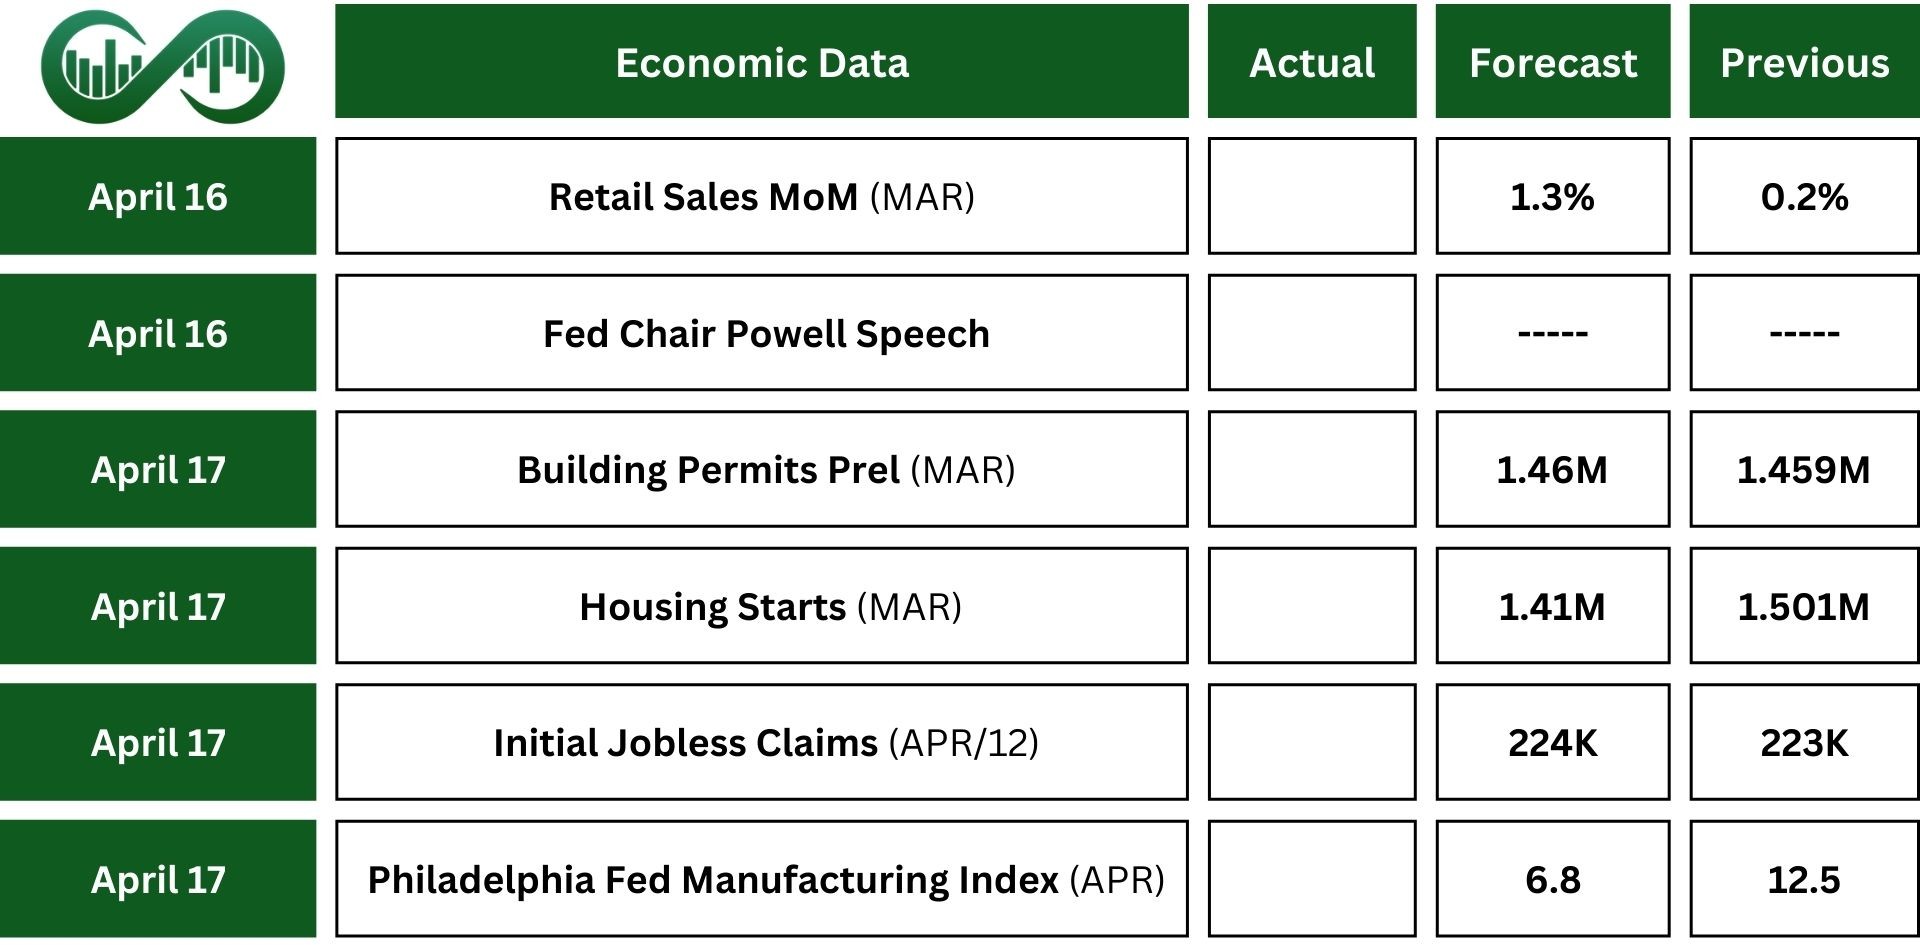
Markets will pay close attention to remarks from Fed officials, including Chair Jerome Powell’s speech at the Economic Club of Chicago, as they look for clues about the Fed’s plans for the rest of the year.
On the economic front, March retail sales are expected to rise 1.3%, marking the biggest gain since January 2023, while industrial production is forecasted to drop 0.3%, ending a three-month growth streak.
Housing starts are likely to slow to 1.41 million units after February’s spike.
Other key data releases include import/export prices, business inventories, the NAHB Housing Index, and surveys from the New York Empire State and Philadelphia Fed.
Meanwhile, the Bank of Canada is expected to hold interest rates steady, following 225 basis points in cuts since June 2024.
In Europe, attention is focused on the European Central Bank‘s April 17th meeting, where another interest rate cut (the seventh since June) is widely anticipated. This comes as President Trump’s tariff policies fuel concerns about a potential eurozone recession.
Earnings Events
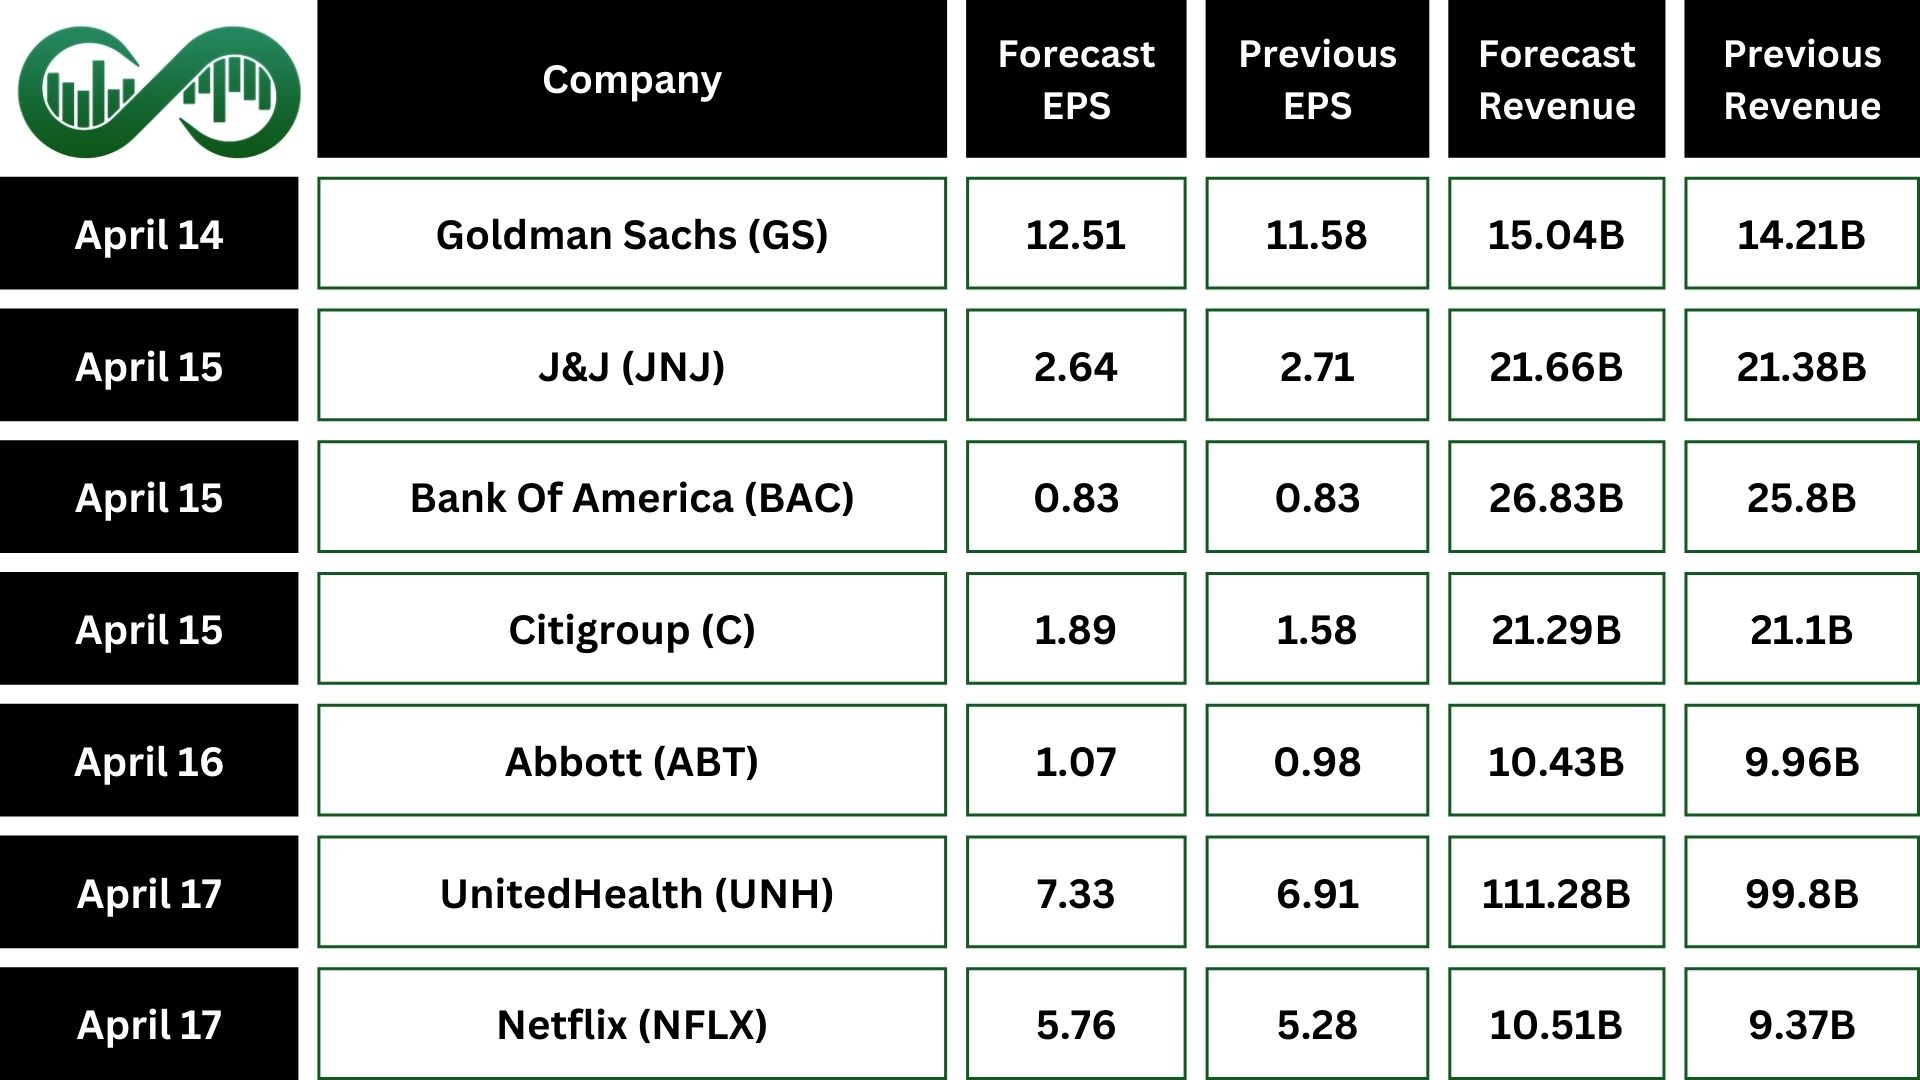
In the US, markets will have a shorter trading week because of Good Friday, with stock and bond markets closed that day.
Investors will pay close attention as earnings season picks up, focusing on future guidance during uncertain economic times. Key reports will come from companies like Goldman Sachs (GS), Bank of America (BAC), Citigroup (C), Johnson & Johnson (JNJ), Abbott Laboratories (ABT), American Express (AXP), Blackstone (BX), UnitedHealth Group (UNH), and Netflix (NFLX).