
Economic Reports
The U.S. building Permit fell 3.8% in May and hit the lowest since June 2020. Building Permit for may in the United States reported 1.386 million, lower than previous value of 1.44 million for april. This decline is due to high interest rates and mortgage rates that reflect in the housing sector. Also, sales activity fell to the lowest level since January 2024, even as home prices hit a record high.
The Home Prices in the United States hit a record high. The national median existing-home price in May was $419,300, a record in data going back to 1999, the National Association of Realtors said Friday. Prices aren’t adjusted for inflation. Those high prices, paired with elevated mortgage rates, have limited the number of sales this spring (typically the busiest season for home buying).
The U.S. retail sales month over month rose 0.1% in May versus 0.2% retreat in April. However, sales of sporting goods, hobby, musical instruments and books recorded the biggest increase of 2.8%. Although this is an increase in retail sales, it’s not that much to deny signs of cooling consumer sentiment.
The S&P Global US Composite PMI rose to 54.6 in June, its highest level since April 2022, up from 54.5 in May. The service sector showed the most significant improvement with a PMI of 55.1, while manufacturing also contributed to the uptick with a PMI of 51.7, although its growth slowed slightly. In addition, PMI data compiled by the S&P showed that both manufacturing and services activity in the United States expanded by more than markets expected in June.
Meanwhile, former St. Louis Fed president James Bullard said Thursday that the cool inflation reading could pave the way for a rate cut in September. Also, nearly 65% of the market has positioned itself for a Fed cut by September, adding to a loose consensus that the central bank will deliver two rate cuts this year.
Equity
U.S. equity indexes ended the last week higher as relatively soft economic data kept the Federal Reserve hawks at buy and gains in heavyweight technology.
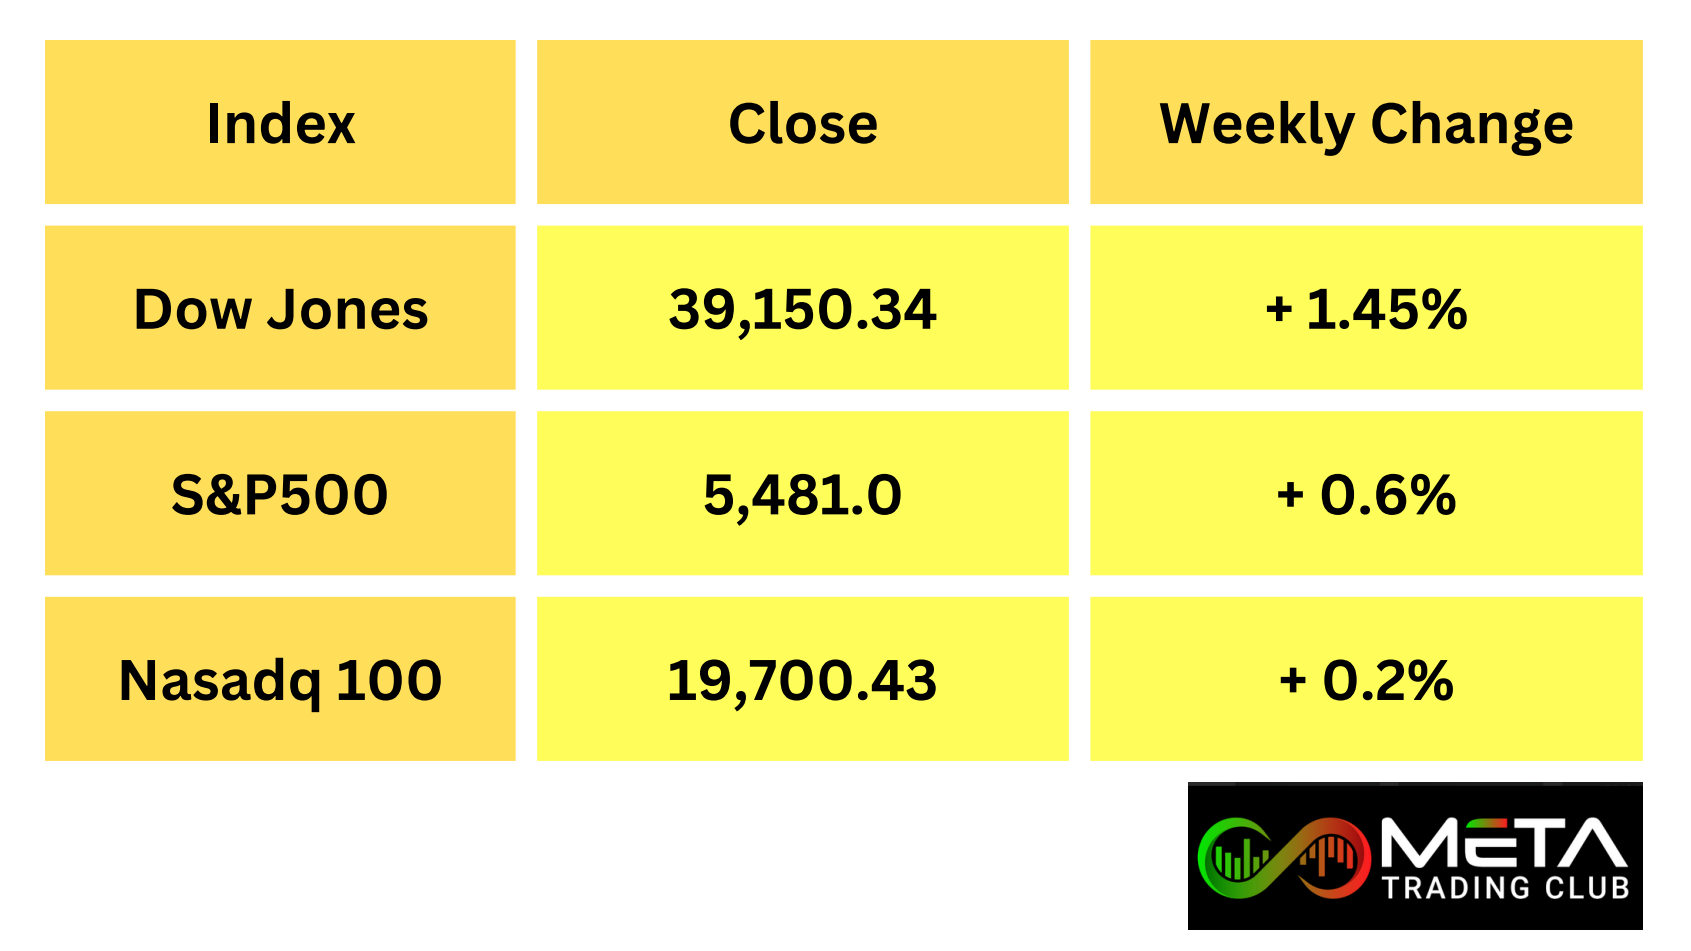
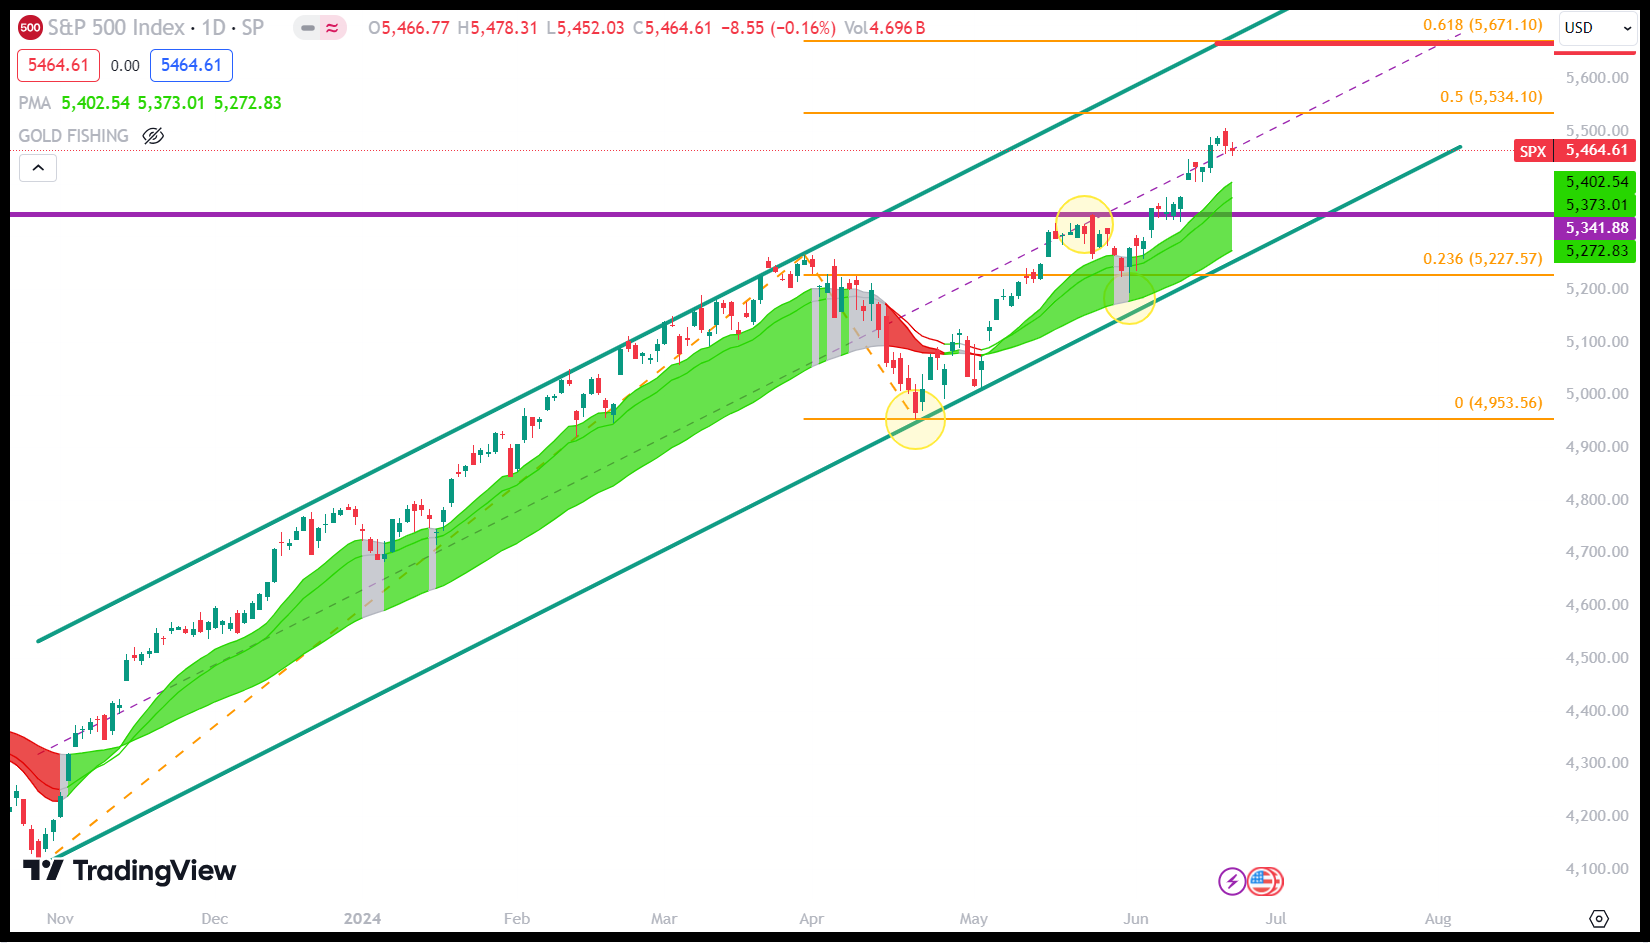
The S&P 500 index pumped above 5,500 points for the first time ever on Thursday, a day after traders took a break for Juneteenth. The chip giant Nvidia was driving the S&P 500 higher as its shares peaked at an intraday record of over $140 a share (after the 10-for-1 stock split.)
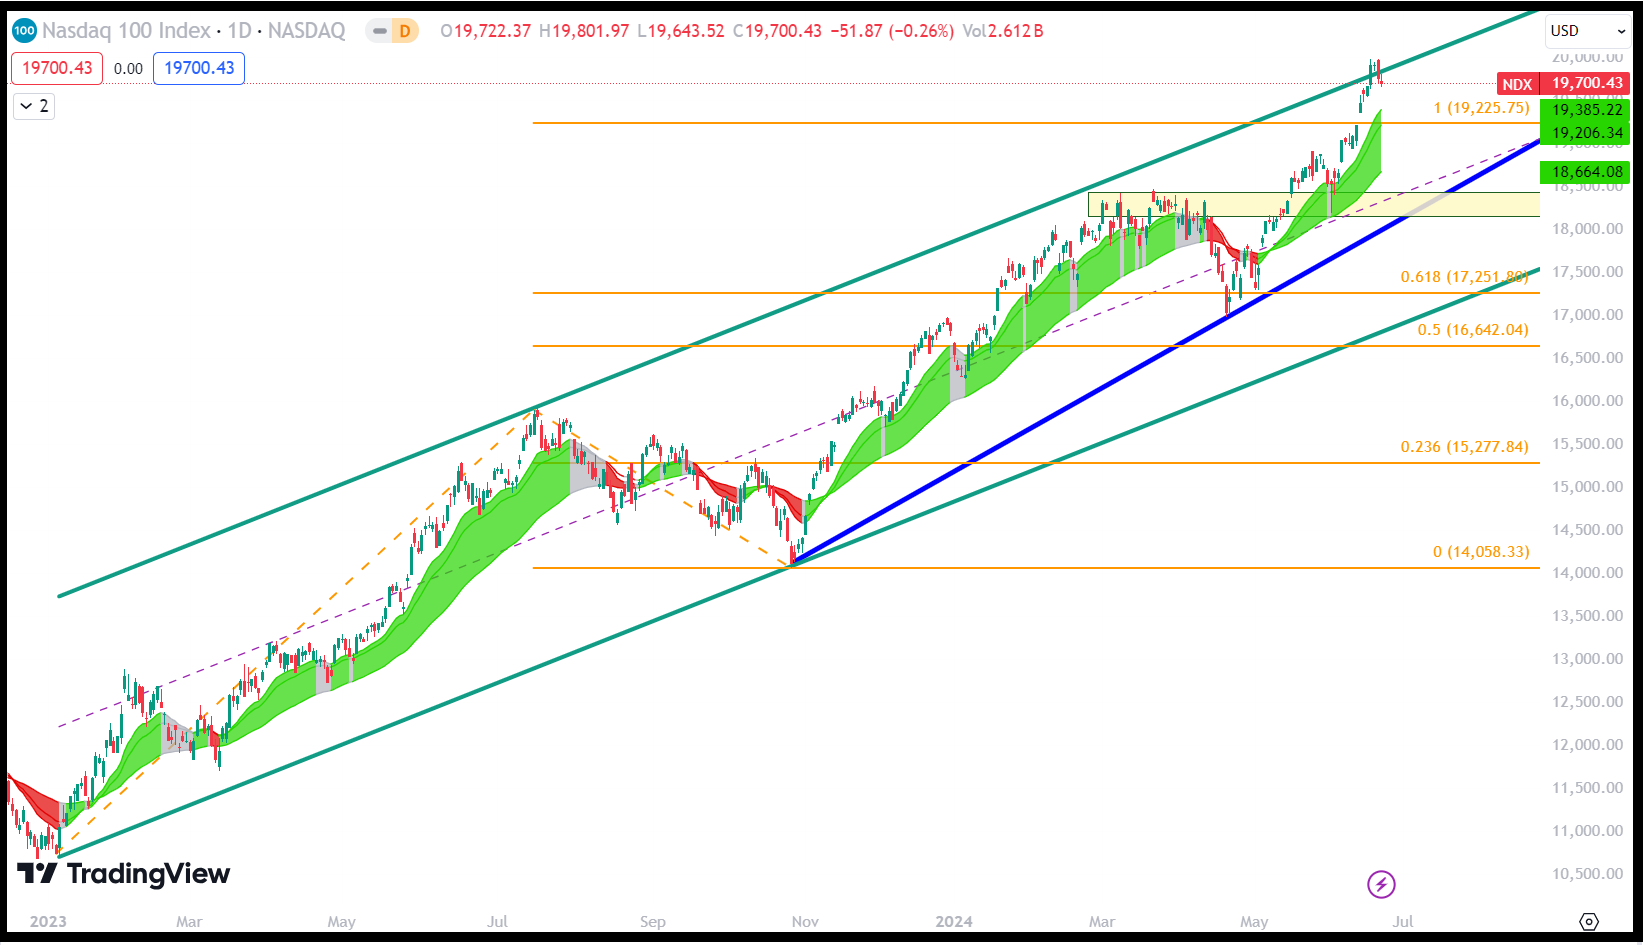
The Nasdaq index also rolled over into a loss a few hours before the session wrapped up. Technology shares ran out of breath with Nvidia clocking out at a 3.5% decline on the day. The Nasdaq’s loss snapped a monumental seven-day record-setting streak where each new day was a new record high.
Within technology Adobe (ADBE) was top gainer, up by more than 16%, but Nvidia (NVDA) and Apple (AAPL) ended the week lower. As a result, technology closed the week little changed.
Communication Services was the top performer among sectors last week, led by Netflix (NFLX) and Alphabet (GOOG). The financial group produced the second highest return, led by Well Fargo (WFC) and Mastercard (MA).
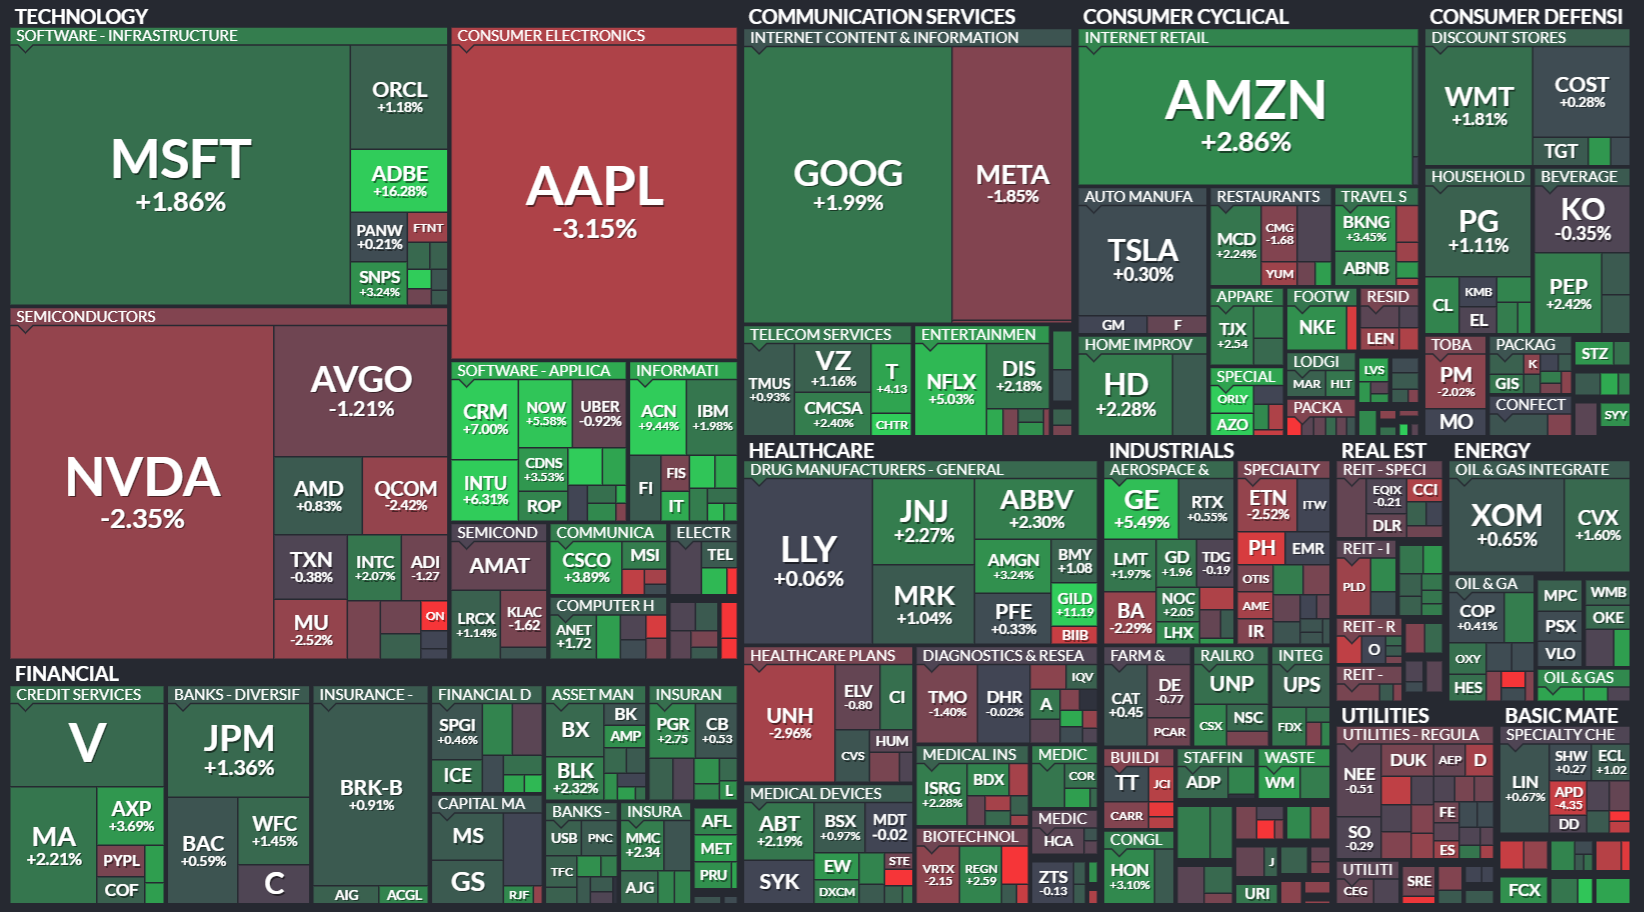
Heatmap Source: Finviz
Option traders piled into bullish bets on market cap growth stocks like Nvidia Corp. Furthermore, trading in bullish call contracts exceeded bearish puts by roughly 4.5 million contracts during the five days through Friday, according to data from Option Clearing Corp. Shared by Deutsche Bank in Friday research note.
Bonds
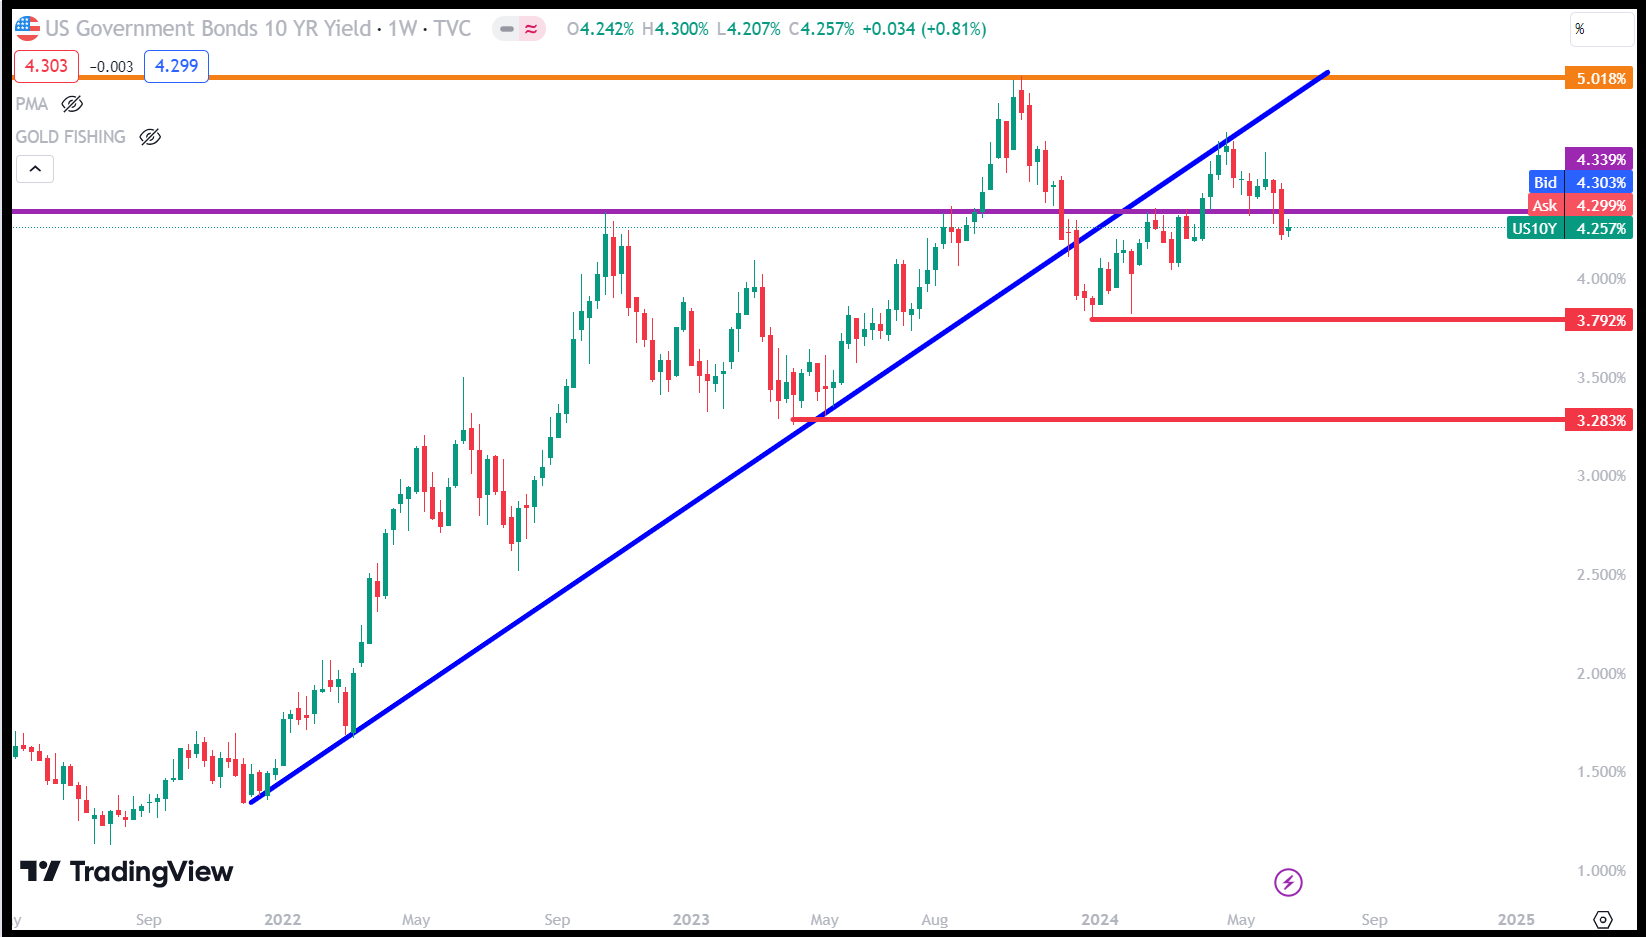
The yield on the US 10-year Treasury note pared its early decline to hover above the 4.25% mark on Friday, extending its rebound from the over-two-month-low of 4.21% touched on June 18th after strong economic data limited the need for the Fed to deliver a rate cut in the third quarter.
Since last Friday, the benchmark 10-year yield has risen 4.1 basis points, the first weekly gain in three, while the 2-year’s yield gained 4 basis points for the first weekly gain in a month.
Commodities
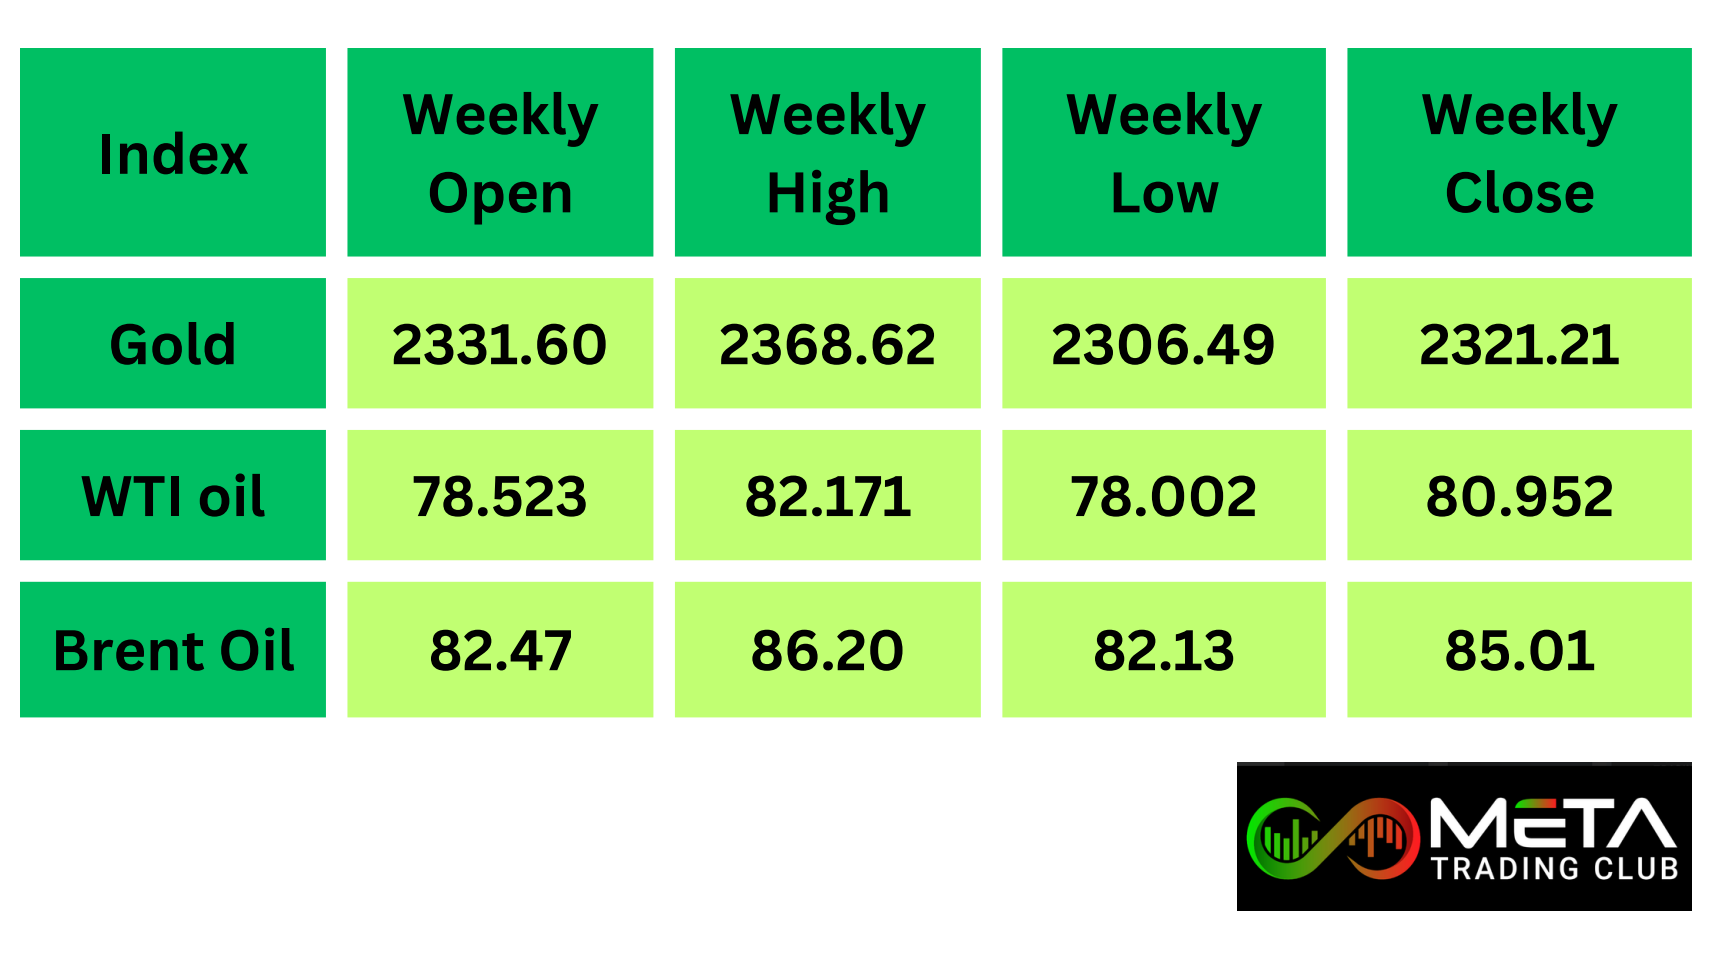
Major commodities like gold, WTI and brent crude oil changes over the past week:
Gold
Central Banks around the world expect the global reserve of gold to increase over the next year while pessimism toward the U.S. dollar has grown, the World Gold Council’s report said. Nearly 30% of the banks plan to add their own reserves within the next year, including 13% of banks with advanced economies.
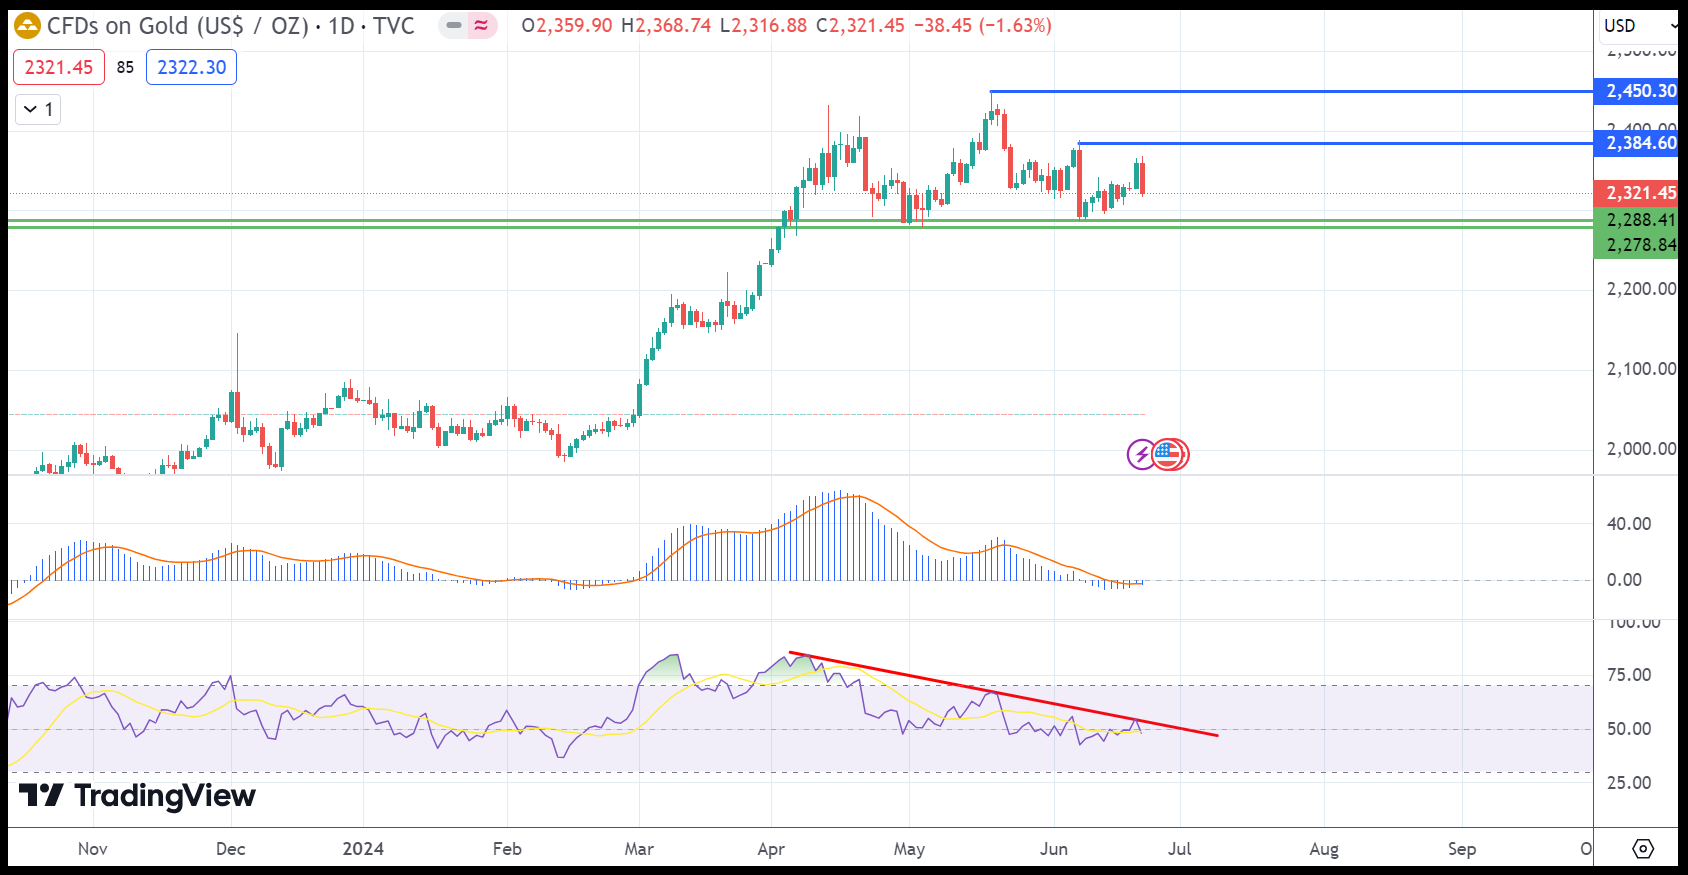
Markets are optimistic that the Federal Reserve will start to loosen its tight monetary policy around September. And that should happen through interest rate cuts. Previously, markets had expected a total of three cuts this year. The figure has since dropped down to just one. Recent data, such as cooling inflation, has rekindled trader hopes of lower borrowing costs and that’s driving stocks to records. Lower interest rates mean that money will be cheaper. This, in turn, puts gold in an unfavorable position since it’s a safe-haven asset that traditionally acts as a hedge against inflation.
According to the latest IG retail trader data, 57.27% of traders are currently net-long on gold, with the ratio of traders long to short standing at 1.34 to 1. However, there has been a notable decrease in the number of net-long traders compared to the previous day and last week.
Crude Oil
Crude prices lifted for a second week on signs of improving demand; For the month so far, crude futures are well up, but the energy sector is still in the ground.
Citi is one of the most prominent bears among major banks, expecting oil to drop into the $70s range later this year. Citi predicts that oil prices will plummet to the $60s range by 2025 as inventories build following a tight market this summer, signaling a bearish outlook despite current robust demand and higher prices.
Early on Friday, the international benchmark, Brent Crude, traded above $85 per barrel, while the U.S. benchmark, WTI Crude, was above $82 a barrel, as signs of tightening physical markets started to emerge.
Forex
Foreign exchange currencies gained over the past week:
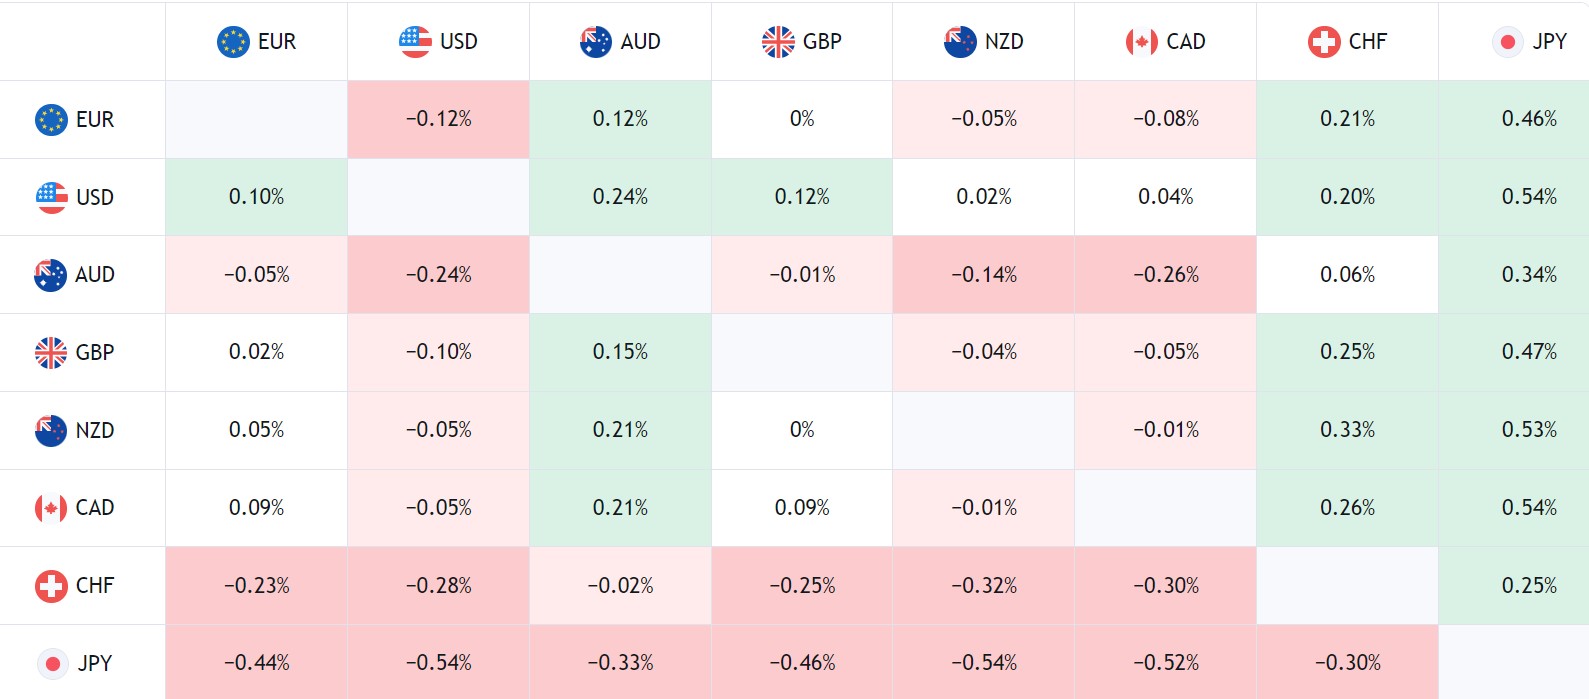
Heatmap Source: Tradingview
USD/CHF
The Swiss National Bank (SNB) voted to lower interest rates by 25 basis points to set the policy rate at 1.25%. Also, Swiss inflation remains comfortably beneath the 2% target, remaining at 1.4% for a second month in a row as other countries like the US and the EU are yet to achieve the feat.
Early signs of an economic recovery in Switzerland have been building, suggesting that rates are not too restrictive to hamper growth. In addition, wages in Switzerland had shown resilience, holding at 1.8% for three quarters in a row. These developments provided some uncertainty around the decision with many of the view the Bank might have held rates steady.
GBP/USD
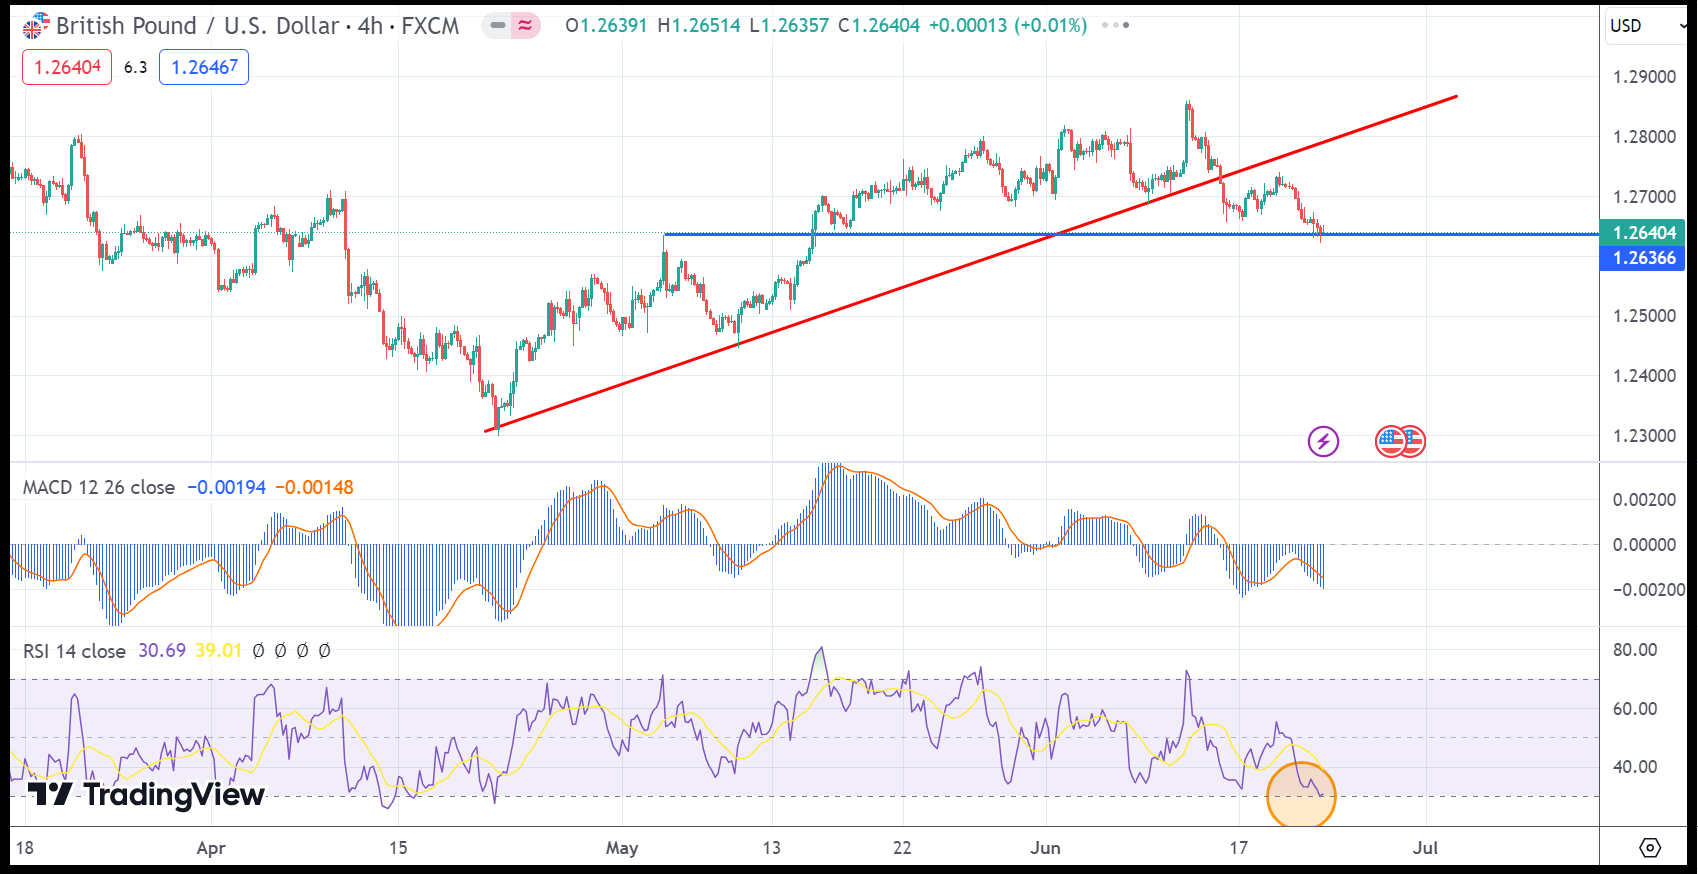
UK private sector business activity expanded in June at its slowest rate since last November, according to the latest S&P Global Flash UK PMI report.
UK government bond yields continue to slip lower, fuelled by yesterday’s dovish nudge by the Bank of England. Financial markets are now pricing in a 50/50 chance of a 25 basis point rate cut at the August BoE monetary policy meeting and a total of just under 50 basis points of cuts this year.
Lower government bond yields and ongoing uncertainty ahead of the July 4th UK general election is weighing on the British Pound and this pressure is unlikely to ease soon. The 4H GBP/USD chart does show the pair in oversold territory, and this may slow down any further sell-off in the coming days.
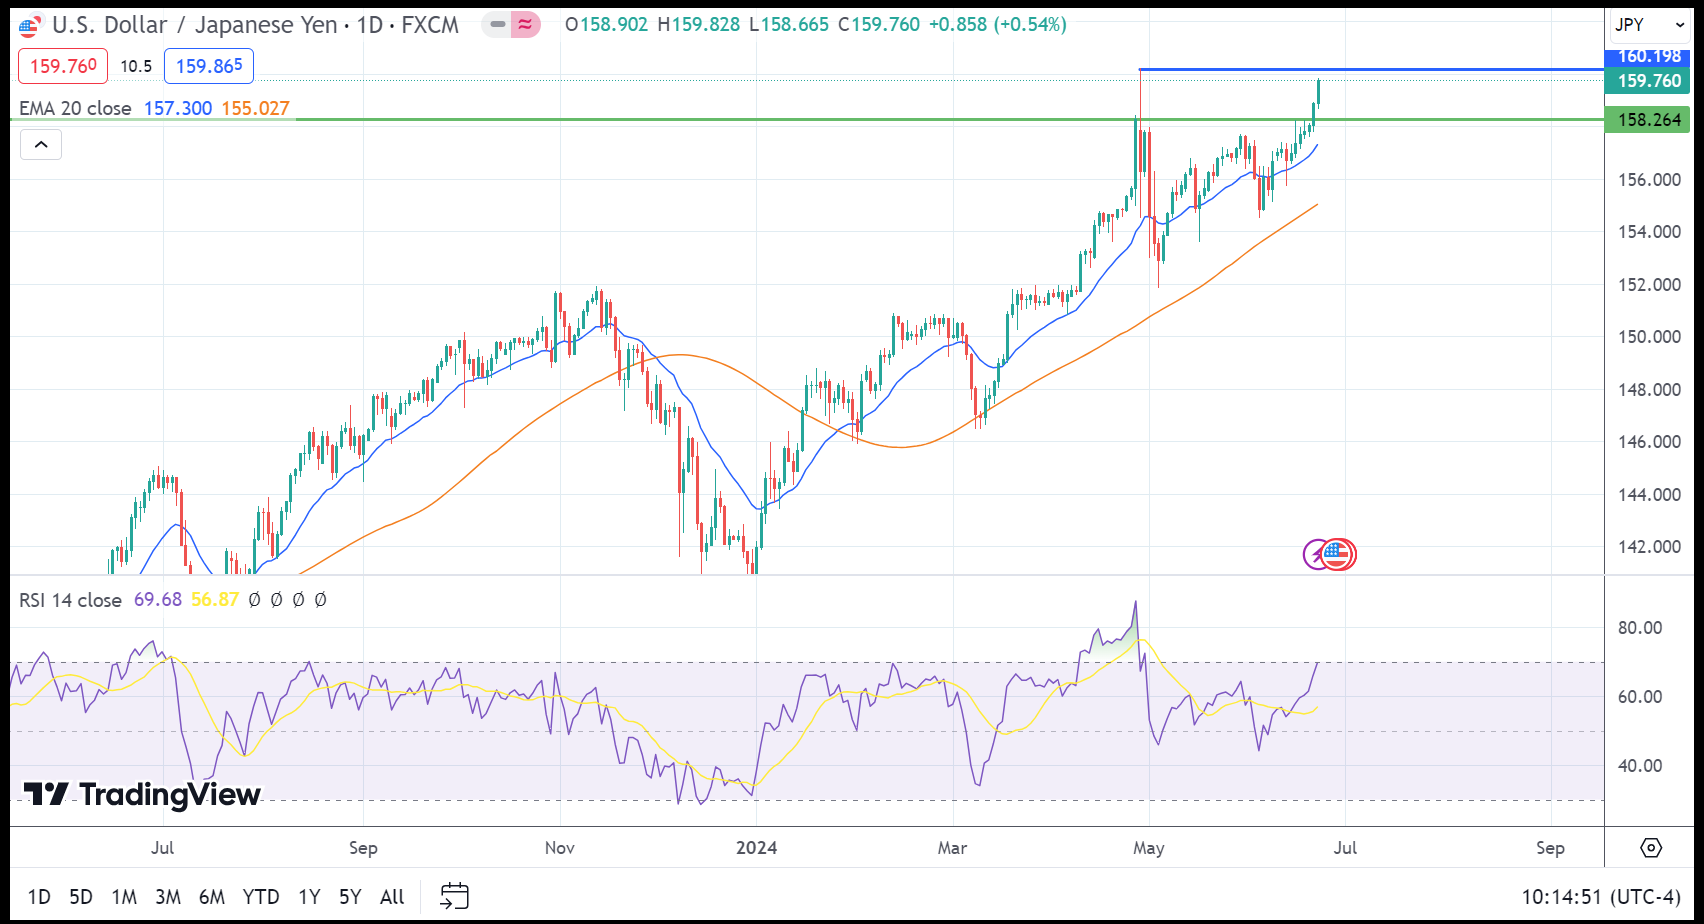
USD/JPY
12-month Japanese CPI for May came in above the prior 2.5%, at 2.8% while core CPI (CPI excluding fresh food) narrowly missed expectations of 2.6% to print at 2.5%.
The Bank of Japan (BoJ) still requires convincing to hike rates again this year after calling for a virtuous relationship between inflation and wages. Demand-driven inflation as opposed to supply-led price pressures is also a key differentiator when it comes to BoJ thinking around inflation. The drop in ‘core core’ suggests non-volatile measures of inflation are losing momentum at a time when the local economy appears to be contracting (Q1 GDP measured -0.5% on a quarter-on-quarter basis). Thus, the BoJ will require more data before gaining the necessary confidence to hike the interest rate again.
USD/JPY appears to be on a set course towards 160 as the yen continues to weaken. Bond yields have not exactly helped the yen but rising yields over the last two trading sessions now sees the 10-year Japanese government bond yield heading back towards 1%.
Crypto
Solana, a leading blockchain platform, is experiencing a significant downturn as a persistent bearish wave sweeps through its market. This decline, driven by a combination of factors, has led to SOL’s price suffering a huge drop below the $134.
Here is the past week’s daily heatmap of crypto currencies:
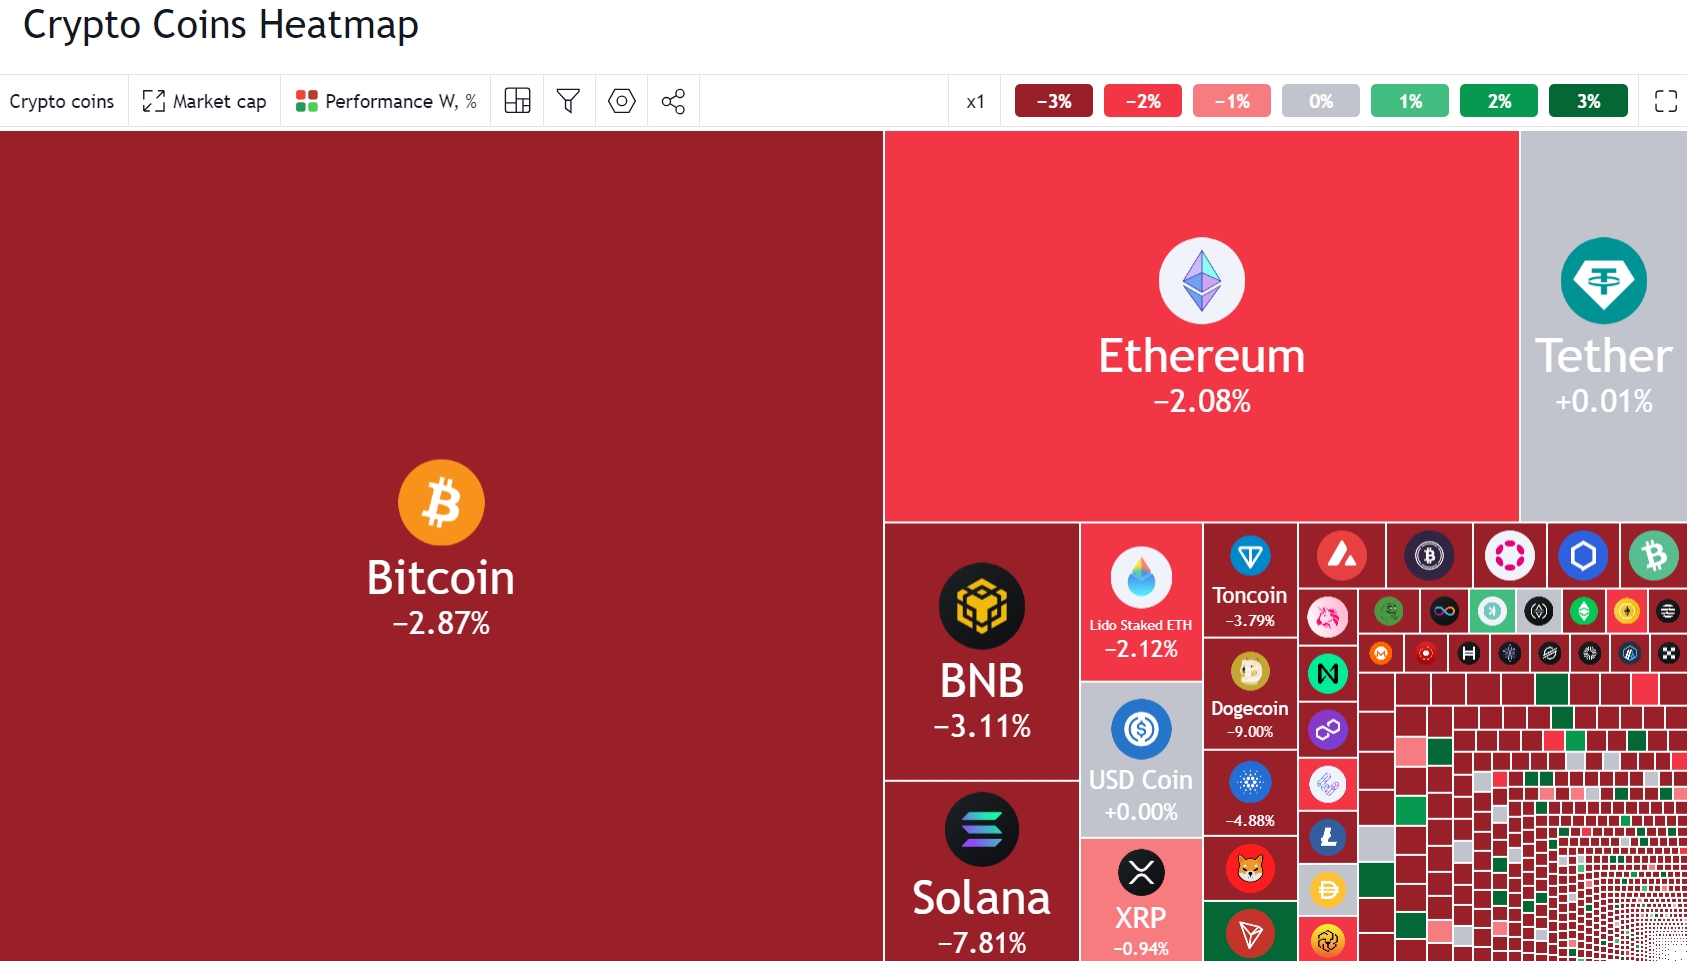
Heatmap Source: tradingview
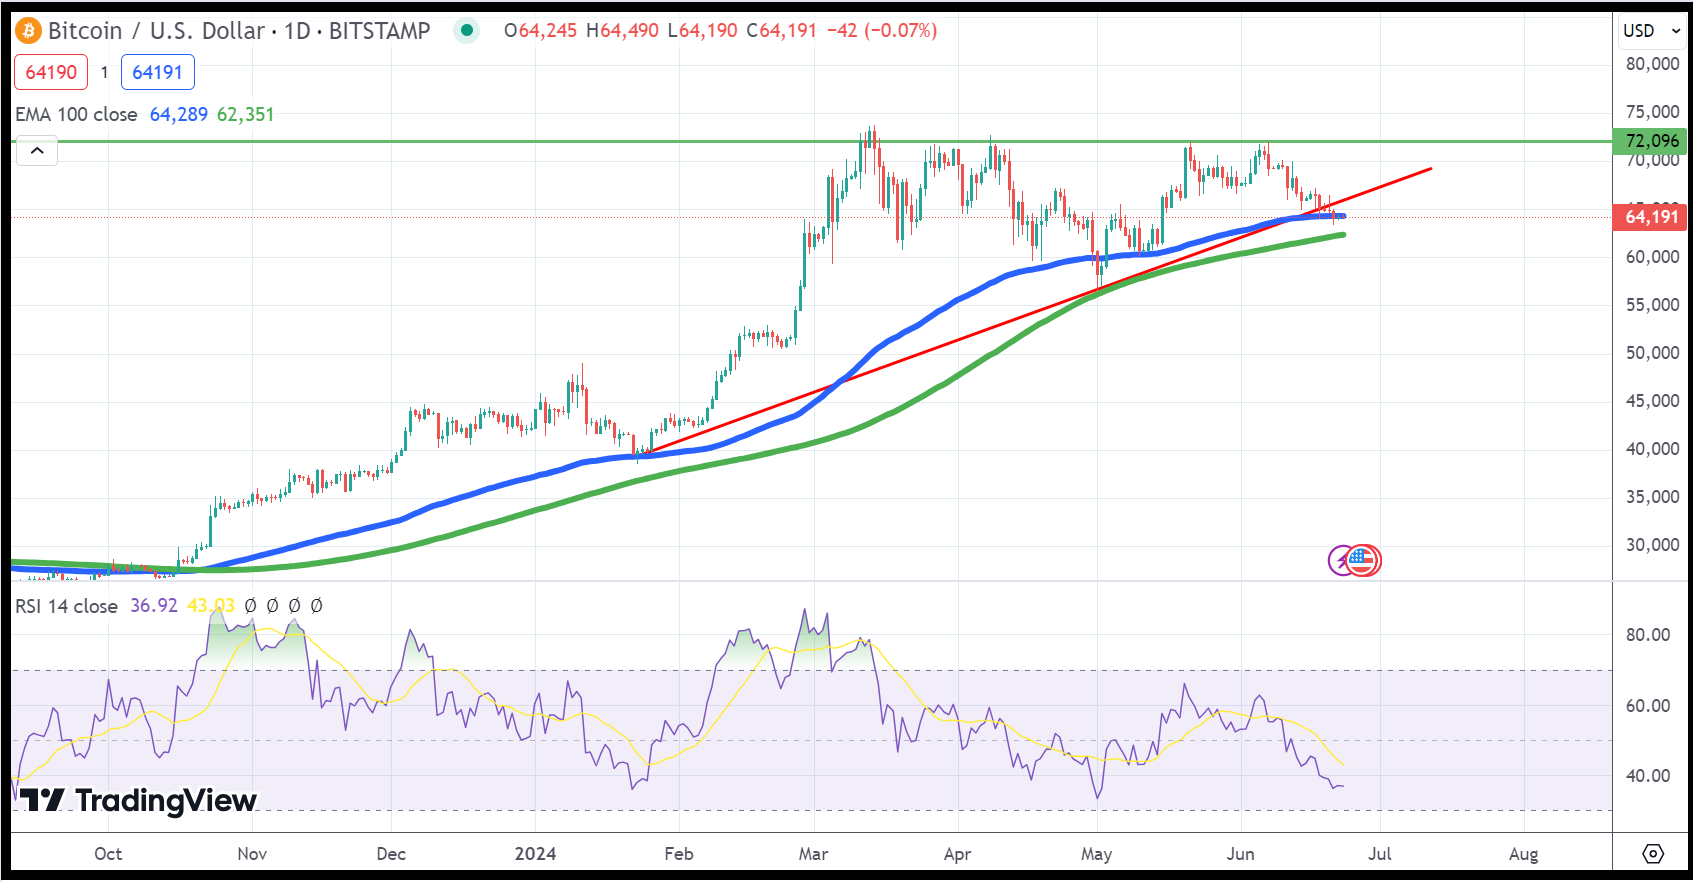
Bitcoin has been treading water for the last three weeks with little to suggest either a move higher or lower. The daily BTC/USD chart looks positive with all two exponential moving averages in a bullish set-up and supporting a move higher, with a short-term series of higher lows and higher highs since the start of May adding to positive momentum. A break and open above $70k should quickly see $72k tested, leaving the ATH at $73,778 vulnerable. With demand from a range of global spot Bitcoin ETFs outpacing post-halving new Bitcoin supply, the medium-to-longer outlook for Bitcoin looks constructive.