Economic Reports
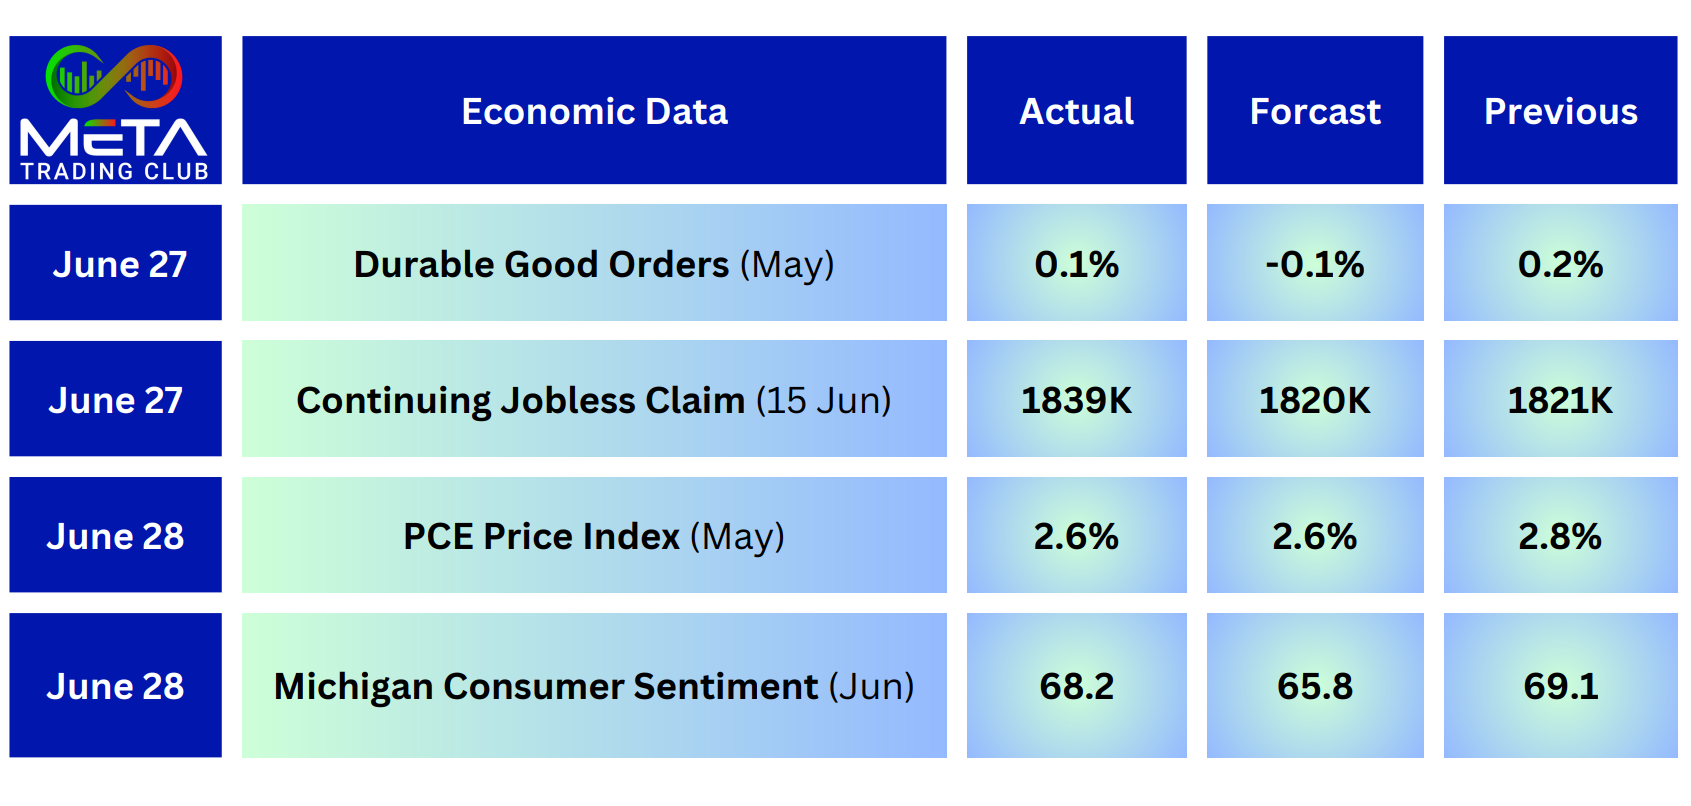
New orders for manufactured durable goods in the United States increased in April and better than market forecasts. The changes in these economic parameters are small, this shows the economy is slowing down.
The US core PCE price index (the Federal Reserve’s preferred gauge to measure underlying inflation) slowed. It is an indication that a September Fed rate cut is more likely.
Biden vs Trump Debate
The economy will likely be a hot-button topic during Thursday night’s debate between President Joe Biden and former President Donald Trump.
How the economy really fared under biden and trump:
Trump
- GDP growth was increase 2.5% each year before 2020 and though 2020 GDP decrease 2.2%
- Stocks performed better under Trump with stronger than average gains 14.1%. (unless a sharp decrease of 2020).
- Inflation was 5.4% during Trump’s first 41 months.
- Labor market feats were unemployment declining from 4.7% to as low as 3.5% in late 2019 and early 2020. (During pandemic unemployment had risen to 14.9%)
Biden
- Biden-led GDP growth at 5.8% in 2021, slowing to 2.5% in 2023.
- The S&P 500 index has posted an annualized gain of 10.8% (there hasn’t been the stock market crash).
- Inflation peaked at a four-decade high of 9% in 2022 before falling to just over 3%.
- Overall employment is up 11%, average pay is up 17% and unemployment is down from 6.7% to 4%.
Earning Report
Nike shares (NKE) slumped Friday, ending the day down 19.98%, the biggest one-day percentage drop in the stock’s history. The company on Thursday reported a surprise sales decline in its latest quarter. Nike has seen sales growth slow as it battles competition from Adidas.
Also, Nike plots a $100 sneaker line. It might work to a degree, but it does not remedy the wider problem of a lack of innovation.
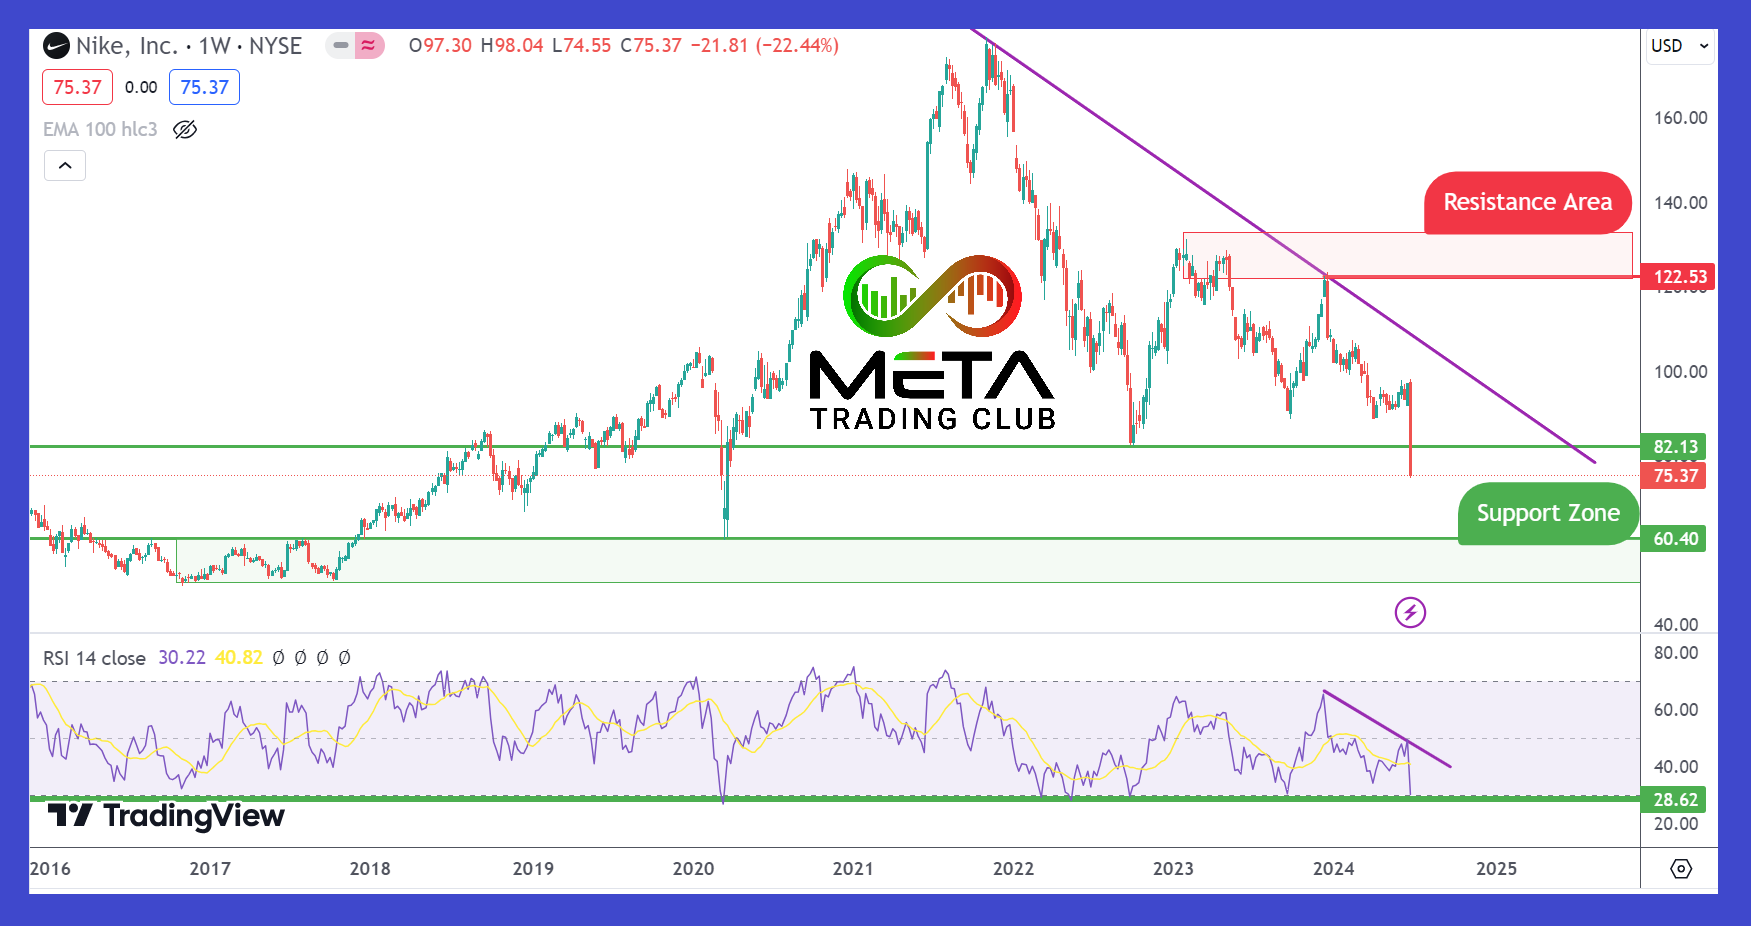
Nike shares are down 30.6% in 2024 so far, compared with the S&P 500 index’s SPX gain of 15%. As you see in the chart Nike stocks is bearish unless the price is below its trend line. There is a strong support zone around $60.
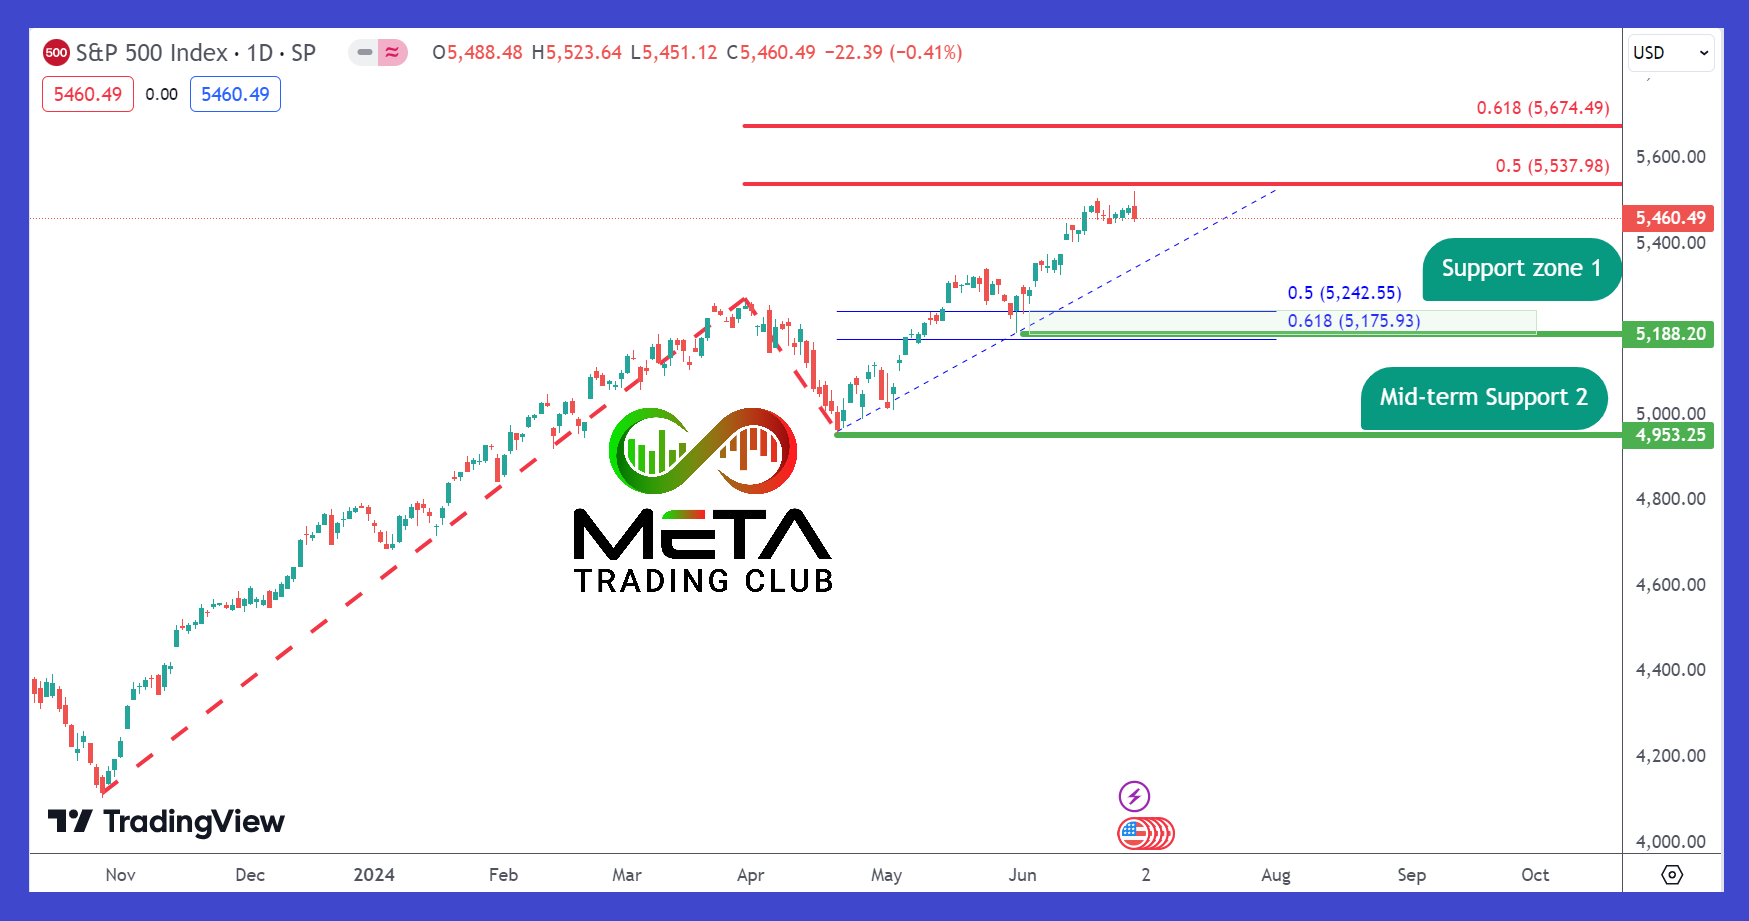
Indices
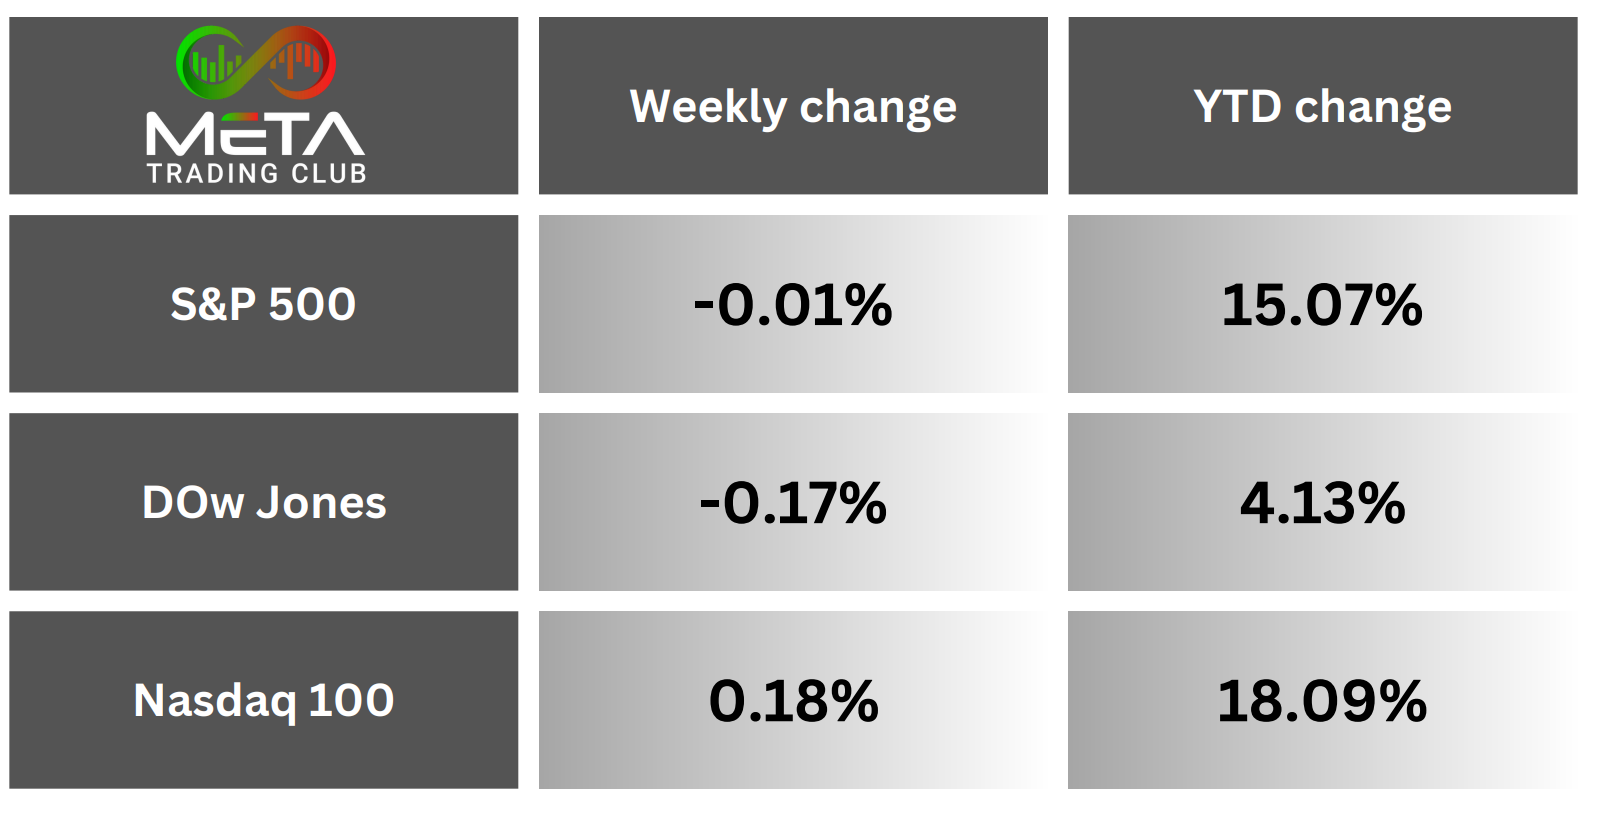
S&P 500 posted a strong first-half-year gain by 15% gain (one of the strongest election-year performance). Also, US equity indices closed lower Friday as markets assessed a report showing consumer spending rose less than expected in May.
If the S&P 500 drops on the back of negative economic developments, pay attention to the 5200-to-5300 range. However, the S&P500 has a bullish trend and there are Fibonacci projection resistance above his head at 5537 and 5674. As this index reached its 50% projection, there could be a correction up to 5242 but this could not happen before breaking short term bullish trendline.
At the top of the dot-com bubble in early 2000, the S&P 500 was outperforming the DJIA by even more than it is nowadays. The Dow over the past 6 months has lagged the S&P 500 by about 12 percentage points. The record for a 6-month spread occurred on March 8, 2000, when the S&P 500 was 13.7 percentage points ahead of the Dow. The Nasdaq Composite hit its internet-bubble high two days later. We all know what happened next. (Note that this is not a fact to trade, it’s just market history).
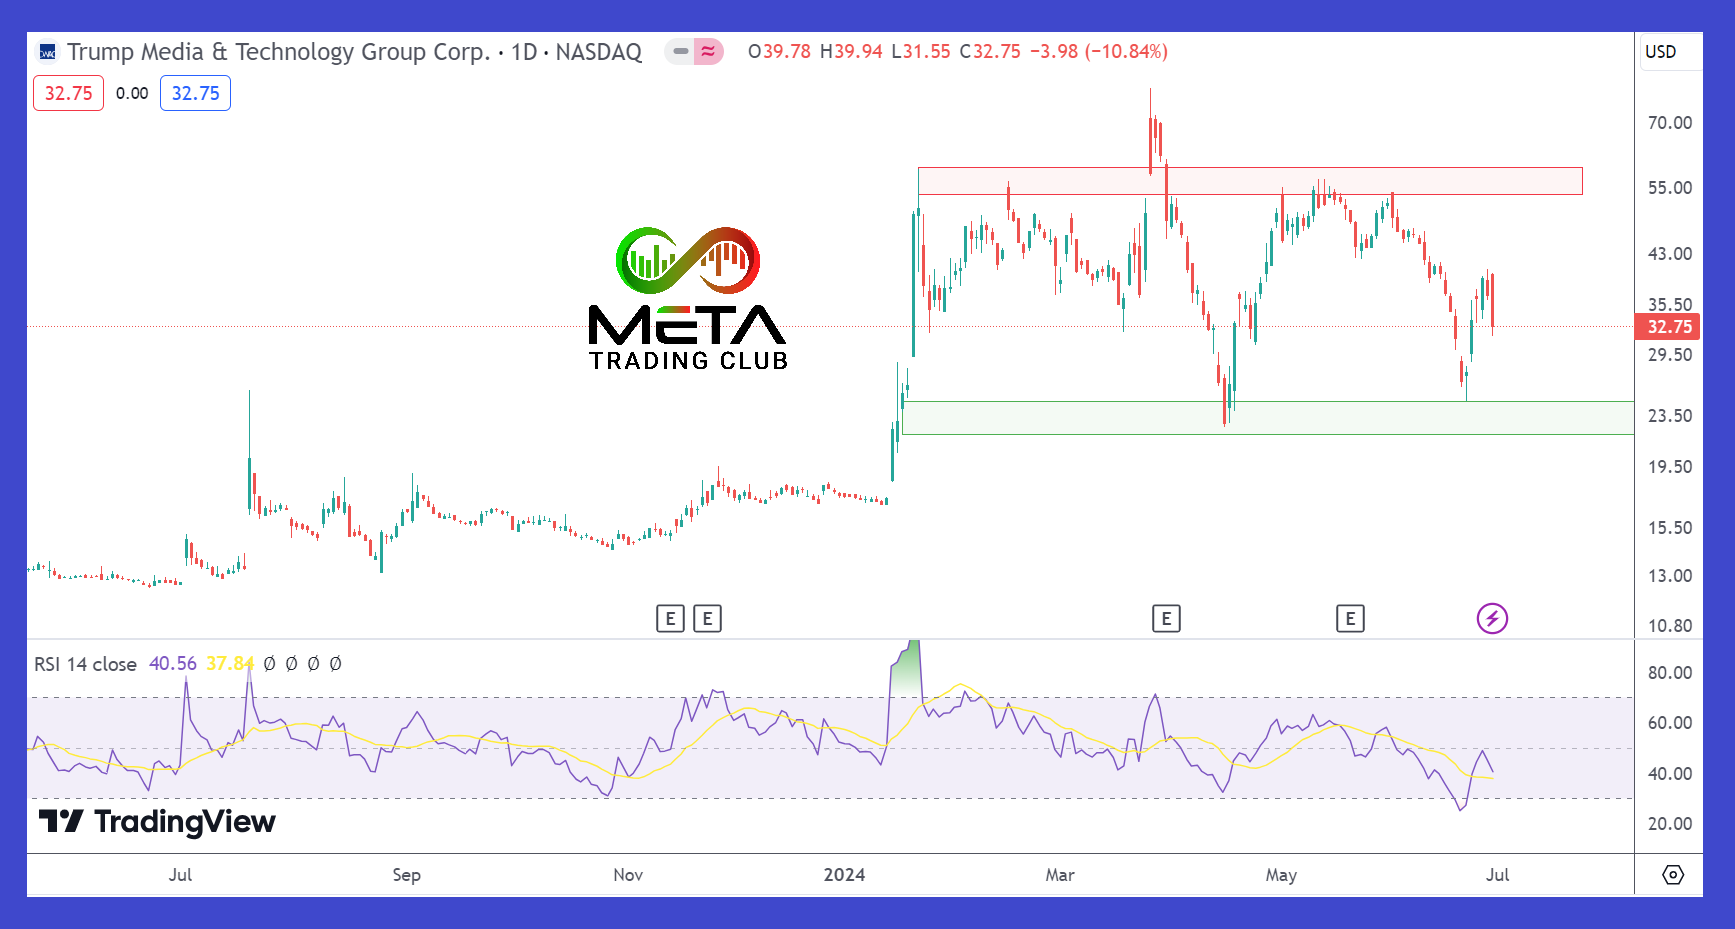
Stocks
Shares of Trump Media & Technology Group (DJT) went choppy on Friday (decrease 10%). The company itself loses money and is by some measures one of the most overvalued stocks among U.S. listings, with a price-to-revenue ratio in the thousands.
Fundamentally, there is nothing much behind the Trump Media & Technology Group. The moves that we see are mostly speculative. Also, you can see this fact in the chart.
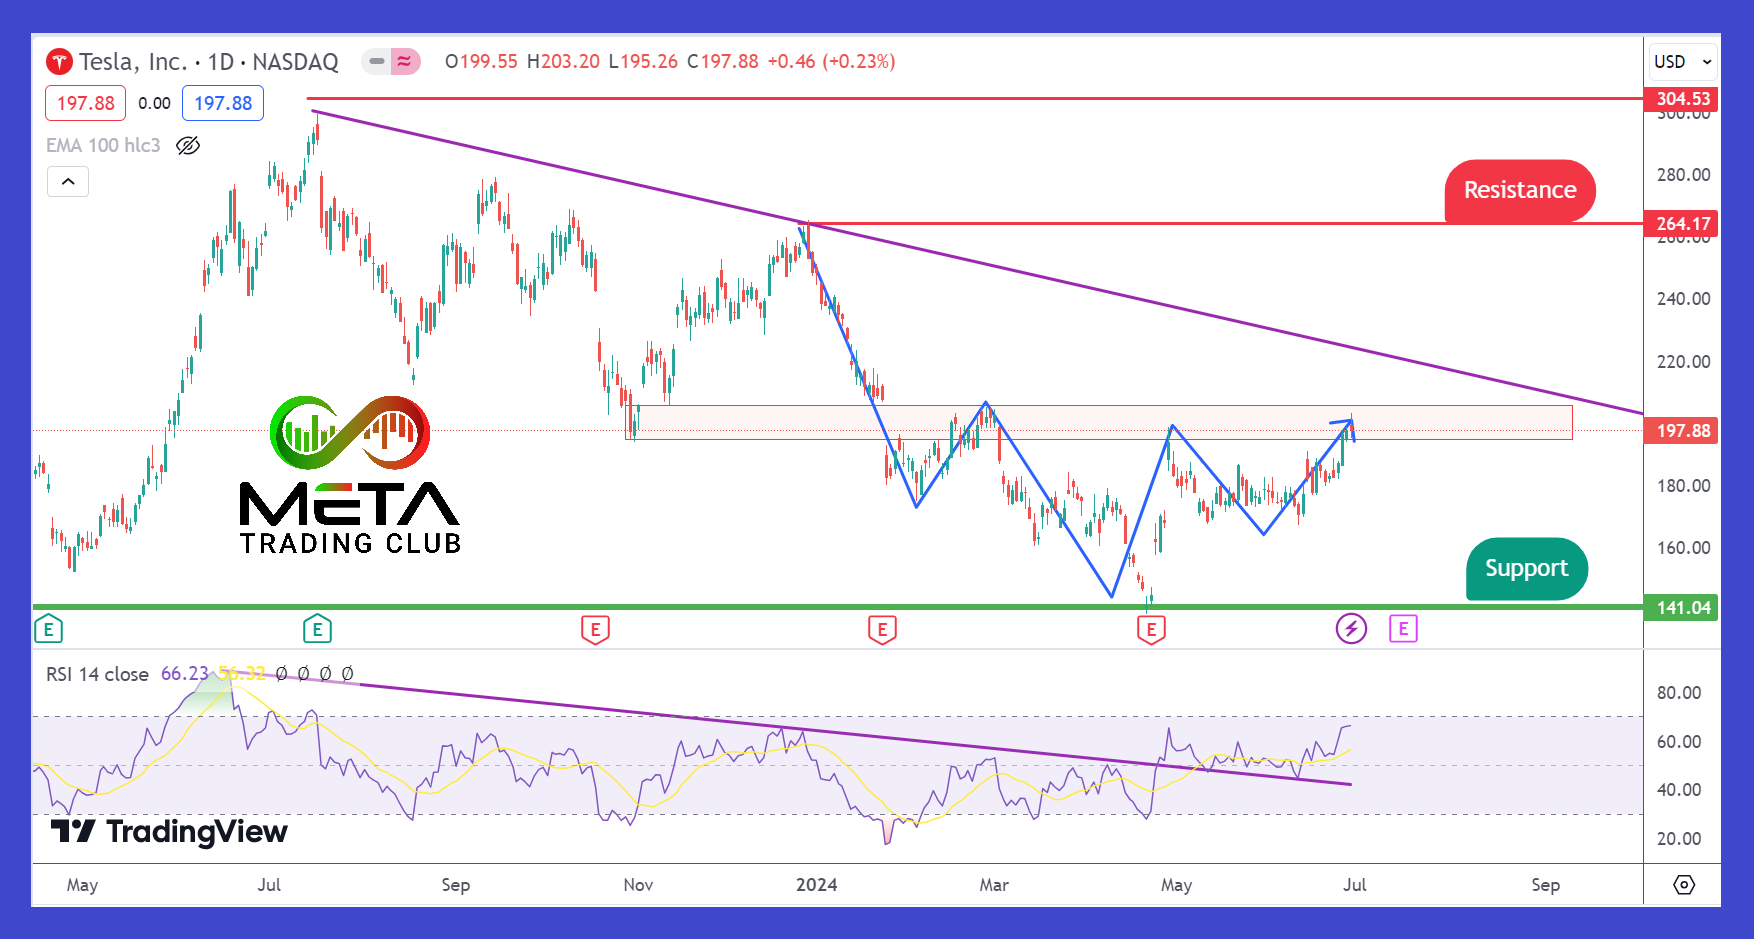
Tesla bulls believe that the EV company is on the run-up to a $1 trillion market cap from its present market cap of $629.61 billion. However, the stock is down 20.87% year-to-date after closing at $197.88 on Friday.
Tesla shares are on a bearish trend but there are signs of a reverse mid-term trend. Thus, if the price breaks the red area (195-206) then, Tesla can complete a reversal head and shoulder pattern.
Forex
Here are Forex currency-pairs previous week’s performance:
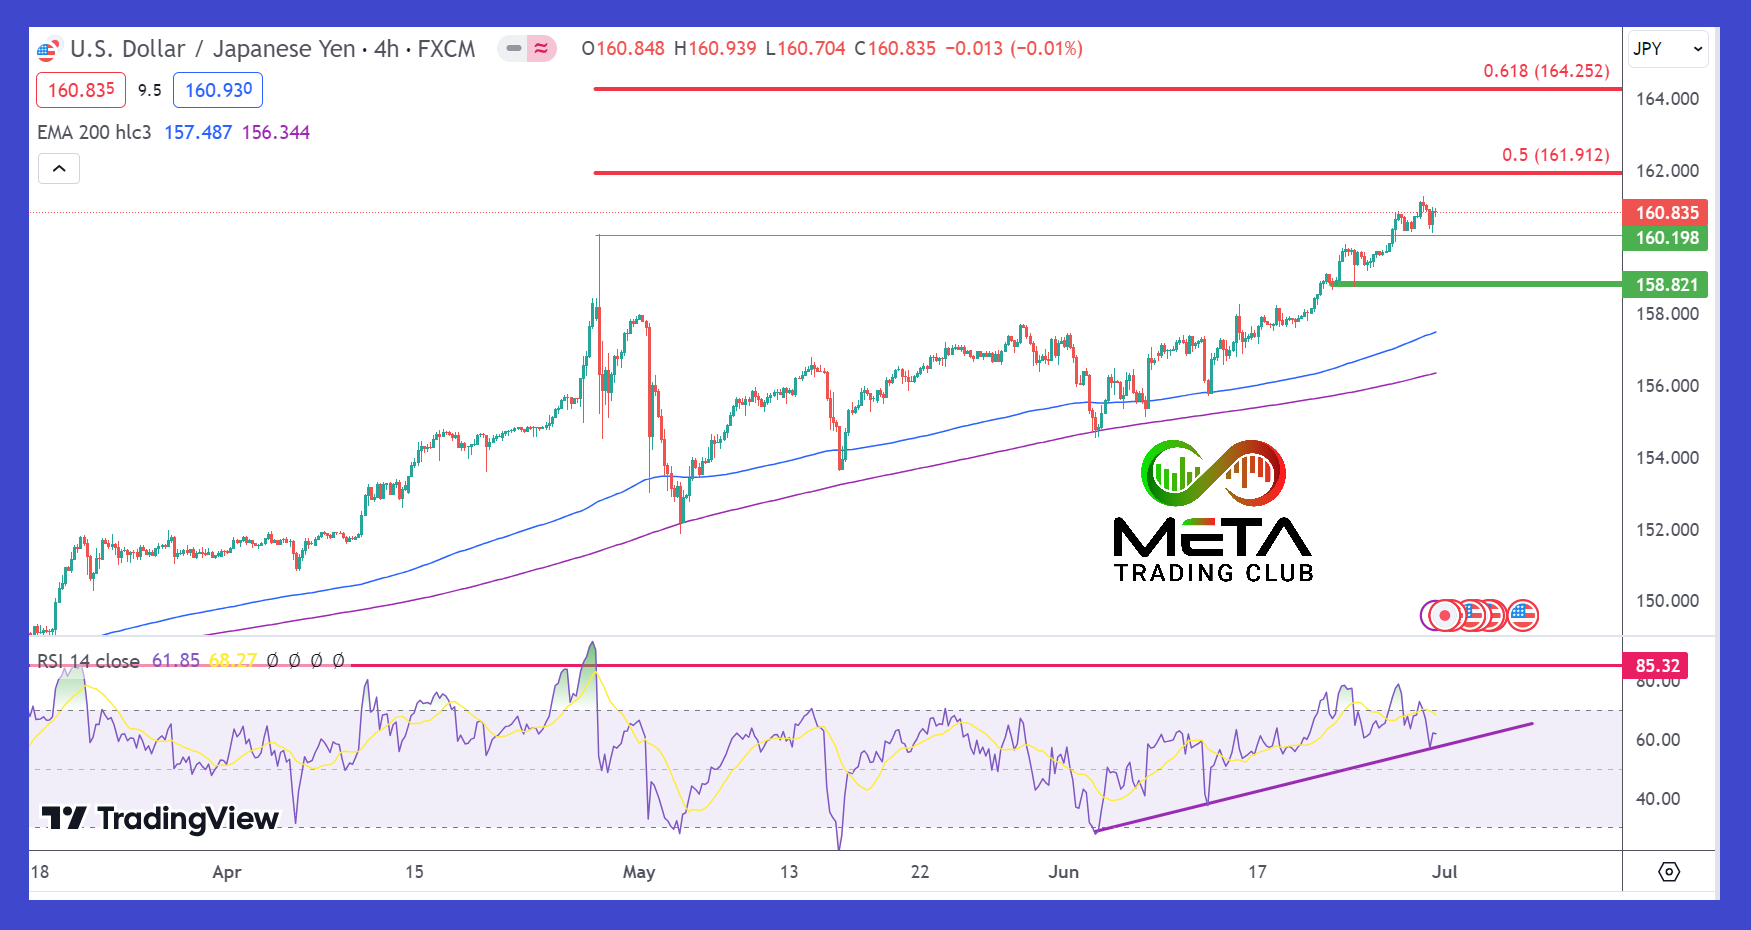
The Japanese currency continued its downtrend, reaching multi-decade lows. Despite the prolonged decline, Japanese authorities refrained from intervening directly in the markets. However, the looming threat of intervention kept traders cautious, resulting in a more controlled descent.
USD/JPY’s break of 160.20 resistance last week confirmed long term uptrend resumption. While some consolidations might be seen, the outlook will stay bullish as long as 158.8 support holds. Next target is 61.8% projection at 164.
Crypto
Here are crypto currencies last week’s performance:
Next Week’s Outlook
Economic Events
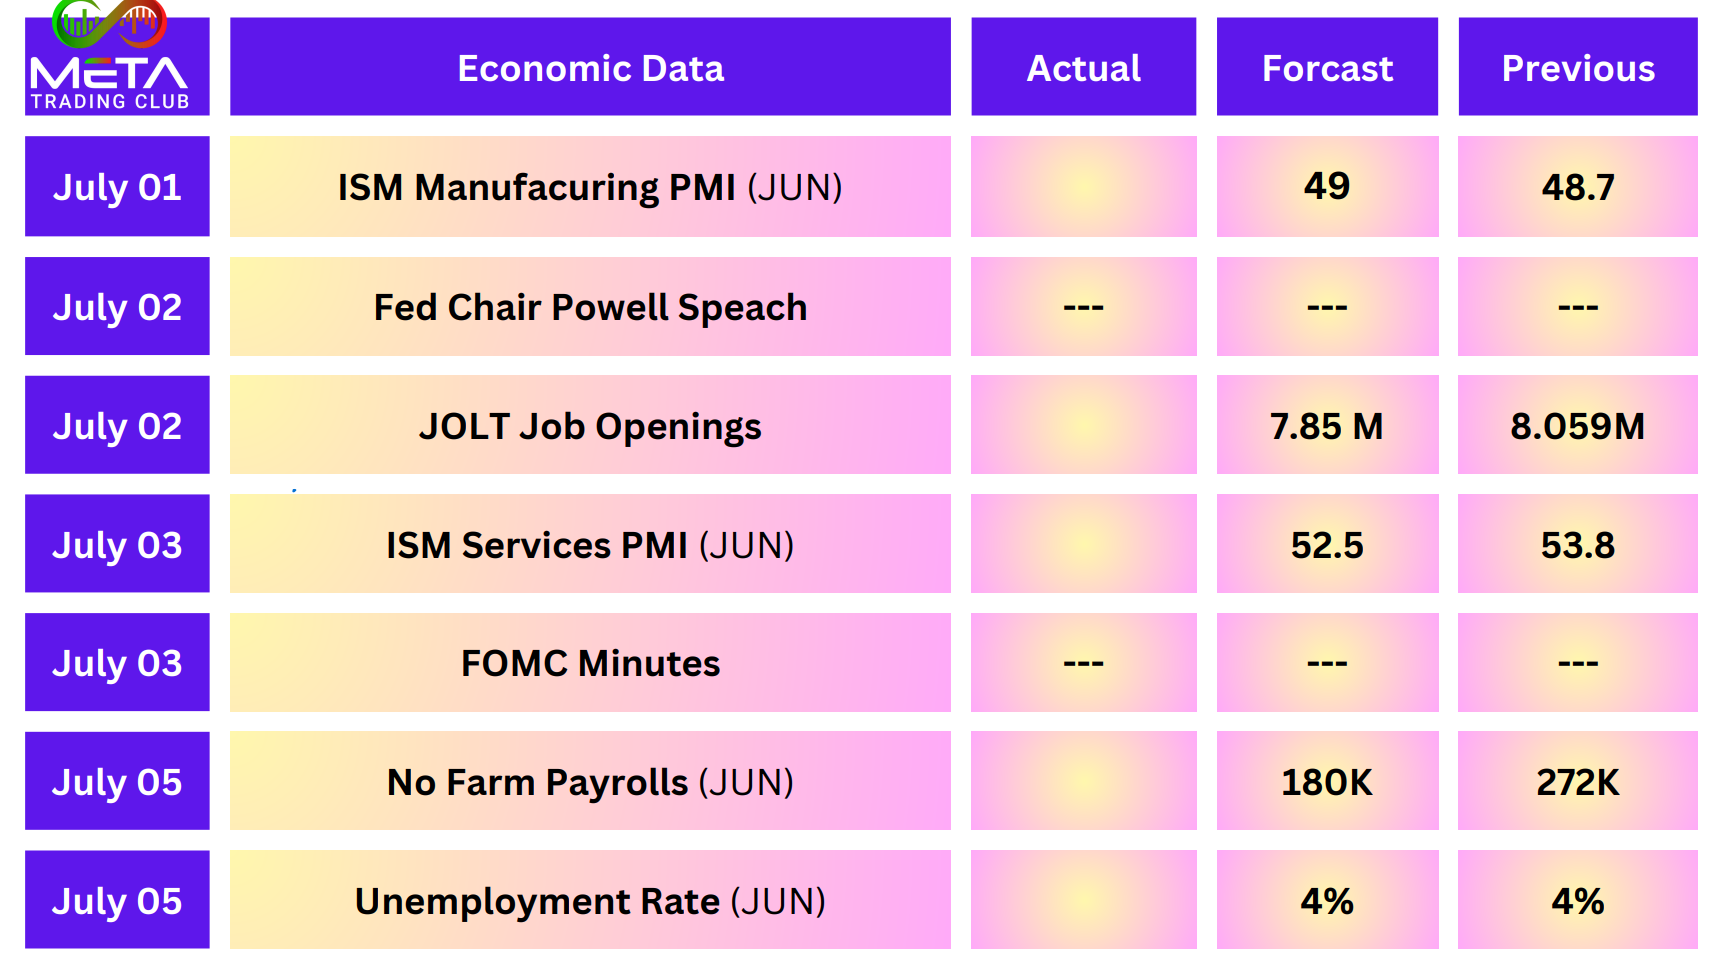
Markets currently see little chance of interest rates moving at the FOMC’s July meeting. Forecasters give roughly a 7%-10% chance of rates being cut in July. In contrast, a rate cut in September is forecasted by 65% of economists.
In addition, the FOMC’s own interest rate forecasts from June 12 implied that one or two cuts are probable in 2024.
Earning Events
This is a fairly quiet week for earnings.