

Triangles are one of those concepts that pop up everywhere—whether you’re solving a geometry problem or analyzing stock charts. Yes, they’re not just for math class! In technical analysis, triangles are among the most common and powerful chart patterns traders use to predict market movements. But here’s the catch: a triangle isn’t just a single pattern. It’s a whole family of patterns, each with its own quirks and nuances. At first glance, it might seem like a lot to wrap your head around, but don’t worry—once you grasp the core concepts, everything starts to click, like pieces of a puzzle falling into place.
So, why are triangles such a big deal in technical analysis? What types of triangles are there, and what are their derivative patterns? Most importantly, how can understanding these patterns improve your trading game? These are the questions we’ll tackle in this post. Stick with us till the end, and you’ll walk away with a solid understanding of one of the most essential tools in a trader’s toolkit.
Table of Contents
The Core Concept: What Makes a Triangle?
At its heart, the concept of a triangle is the same across all its variations. Think of it like this: a triangle pattern is formed when price swings, which start out large and dramatic, gradually become smaller and more subdued. Picture the peaks and valleys of price action slowly closing the distance between them as they converge toward the triangle’s “beak” (or apex, if we’re being fancy). This narrowing of price movement is the essence of what makes a triangle a triangle.
Now, here’s where it gets interesting. The “beak” of the triangle—the point where the trendlines converge—isn’t always perfectly centered. Sometimes it’s tilted upward, other times downward, and occasionally it’s way off to one side, like a triangle that’s had a little too much coffee. But no matter how the beak is positioned, the core anatomy of the pattern remains the same: larger price swings at the base of the triangle gradually give way to smaller, tighter swings as the pattern develops. In other words, price volatility decreases as the triangle forms, creating a sense of tension—like a spring being coiled, ready to snap.
This decrease in volatility is what makes triangles so fascinating (and useful) for traders. It’s a visual representation of the market taking a breather, consolidating, and deciding its next move. And while there are many types of triangles, the standard version—the one you’ll see most often—is called the Symmetrical Triangle.
Symmetrical Triangle
If triangle patterns had a family reunion, the Symmetrical Triangle would undoubtedly be the matriarch. Why? Because this pattern perfectly captures the essence of what triangles are all about: consolidation, tension, and the promise of a breakout. In an uncertain market where anything can happen at any time, the Symmetrical Triangle offers traders a clear structure to identify potential opportunities—if they know how to read it.
Anatomy of the Symmetrical Triangle
Imagine the price entering the triangle with high volatility, swinging wildly between peaks and troughs. As the pattern develops, these swings gradually become smaller and more subdued, like a storm calming into a gentle breeze.
To spot the triangle, just connect the highs with a downward trendline and the lows with an upward trendline. These two lines meet at the triangle’s tip (or “beak”), pointing to the right.
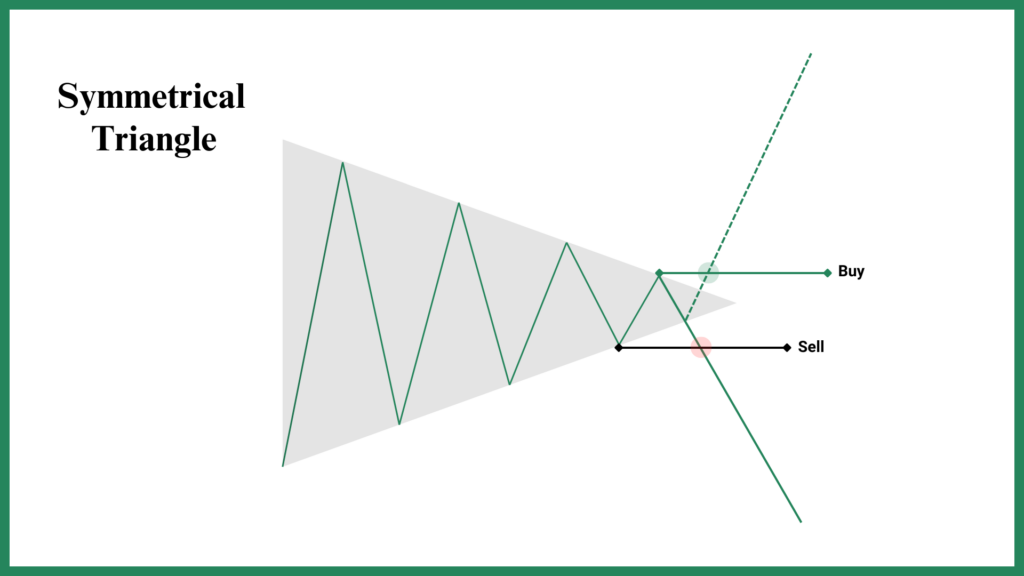
Now that you’ve seen the image, let me ask you a question: What do you think about this pattern? Is it bullish? Bearish? Or maybe both? If you guessed the third option, you’re on the right track. The Symmetrical Triangle is a bilateral pattern, meaning it doesn’t favor one direction over the other. The breakout can happen to the upside or the downside, and it’s your job to wait for confirmation before making a move.
The Dance of Patience and Timing
Trading a Symmetrical Triangle is like watching a coiled spring—it’s all about patience and timing. The price action tightens as volatility decreases, building tension until the market finally decides its next move. When the breakout occurs, it’s often sharp and decisive, revealing the market’s next chapter. Your role as a trader is to analyze the pattern, use supporting indicators (like volume or momentum oscillators) to confirm the breakout, and then ride the wave to profits.
Trading the Symmetrical Triangle
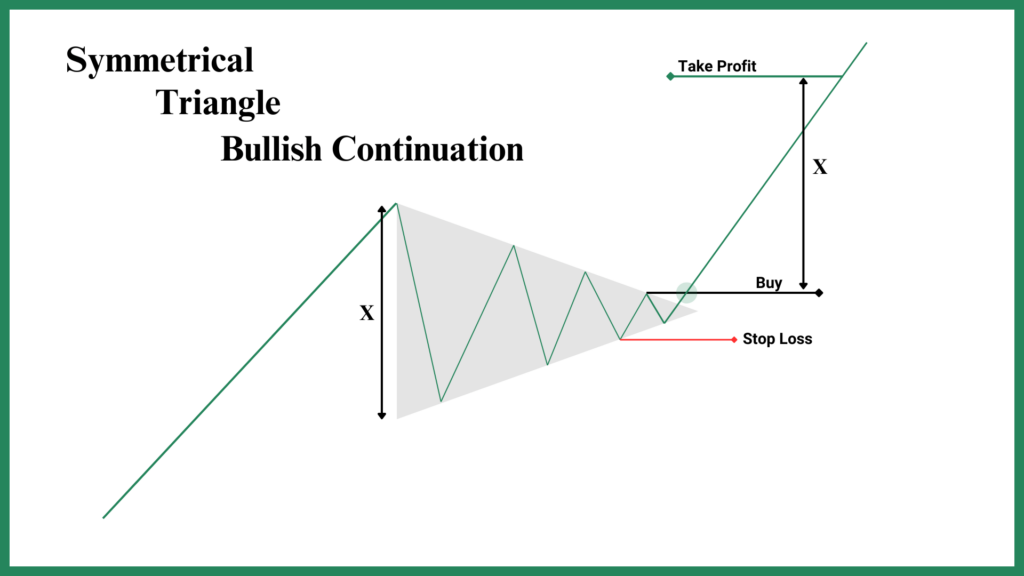
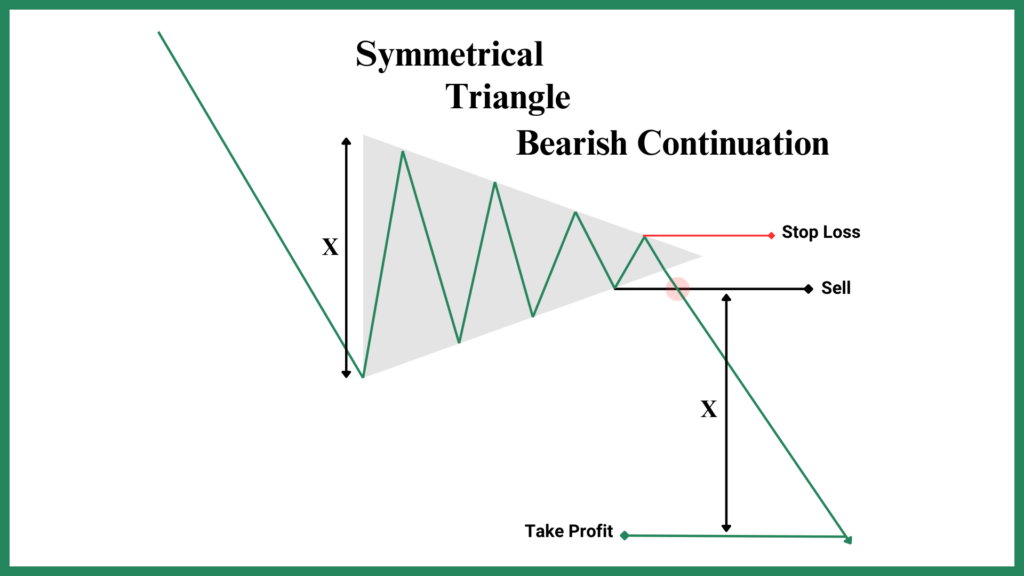
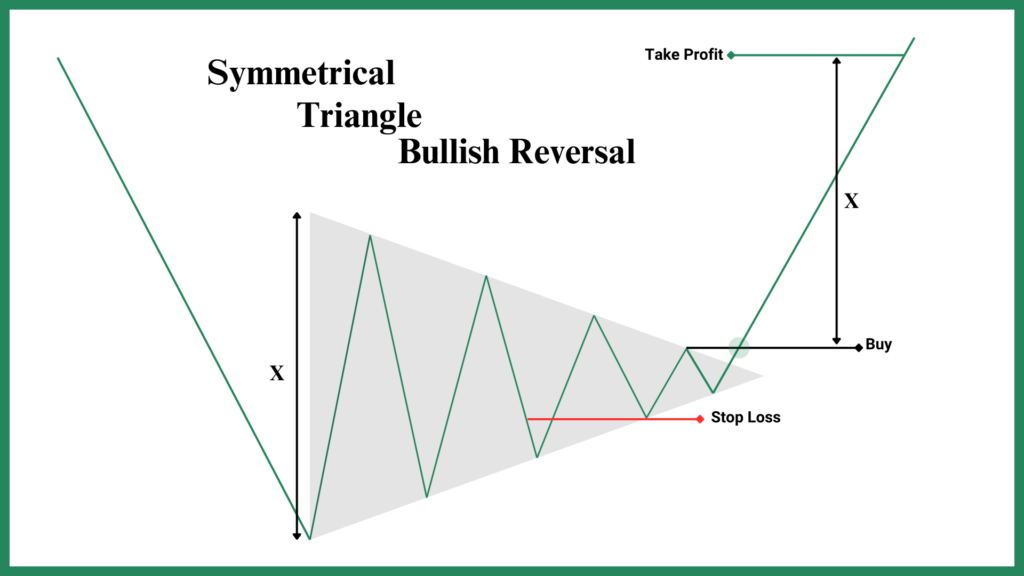
One of the most fascinating things about the Symmetrical Triangle is its versatility. Similar to the Diamond pattern, it can act as:
- A bullish continuation pattern (if the price enters in an uptrend and breaks out upward):
- A bearish continuation pattern (if the price enters in a downtrend and breaks out downward):
A bullish reversal pattern(if the price enters in a downtrend but breaks out upward):
A bearish reversal pattern (if the price enters in an uptrend but breaks out downward):
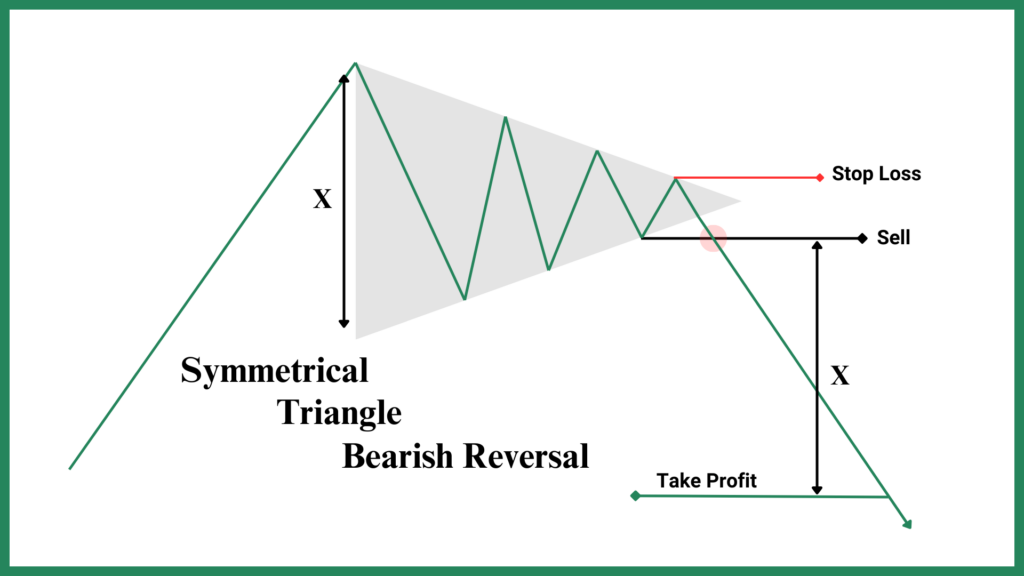
In other words, the Symmetrical Triangle doesn’t play favorites. Its direction depends entirely on where the price enters the pattern and where it exits. This makes it a powerful tool in your trading arsenal—but only if you’re patient enough to wait for confirmation. Analyze the image provided for each scenario, you can see proper entry, stop loss and take profit point for each.
Ascending and Descending Triangles
Unlike their “mom,” the Symmetrical Triangle, Ascending and Descending Triangles are not bilateral patterns. They’re considered continuation patterns, meaning they typically signal that the price will continue in the same direction as the prevailing trend. However, like all patterns, they can fail—turning into false patterns that trap unsuspecting traders. But before we get into trading strategies, let’s break down their anatomy.
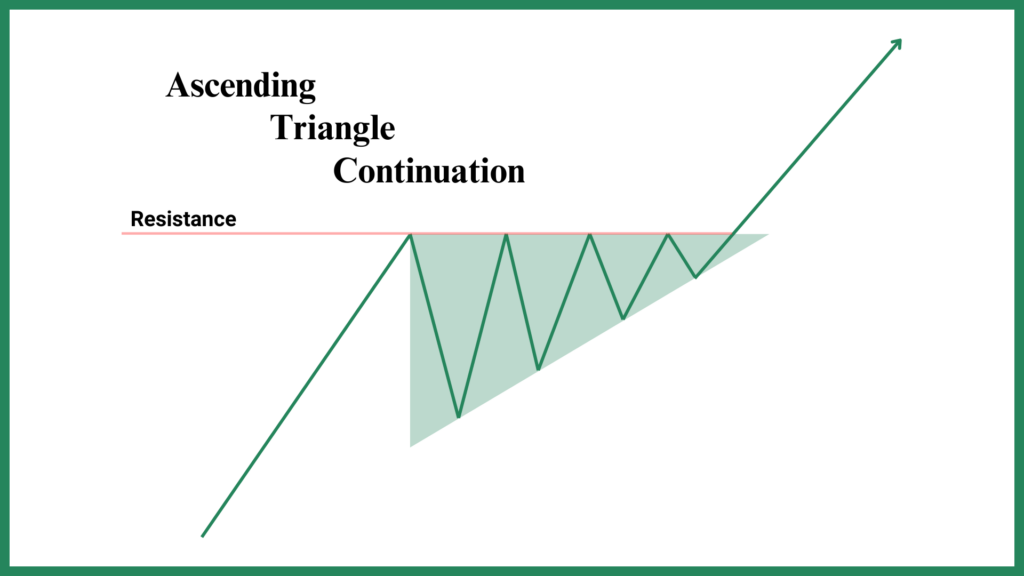
The Anatomy of an Ascending Triangle
The Ascending Triangle is like the Symmetrical Triangle but with a twist. Instead of both sides sloping, the top side is flat, forming a horizontal resistance line. This resistance acts like a ceiling—initially, it holds strong as the price tests it. In fact, the first time the price hits this ceiling, it often drops significantly. But the bulls don’t give up. They keep testing the resistance, each time making a higher low than the previous one.
Think of it like ramming a castle gate: the more times the price tests the resistance, the weaker it becomes, and the more likely a breakout becomes.
Volume plays a crucial role in confirming the Ascending Triangle. Ideally, you’d want to see:
- Increasing volume every time the price tests the resistance.
- Decreasing volume as the price pulls back to form higher lows.
- A significant surge in volume when the price finally breaks through the resistance.
This surge in volume during the breakout is a good sign, as it reduces the chance of a bull trap (a false breakout that reverses quickly).
Trading the Ascending Triangle Pattern
Once you’ve mastered the anatomy of the Ascending Triangle, trading it becomes a straightforward process—provided you wait for confirmation and manage your risk wisely. The first thing to watch for is the breakout above the resistance line. But don’t rush in just yet. A genuine breakout is typically accompanied by strong momentum and a significant surge in trading volume. These factors help confirm that the breakout is real and not a bull trap designed to lure in overeager traders.
If the breakout lacks volume or momentum, it’s often safer to wait for a “Last Kiss” pattern. This occurs when the price retests the resistance level, which has now turned into support, before continuing its upward move. Entering a long position after this retest can provide an extra layer of confirmation, reducing the risk of a false breakout.
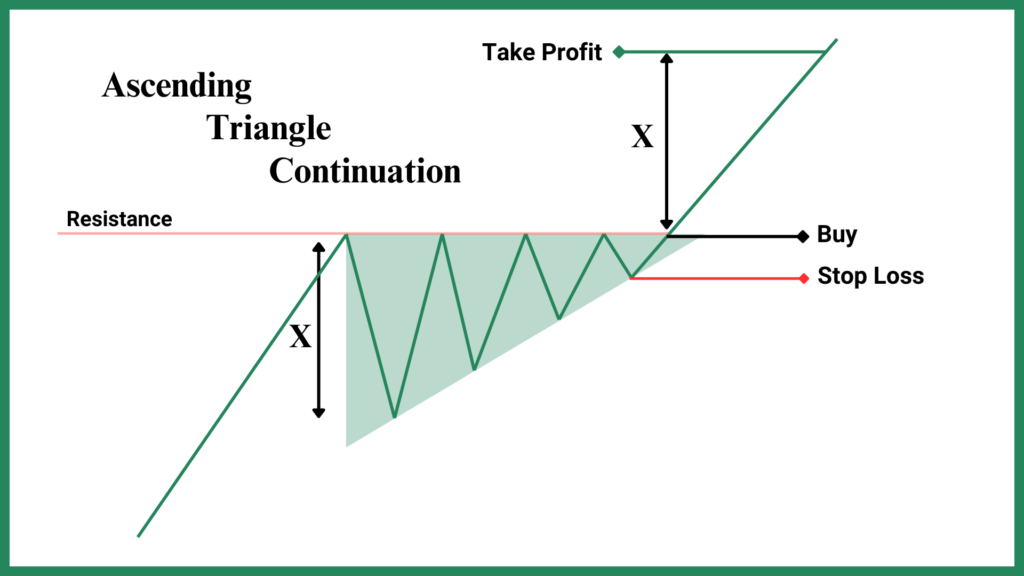
When it comes to setting your take profit target, start by measuring the pattern width. This is the vertical distance between the pattern’s highest peak (resistance) and lowest low (support). After the breakout, it’s common for the price to rise by at least the same amount as the pattern width.
Of course, no trading strategy is complete without a stop loss. For the Ascending Triangle, a sensible place to set your stop loss is below the last pivot low before the breakout. This level acts as a safety net, protecting you in case the breakout fails and the price reverses. That said, feel free to adjust your stop loss based on your risk tolerance or trading strategy.
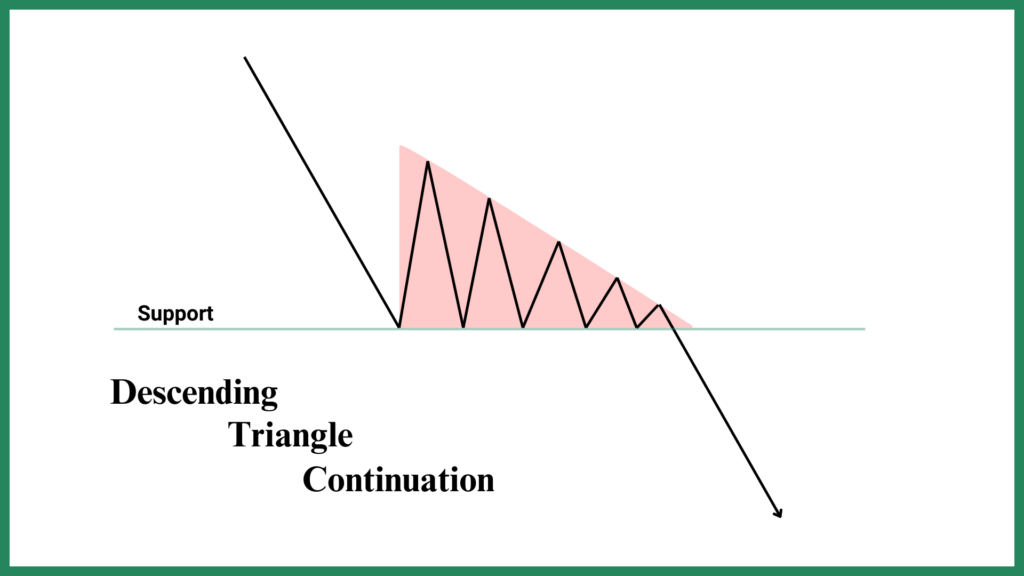
The Anatomy of a Descending Triangle
The Descending Triangle is the bearish counterpart to the Ascending Triangle. Like its sibling, it has a flat side—but this time, it’s the bottom support line that’s horizontal. The top side, however, slopes downward, forming a descending resistance line. This pattern often appears in a downtrend and signals that sellers are gradually gaining control.
Here’s how it works: the price repeatedly tests the support level, but each time it bounces, it does so with lower highs. This creates a sense of weakening momentum among buyers. Eventually, the support line gives way, and the price breaks downward, continuing the prevailing downtrend.
Just like with the Ascending Triangle, volume is a critical factor in confirming the Descending Triangle. Here’s what to look for:
- Increasing volume as the price tests the support level.
- Decreasing volume during the pullbacks to lower highs.
- A significant surge in volume when the price breaks below the support.
This surge in volume during the breakout helps confirm the pattern’s validity and reduces the risk of a bear trap (a false breakdown that reverses quickly).
Trading the Descending Triangle Pattern
Trading the Descending Triangle follows a similar logic to its ascending counterpart, but with a bearish twist. The key is to wait for the price to break below the support line with strong momentum and a significant surge in trading volume. These factors help confirm that the breakout is genuine and not a bear trap designed to catch overly eager sellers.
If the breakout lacks volume or momentum, it’s often safer to wait for a “Last Kiss” pattern. This happens when the price retests the support level, which has now turned into resistance, before continuing its downward move. Entering a short position after this retest can provide an extra layer of confirmation, reducing the risk of a false breakdown.
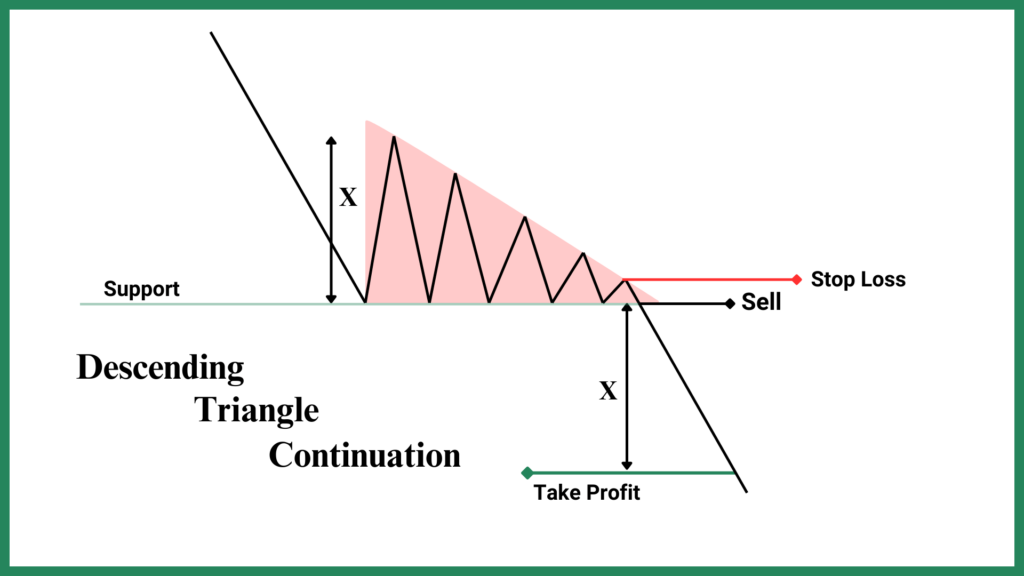
To set your take profit target, measure the pattern width—the vertical distance between the pattern’s highest peak (resistance) and lowest low (support). After the breakout, it’s common for the price to fall by at least the same amount as the pattern width. This gives you a clear and logical target to aim for as the downtrend unfolds.
When it comes to managing risk, place your stop loss above the last pivot high before the breakout. This level acts as a safety net, protecting you in case the breakdown fails and the price reverses. Of course, feel free to adjust your stop loss based on your risk tolerance or trading strategy.
The Flag/Pennant Pattern
Like the triangle patterns we’ve discussed, Flag and Pennant Patterns are also continuation patterns. This means they typically signal a pause in the market before the price continues in the same direction as the prevailing trend. But before we dive into trading strategies, let’s get familiar with their anatomy.
The Anatomy of Flag/Pennant Patterns
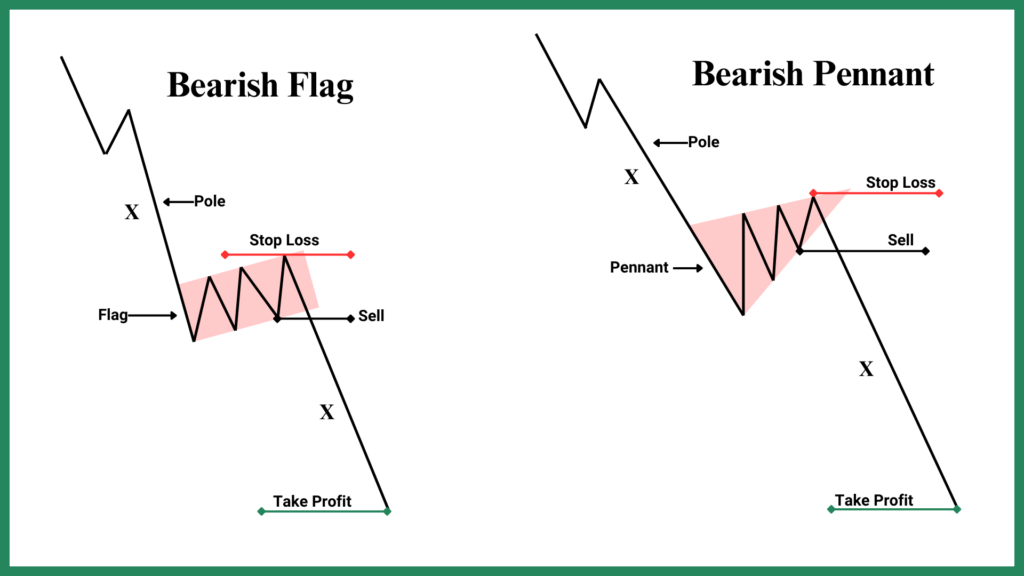
Flags and pennants are like twins—they’re almost identical, with only a slight difference in shape. Both patterns consist of two main parts: the pole and the flag (or pennant).
- The pole is formed by a sharp, almost vertical price movement, often driven by strong momentum.
- The flag (or pennant) is a small consolidation area that forms after the pole, where the price moves sideways or slightly against the trend.
The key difference between the two lies in their shape:
- A Flag is a small rectangular pattern, with parallel trendlines that slope slightly against the prevailing trend.
- A Pennant is a small symmetrical triangle, with converging trendlines that give it a triangular shape.
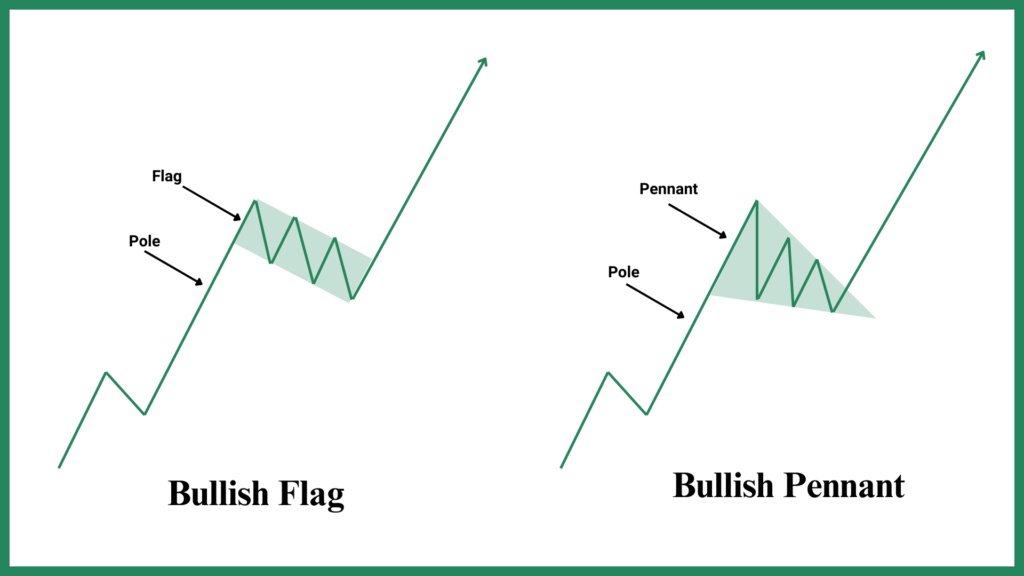
As you can see in the image, the price hits a strong resistance (or support in bearish cases), dips down (or rises in bearish cases), and forms the flag or pennant. These patterns can appear in both bullish and bearish trends, making them versatile tools for traders.
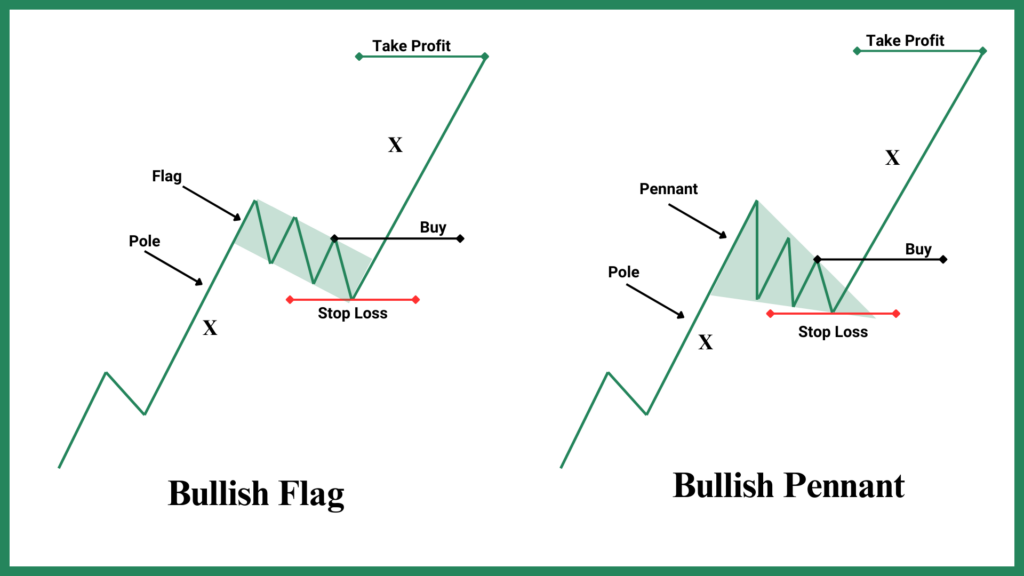
Trading the Bullish Flag/Pennant Pattern
Trading Flag and Pennant Patterns follows a logic similar to trading Ascending and Descending Triangles. These patterns are all about waiting for confirmation and managing risk effectively.
In a bullish Flag or Pennant, the pattern forms after a strong upward move (the pole), followed by a consolidation phase (the flag or pennant). For the pattern to be valid, the price must break above the resistance level of the flag or pennant with strong momentum and high trading volume. This breakout confirms that the uptrend is likely to continue.
If the breakout lacks sufficient volume or momentum, it’s often safer to wait for a “Last Kiss” pattern. This occurs when the price retests the resistance-turned-support level before continuing its upward move. Entering a long position after this retest can provide extra confirmation and reduce the risk of a false breakout.
Once the breakout occurs, you can estimate your take profit target by measuring the length of the pole. It’s expected that the price will rise by at least the same distance as the pole after the breakout. For your stop loss, the standard approach is to place it below the last low pivot point within the flag or pennant. This level acts as a safety net in case the breakout fails and the price reverses.
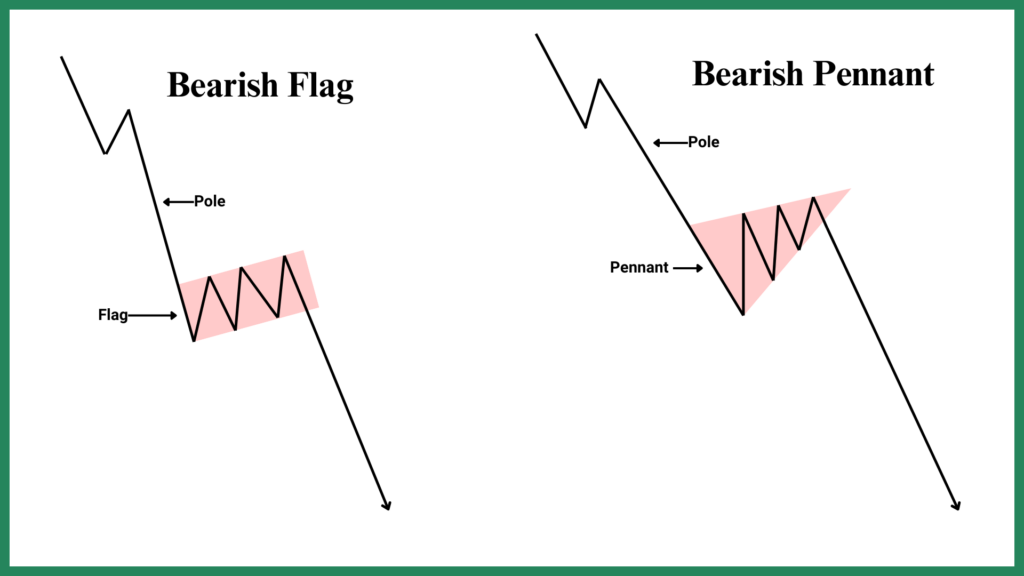
Trading the Bearish Flag/Pennant Pattern
The bearish Flag or Pennant works in the opposite direction. Here, the pattern forms after a sharp downward move (the pole), followed by a consolidation phase (the flag or pennant). For the pattern to be valid, the price must break below the support level of the flag or pennant with strong momentum and high trading volume. This breakdown confirms that the downtrend is likely to continue.
If the breakdown lacks sufficient volume or momentum, it’s wise to wait for a “Last Kiss” pattern. This occurs when the price retests the support-turned-resistance level before continuing its downward move. Entering a short position after this retest can provide extra confirmation and reduce the risk of a false breakdown.
Once the breakdown occurs, you can estimate your take profit target by measuring the length of the pole. It’s expected that the price will fall by at least the same distance as the pole after the breakdown. For your stop loss, the standard approach is to place it above the last high pivot point within the flag or pennant. This level acts as a safety net in case the breakdown fails and the price reverses.
The Expanded Triangle Pattern
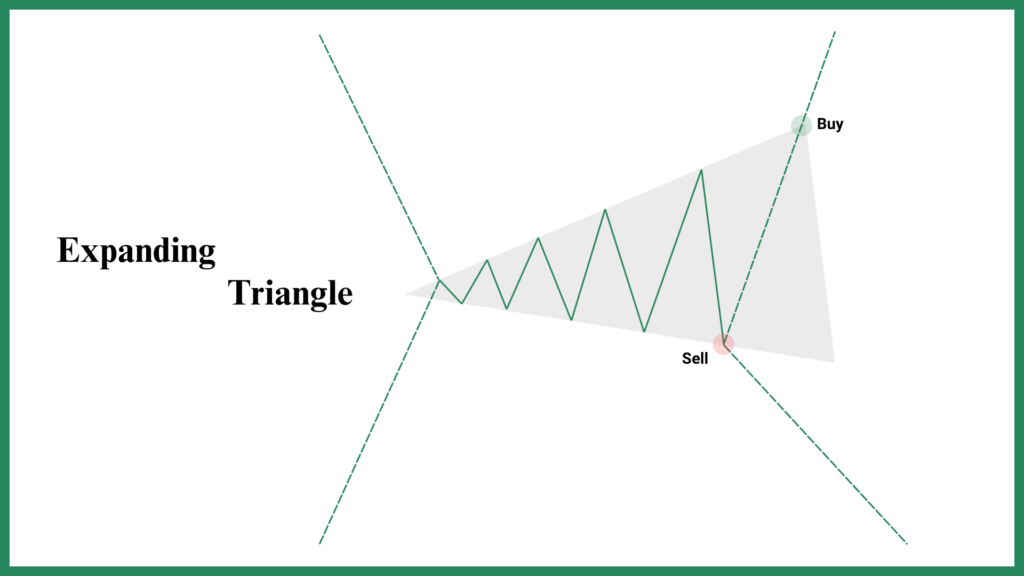
If the Symmetrical Triangle is the “mom” of triangle patterns, the Expanded Triangle is like the daughter who inherited her interests but not the looks. At first glance, it resembles a triangle, but there’s a twist: instead of converging trendlines, the Expanded Triangle features diverging trendlines. This gives it a unique, widening shape that sets it apart from its more traditional siblings.
While the Expanded Triangle is a bilateral pattern (meaning it can break in either direction), it’s not always symmetrical. As long as the two trendlines are diverging—one sloping upward and the other downward—it qualifies as an Expanded Triangle (some sources also refer to it as a broadening Wedge, You will learn about wedges later on).
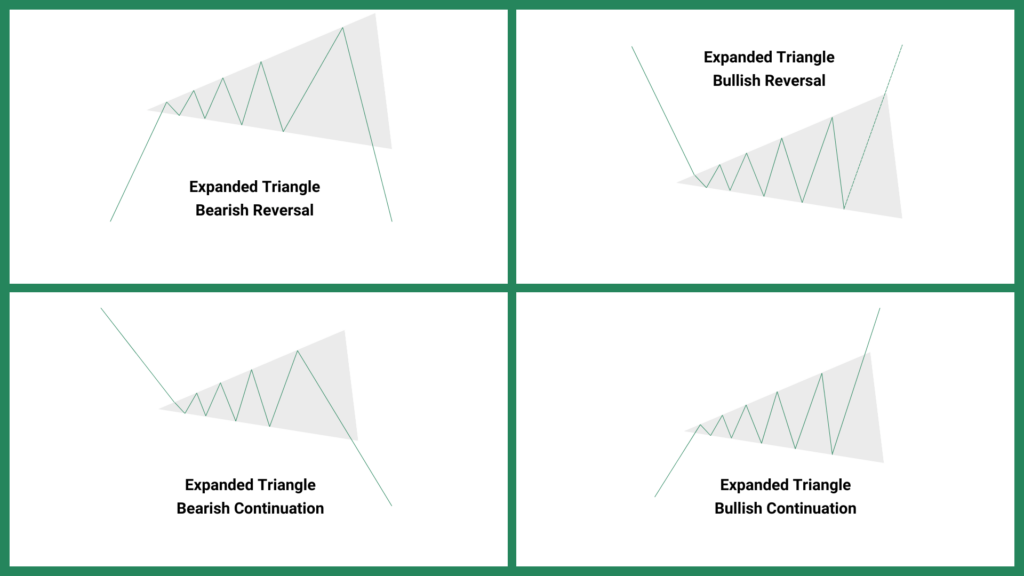
The Four Faces of the Expanded Triangle
Because the Expanded Triangle is bilateral, it has four possible variants, depending on where the price enters and exits the pattern:
- Bearish Reversal: The price enters in an uptrend but breaks downward, reversing the trend.
- Bullish Reversal: The price enters in a downtrend but breaks upward, reversing the trend.
- Bearish Continuation: The price enters in a downtrend and breaks downward, continuing the trend.
- Bullish Continuation: The price enters in an uptrend and breaks upward, continuing the trend.
This versatility makes the Expanded Triangle a fascinating pattern to watch, but it also requires careful analysis. Unlike other patterns, its widening shape reflects increasing volatility, which can lead to dramatic breakouts—or frustrating false signals.
But how can you profit from this wild beast?
Trading the Expanded Triangle Pattern
Trading the Expanded Triangle requires a keen eye for detail and a solid understanding of its unique structure.
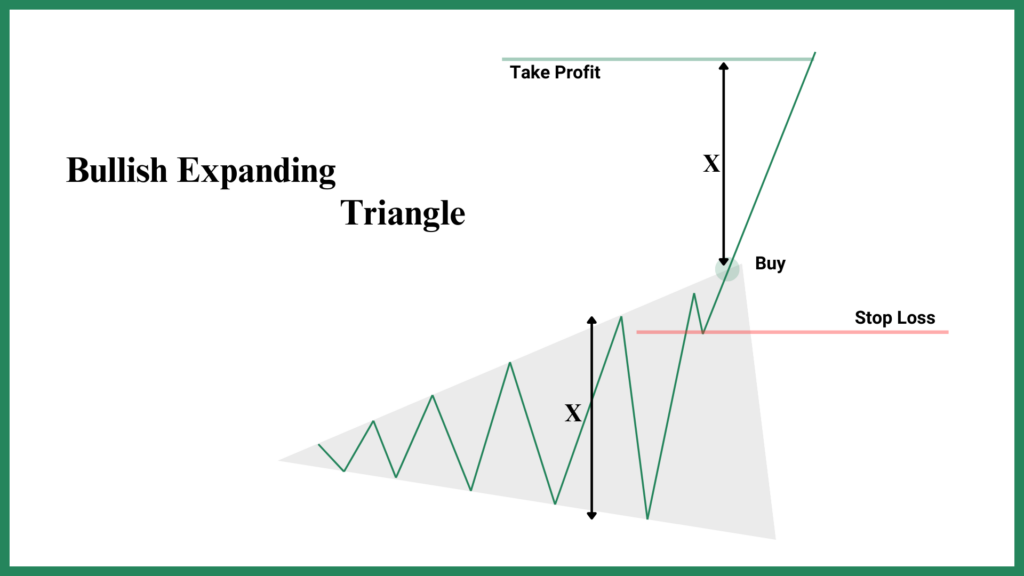
In a bullish scenario, the price breaks above the upper trendline with significant volume and momentum, signaling a potential upward move. This breakout is your cue to consider entering a long position. If the breakout is accompanied by strong momentum and high volume, you can enter right away. However, if the breakout signal is weak, it’s often safer to wait for a retest of the trendline. This retest acts as confirmation, reducing the risk of a false breakout.
Once the breakout is confirmed, you can estimate your take profit target by measuring the price difference between the highest peak and the lowest valley within the pattern. It’s expected that the price will rise by at least this amount after the breakout. For your stop loss, a common approach is to place it below the last pivot low just before the breakout. This level acts as a safety net in case the breakout fails and the price reverses.
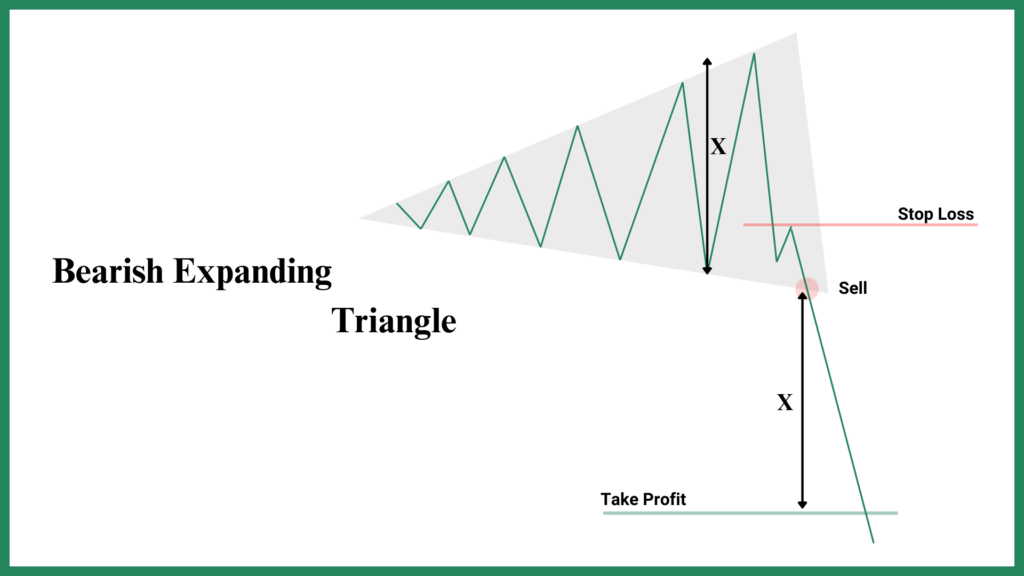
Trading the Bearish Expanded Triangle
In a bearish scenario, the price breaks below the lower trendline with significant volume and momentum, signaling a potential downward move. This breakdown is your cue to consider entering a short position. If the breakdown is accompanied by strong momentum and high volume, you can enter right away. However, if the signal is weak, it’s often safer to wait for a retest of the trendline. This retest acts as confirmation, reducing the risk of a false breakdown.
Once the breakdown is confirmed, you can estimate your take profit target by measuring the price difference between the highest peak and the lowest valley within the pattern. It’s expected that the price will fall by at least this amount after the breakdown. For your stop loss, a common approach is to place it above the last pivot high just before the breakdown.
The Wedge Pattern
The Wedge Pattern is another powerful tool in a trader’s arsenal, known for its ability to signal both reversals and continuations. Like the triangle patterns we’ve discussed, the Wedge is formed by converging trendlines. However, what sets it apart is the direction of those trendlines. There are two main types of Wedges: the Rising Wedge and the Falling Wedge. Both are bilateral patterns, meaning they can break in either direction, depending on the context.
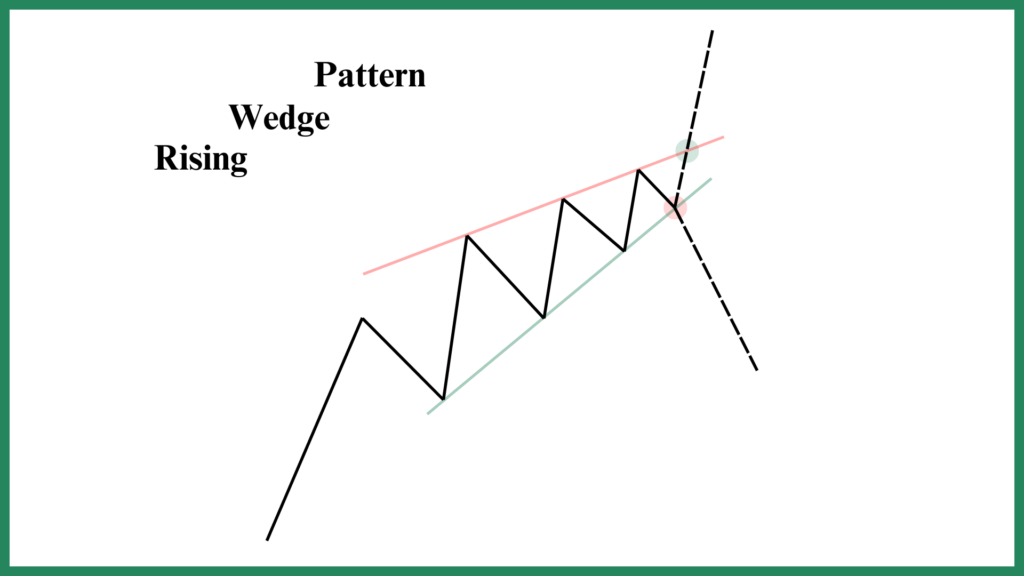
The Rising Wedge
The Rising Wedge is characterized by two upward-sloping trendlines that converge as the pattern develops. While both trendlines are moving in the same direction (upward), the price action between them becomes increasingly narrow, reflecting a loss of momentum. This pattern often forms in an uptrend and can signal either a continuation or a reversal, depending on where the price breaks.
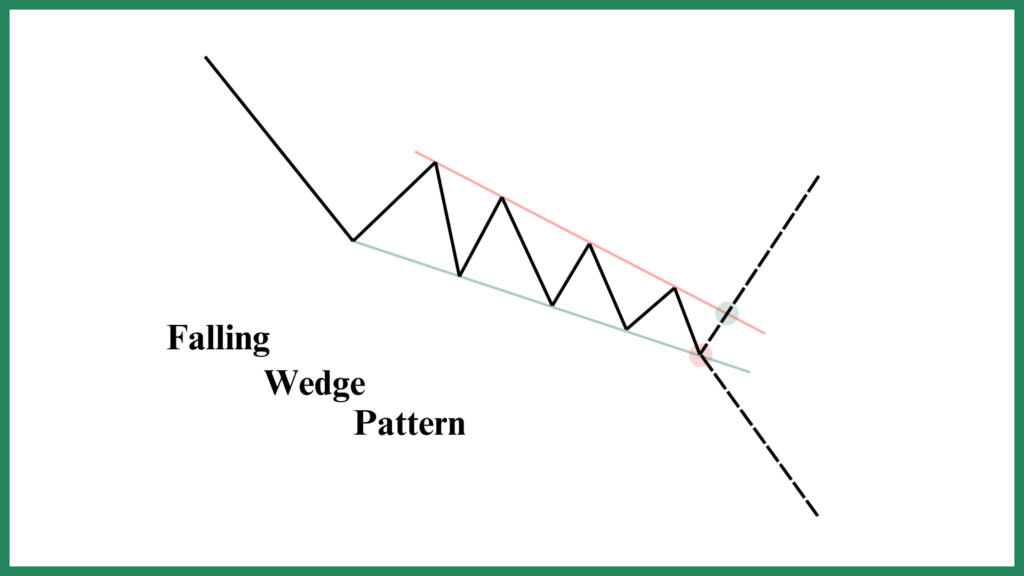
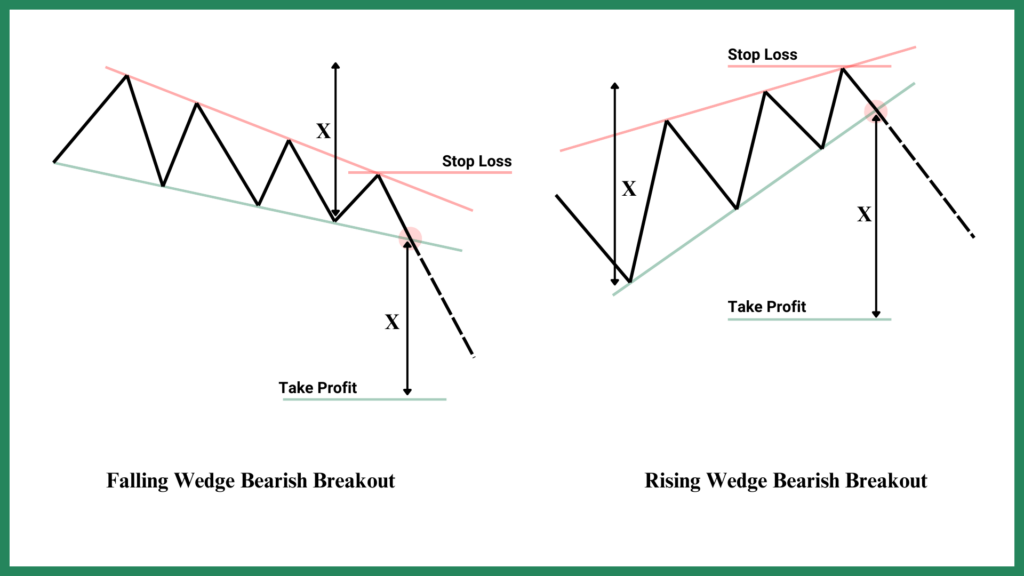
The Falling Wedge
The Falling Wedge is the mirror image of the Rising Wedge. Here, both trendlines slope downward, converging as the pattern develops. While the trendlines are moving in the same direction (downward), the price action between them tightens, indicating a potential slowdown in selling pressure. This pattern often forms in a downtrend and, like its rising counterpart, can signal either a continuation or a reversal, depending on the breakout direction.
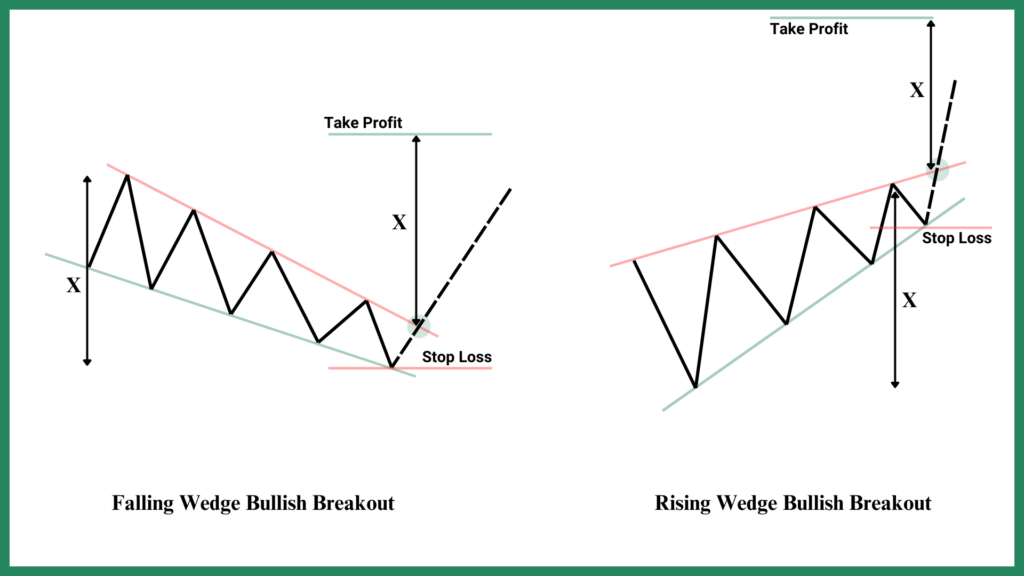
Trading a Bullish Breakout
In a bullish breakout, the price breaks above the upper trendline of the Wedge with a surge in trading volume. This surge is crucial, as it confirms that the breakout has strong momentum behind it. If the breakout is accompanied by high volume, you can consider entering a long position immediately. However, if the volume is lacking, it’s often safer to wait for a retest of the trendline to confirm the breakout’s validity.
Once the breakout is confirmed, you can estimate your take profit target by measuring the pattern width—the price difference between the highest peak and the lowest valley within the Wedge. It’s expected that the price will rise by at least this amount after the breakout. For your stop loss, the standard approach is to place it below the last valley before the breakout. This level acts as a safety net in case the breakout fails and the price reverses.
Trading the Bearish Breakout
In a bearish breakout, the price breaks below the lower trendline of the Wedge with significant trading volume. This volume surge is key to confirming the breakout’s strength. If the breakdown is accompanied by high volume, you can consider entering a short position immediately. However, if the volume is weak, it’s often safer to wait for a retest of the trendline to confirm the breakdown’s validity.
Once the breakdown is confirmed, you can estimate your take profit target by measuring the pattern width—the price difference between the highest peak and the lowest valley within the Wedge. It’s expected that the price will fall by at least this amount after the breakdown. For your stop loss, the standard approach is to place it above the last peak before the breakdown. This level acts as a safety net in case the breakdown fails and the price reverses.
It’s easy for beginners to overlook a crucial detail about Wedge Patterns: both Rising and Falling Wedges are bilateral, meaning they can result in either bullish or bearish breakouts. A Rising Wedge, despite its upward-sloping trendlines, doesn’t always lead to a bullish breakout—it can just as easily break downward, signaling a reversal.
Similarly, a Falling Wedge, with its downward-sloping trendlines, isn’t exclusively bearish; it can break upward, indicating a potential reversal or continuation of an uptrend. This duality is what makes Wedge Patterns both fascinating and tricky. Always wait for confirmation—whether through volume, momentum, or a retest—before jumping into a trade, as assuming the direction of the breakout can lead to costly mistakes.
Final Words
You’ve made it to the end, and your trading toolkit just got a serious upgrade. Pat yourself on the back—understanding these patterns is no small feat! But here’s the thing: knowledge alone won’t fill your pockets (unless you’re a financial professor, and even then…). The real magic happens when you put this into practice.
And if you’re serious about turning this knowledge into consistent gains, consider joining our MTC Incubator Program. We’ll help you refine your strategy, avoid costly mistakes, and connect with a community of traders who’ve been in your shoes. Because let’s face it—trading is a marathon, not a sprint, and it’s easier to cross the finish line with the right team.
FAQ
Yes, triangle patterns (symmetrical, ascending, descending) are reliable when confirmed by volume and momentum. However, false breakouts can occur, so always wait for retests or use additional indicators like RSI or MACD to validate signals.
Yes! While symmetrical triangles are typically continuation patterns, they can signal reversals depending on the breakout direction. A downward breakout in an uptrend (or vice versa) may indicate a trend reversal. Confirm with volume and price action to avoid false signals.
Avoid false breakouts by waiting for a retest of the trendline after the initial breakout. Pair this with high volume confirmation and avoid trading during low-liquidity periods (e.g., weekends or holidays) when false signals are more common.
Wedges have two trendlines sloping in the same direction (both up or down), while triangles have converging trendlines sloping in opposite directions. Wedges often signal reversals, whereas triangles are typically continuation patterns.
Yes! Volume should surge during the breakout to confirm validity. Low volume increases the risk of false signals. Expanded triangles rely on volatility, so erratic price moves without volume support are often untrustworthy.