You probably have heard about trading before, or perhaps general perception of trading. Maybe from that one friend who’s always talking about “the markets” like it’s some secret club, or perhaps you’ve seen those Hollywood movies where traders are portrayed as adrenaline junkies making millions with a single call or throwing away their cash at anything that entertains them for mere seconds. They make it look like all you need is a slick suit, a few screens, and close up shots of prices moving up and down, and boom you are rolling in money. Well, let’s pump the brakes on that generic fantasy.
Let’s look at the facts for the sake of our wallets. Trading might not be as glamorous and easy as it’s often portrayed, but if you put the time and effort, it has a decent pay off. You’re not going to start your day on a yacht and end it in a Ferrari (sorry to burst that bubble). In reality, trading is a bit more human. It’s more about understanding numbers, patterns, and believe it or not, managing your emotions.
But don’t worry, we are not here to bore you with jargon or make you feel like you need a PhD in finance to get started. In fact, unlike many other occupations, trading requires no academic background. This blog is all about breaking down the basics, making sense of the madness, and giving you a peek behind the curtain of what trading really is. Spoiler alert, it’s not all champagne and caviar, but it’s also not as intimidating as it might seem.
Table of Contents
What is Trading?
What exactly is trading after all? Is it some magical art where people somehow turn a few dollars into a fortune while sipping espresso in their designer suits? Not quite.
At its core, trading is really just the act of buying and selling financial assets. Think of it as going to a market, but instead of buying apples or tomatoes, you’re buying things like stocks, currencies, or commodities. The goal? Simple, buy low, sell high, and hopefully walk away with a profit. Sounds easy, right? Well let’s just say trading is like an onion, it has layers .
Trading isn’t about crystal balls, gut feelings, or wild guesses (though plenty of people try that approach, usually to their own demise). It’s more like a game of chess; strategy, analysis, discipline, timing, and a lot of patience.
Now, there’s this myth that to become a successful trader, you must go through a certain path and follow “Mechanical Rules” that lead you to massive green numbers on your screen. But to what extent do these “Mechanical Rules” work?
Let’s put it this way, if these so-called “Mechanical Rules” were so effective, then trading bots would have been the greatest thing ever, replacing all traders and sending all analysts, traders and investors back to their homes.

Although trading is essentially a game of buying something you think will go up in value and then selling it before it crashes back down, there is no “The Correct Way” to trading. There are various trading styles, markets, strategies that can be productive or destructive depending each trader’s unique personality.
The bad news is that many sources overlook the individuality of traders, but the upside is that at Meta Trading Club, we not only recognize but also prioritize your unique personality and traits, offering you a guide specifically tailored to your personality type.
Among the very first questions beginner traders ask is the difference between trading and investing. We will cover this matter next.
Investing vs. Trading: What's the Difference?
Short answer? Trading involves buying and selling assets quickly to profit from short to mid term price changes. Investing means holding assets long term for gradual growth. Traders aim for frequent, smaller gains, while investors seek larger returns over time. Trading requires more active management and carries higher risk, whereas investing is generally less risky and demands less attention. The longer answer is more nuanced. To capture a more complete picture, let’s imagine trading as a running race.
In the trading world, everyone’s running the same race, but not everyone’s running at the same speed. Picture a running match where the competitors vary wildly in height, some traders are short but fast, darshing toward the finish line like they’ve had way too much coffee and you missed the train to work. Others are giants, taking their sweet time, knowing they can cover the same distance with one or two massive steps forward.

First, we’ve got the sprinters, scalpers and day traders. These folks are all about agility and adaptability. They buy and sell assets within the same day, aiming to make profits faster than you can say “stock ticker.” For them it’s all about getting in, making quick trades, and getting out before they fall for greed and excess. Think of them as the runners with short legs but lightning speed, they may take more steps, but they’re always moving.
Next, we have the swing traders, these are the median runners. They’re not quite as frantic as the scalpers, but they’re not lounging around either. They trade over days or weeks, waiting for the perfect opportunity to jump in or out. They’re like the runners with a medium stride, pacing themselves, but always keeping an eye on the finish line.
And then, we have the giants, the position traders. These folks aren’t in a hurry. They trade slowly but deliberately, holding onto their assets for months or even years before making a move. They’re the ones who take one giant step while the sprinters are still catching their breath. When they do make a trade, it’s big and potentially game changing.
But let’s not forget the investors, these guys are playing a whole different game. Investors aren’t interested in sprinting at all. They’re more like marathon walkers, taking their time and enjoying the scenery. Instead of making quick profits by buying and selling assets, they buy something and might just hold onto it forever. Seriously, they might never sell it at all! Why? Because they’re in it for the long haul, focusing on the big picture.

You see, investors are the ones who plant a tree and watch it grow. They’re not necessarily looking to sell their investments to make a profit, that would be too exciting. Instead, they might just sit back and let their investments generate income via dividends. It’s kind of like having money trees that drop money instead of apples. Who needs to sell when you can just keep raking in the cash?
So, what’s the big difference between trading and investing? Well, traders are those sprinters, mid distance runners, and giants we talked about earlier. They’re all about making profits by buying and selling assets, timing the market, and trying to outpace everyone else. It’s a game of speed, strategy, and sometimes a bit of luck. Investors, on the other hand, are more like those marathon walkers. They’re in no rush. They’re not dashing in the race; they’re here to build wealth slowly but surely.
So, which one’s better? Well, that depends on your style. Do you like the fast paced thrill of the chase, or are you more comfortable with a slow and steady approach? Whether you’re a trader looking to make quick profits or an investor aiming to grow wealth over time, knowing the difference is key. Because while both can make you money, they require very different mindsets, attributes, skills, and maybe a different level of caffeine intake.
Price-Time Data and Charts
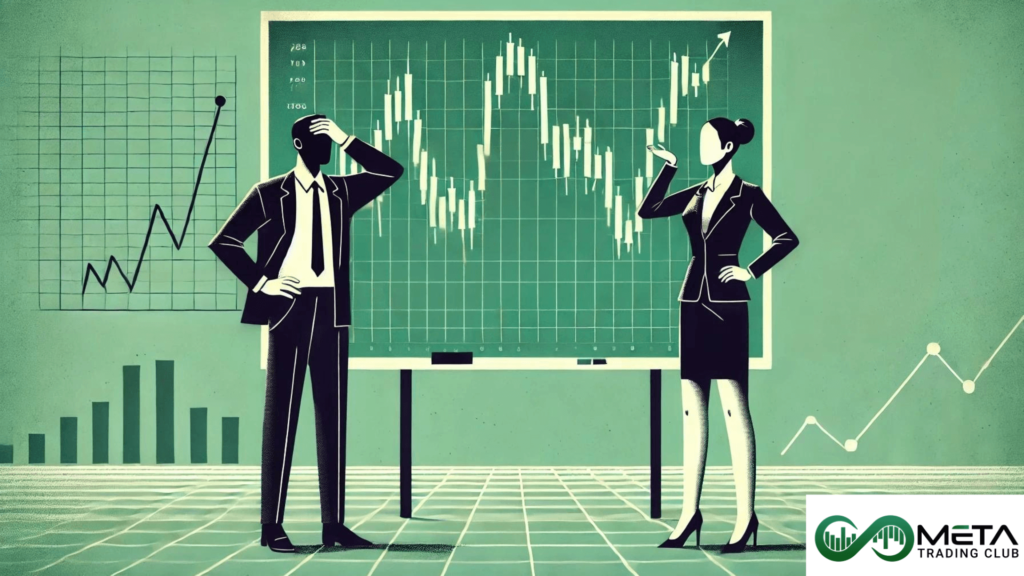
So, what exactly are these mystical price charts everyone keeps talking about? You’ve probably seen them splashed across financial news screens or, more likely, in every Hollywood movie where some genius trader is yelling “Buy Buy Buy! Sell Sell Sell!” at a wall of monitors. They look complex, filled with squiggly lines and colorful bars, but trust me they are both colorful and tasty once you get the hang of them.
At their simplest, price charts are just fancy graphs showing how the price of something (like a stock, currency, or commodity) changes over time. Think of it as the world’s most corporate-friendly roller coaster ride, except instead of screaming kids, you’ve got screaming adults in suits and ties, sweating over every tiny dip and rise. The chart goes upward when prices rise and downward when they fall, giving you a visual of the market’s mood swings.
Now, why do traders and investors use these charts? Well, it’s not just because they look cool on multiple screens (though that’s definitely a perk). These charts help them spot trends, patterns, and potentially anticipate future price movements.
Making Sense of Price Charts
Alright, so you’ve got these charts, but how do you actually read them without your brain melting? Let’s start with the simplest of the bunch, the line chart. Imagine drawing a line from the price of an asset at the start of the day to the price at the end. That’s basically what a line chart does. It connects the prices of an asset over a specific period, showing you a nice, smooth line that goes up and down, depending on how the market’s feeling.
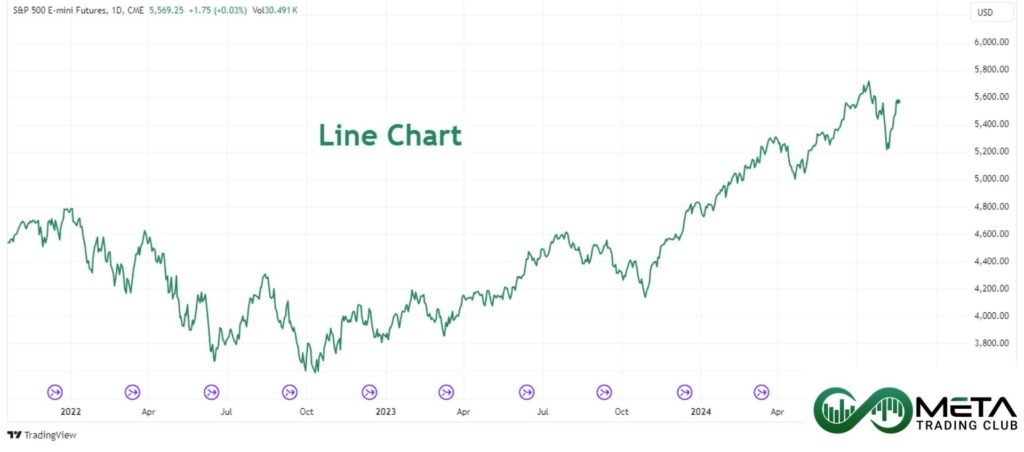
But here’s the problem, what is that line actually showing you? Is it the highest price of the day? The lowest? Maybe the price when the market opened? Or when it closed? The line chart doesn’t tell you any of that! It’s like getting a summary of a movie where they only tell you the ending. Sure, you know how it wraps up, but you’re missing all the juicy details in between.
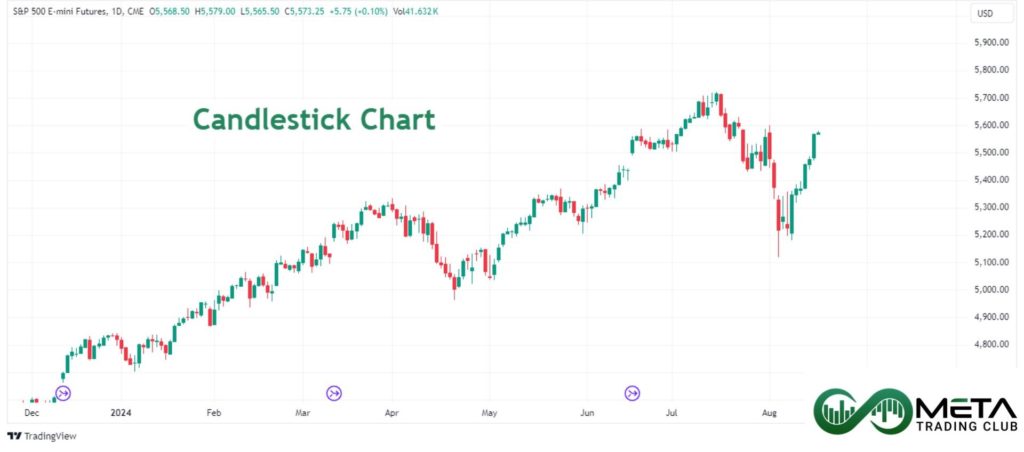
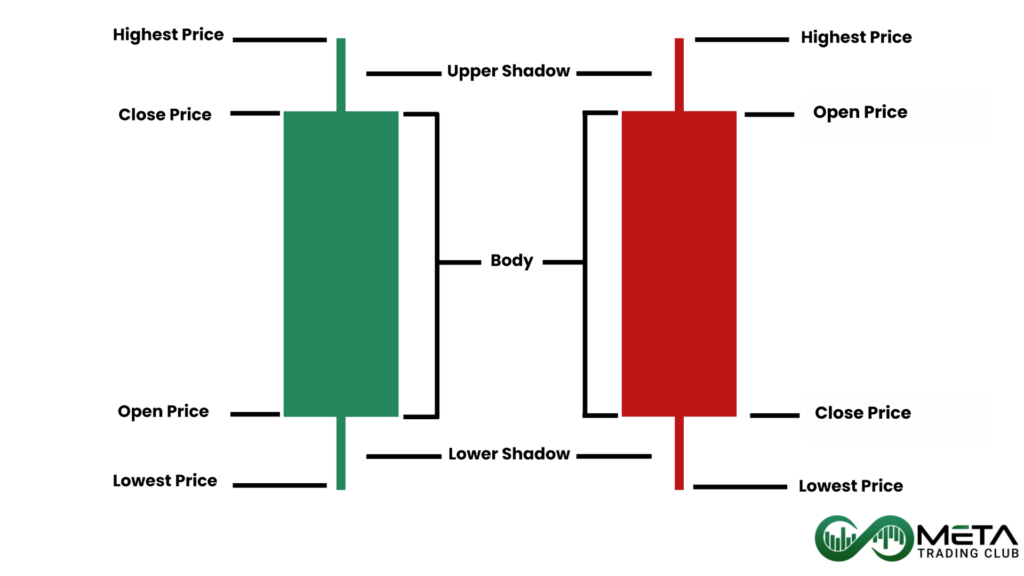
This is why, if you’ve ever watched a finance movie (or pretended to), you’ve seen those fancy candlestick charts on the screen. Candlestick charts are like the deluxe version of line charts, they don’t just give you the final price; they serve up a full meal of data. Each “candlestick” shows you the opening price, the closing price, and the highest and lowest prices the asset reached during a specific timeframe.
How to Read Candlestick Charts?
Each candlestick has a body and wicks (sometimes called shadows). The body shows the range between the opening and closing prices. If the body is filled red (usually red or black), it means the price closed lower than it opened, a bad day for that asset. If the body is filled green (usually green or white), the price has closed higher than it opened, good day for that asset.
The wicks? They tell you the high and low prices for the timeframe (can be anything from one second to a Year, e.g. if the Daily timeframe is selected then each candlestick presents a day). So, you’re not just seeing where the price ended up, but also how wild the ride was along the way.
Well, congratulations! you are now familiar with the basics of trading. Learn Where and How to start, Technical and Fundamental Analysis, and finally risk management and you are free to start your trading journey.
Final Words
And there you have it, a crash course on the basics of trading, investing, and the mysterious world of price charts. Hopefully, you’re feeling a bit more enlightened and a lot less intimidated by all those squiggly lines and financial jargon. Whether you’re dreaming of becoming the next trading prodigy or just want to understand what all the fuss is about, you’re now armed with the knowledge to start exploring this fascinating world on your own terms. Remember, it’s not about mastering everything overnight, trading and investing are journeys, not sprints.
Just keep in mind as you move forward that the world of finance isn’t all glitz and glamor like the movies make it out to be. It’s more like a roller coaster with its ups and downs, moments of thrill, and times when you just want to close your eyes and hope for the best. But with patience, practice, and proper education, you’ll find your way.
FAQ
A trader buys and sells financial assets like stocks, currencies, or commodities in the market to profit from price changes over a short period.
Traders make money by buying assets at a lower price and selling them at a higher price, or by short-selling, which means selling first and buying back at a lower price.
Trading involves buying and selling assets frequently for short-term profits, while investing is about holding assets for the long term to gain from their growth over time.
It highly depends on your personality. Neither is inherently better; trading suits those who prefer short-term gains and can manage risk actively, while investing is better for long-term growth and stability.
A trading style refers to how a trader approaches their trades. The four main styles are: day trading (in and out within a day), swing trading (holding for several days to weeks), position trading (holding for months), and scalping (making many small trades for quick profits).


