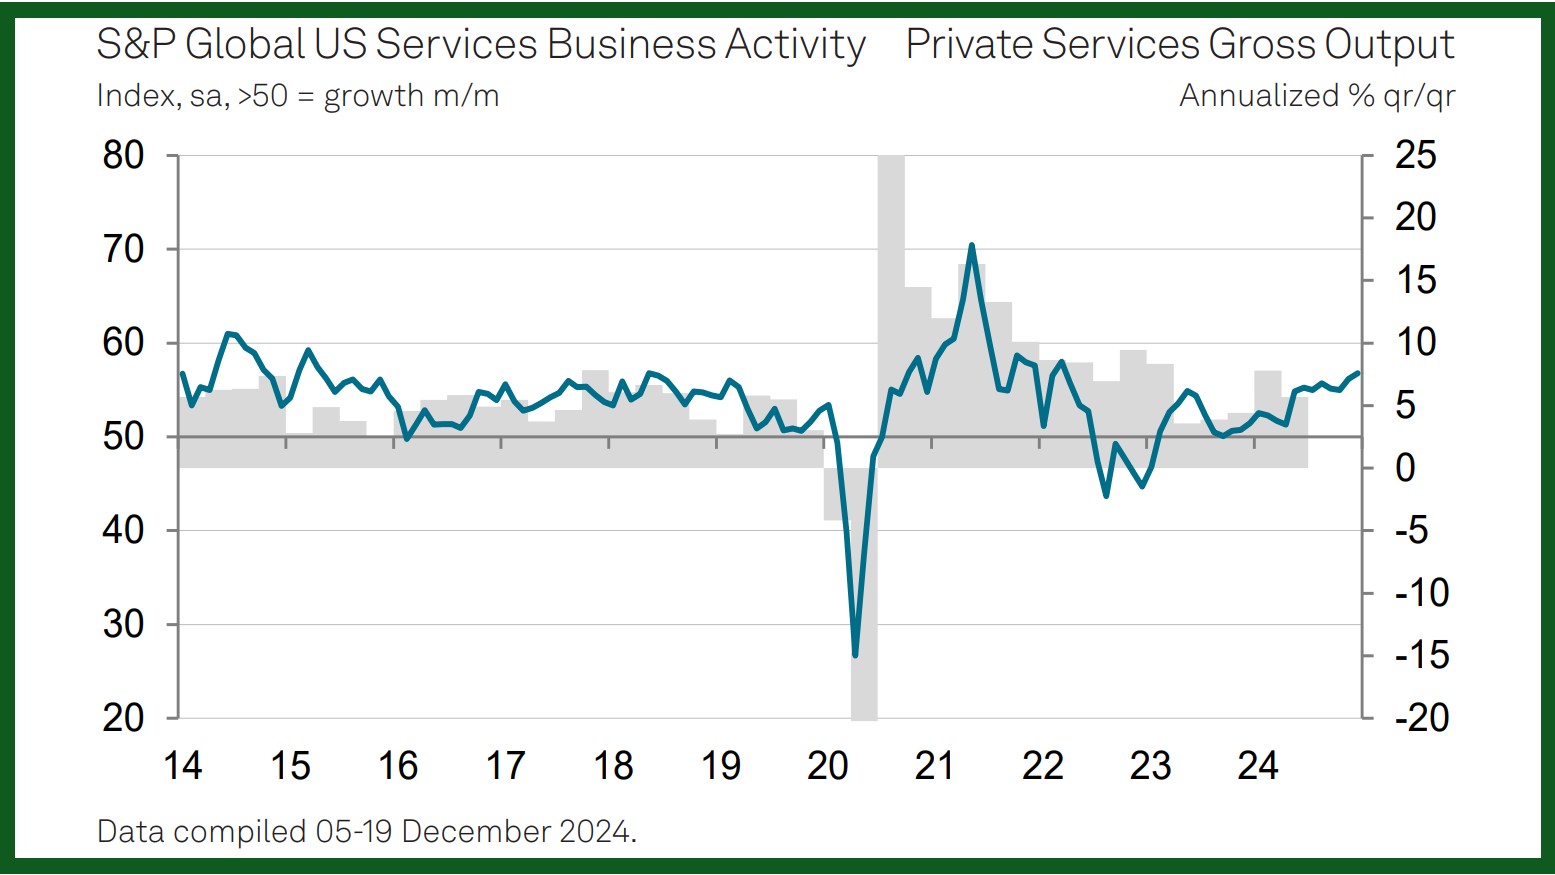
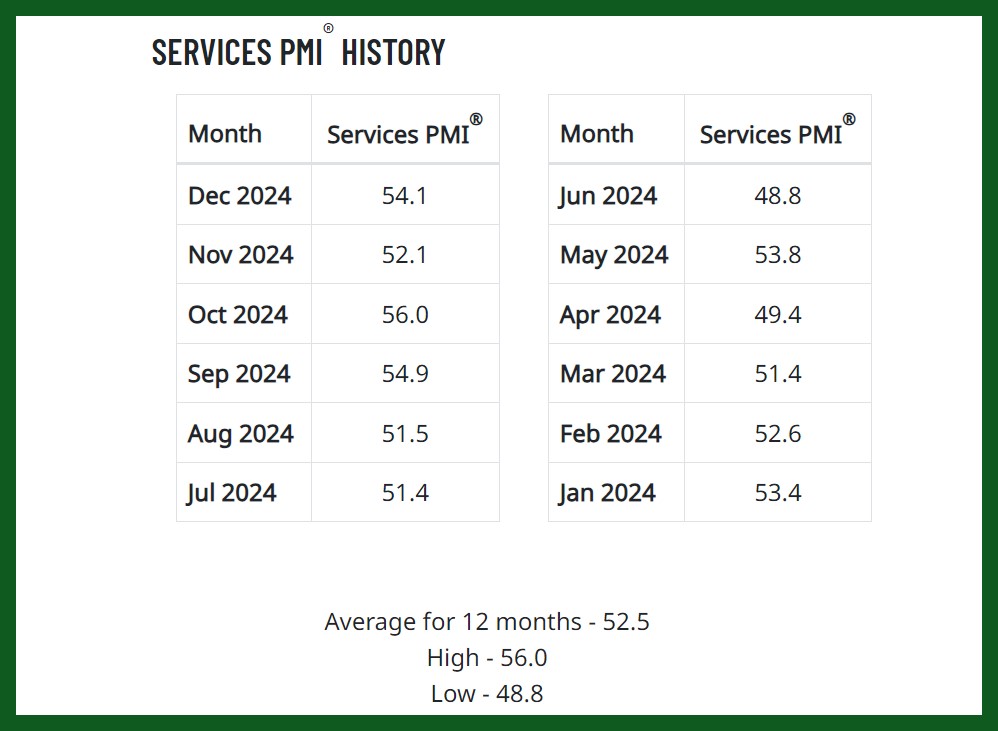
The Services PMI (Purchasing Managers’ Index) is an essential indicator of the services sector’s health, covering finance, retail, healthcare, and hospitality. A PMI above 50 signals growth, while below 50 indicates a slowdown.
Two key organizations publish these reports:
- S&P Global: This Services PMI surveys a wide range of service sector companies in the U.S. and globally. It’s known for its extensive sample size and advanced methodology, providing early and detailed business condition insights.
- Institute for Supply Management (ISM): The ISM’s Non-Manufacturing PMI includes data from purchasing and supply executives across various industries, such as construction, utilities, and government administration. This survey, with its long history, focuses more on larger companies.
Both indices are closely monitored by economists and investors for valuable information about services sector performance and trends. A PMI above 50 indicates sector expansion, while below 50 signals contraction.
December S&P Global Services PMI
In December 2024, the US services sector experienced strong growth. The Business Activity Index increased to 56.8, its highest in 33 months, showing that business activities expanded for the second month in a row. New orders grew quickly, reaching the fastest pace since March 2022, as customers were more willing to spend after the Presidential Election. Companies started hiring again for the first time in five months to handle the increased workload, and business confidence hit an 18-month high.
While the cost of doing business rose more slowly than in the past year, prices for inputs like shipping and wages still increased significantly. Overall, the services sector saw robust growth in business activity, new orders, and employment, with improved confidence about the future.

Source: spglobal
December ISM Services PMI
In December, the services sector expanded for the sixth month in a row. The Services PMI was 54.1, showing growth for the 52nd time in 55 months since the pandemic recession in June 2020.
Key Points:
- The Services PMI was 54.1, up from 52.1 in November, marking the 10th time it showed growth this year.
- Business activity was higher at 58.2, up from 53.7 in November.
- New orders increased slightly to 54.2, from 53.7 in November.
- Employment remained steady at 51.4, just a bit lower than November’s 51.5.
- Supplier deliveries were slower at 52.5, higher than 49.5 in November.
Industry Performance:
- Growth: Finance & Insurance; Arts, Entertainment & Recreation; Retail Trade; Health Care & Social Assistance; Transportation & Warehousing; Public Administration; Accommodation & Food Services; Wholesale Trade; and Utilities.
- Contraction: Real Estate, Rental & Leasing; Educational Services; Agriculture, Forestry, Fishing & Hunting; Professional, Scientific & Technical Services; Information; and Management of Companies & Support Services.
In December, the main drivers for growth were business activity and supplier deliveries. Many industries were preparing for the new year and managing risks from potential tariffs and port strikes. There was general optimism across many industries, but concerns about tariffs were frequently mentioned.
Source: ISM
Impacts of Report on Stock Market
The ISM Services Report and the S&P Global Services Report can have significant impacts on the stock market because they provide insights into the health of the services sector, which is a major component of the economy. These reports are considered leading indicators of economic health. Strong reports can signal a robust economy, encouraging investment in stocks. Also, these positive reports indicating growth in business activity, can boost investor confidence, leading to a rise in stock prices.


