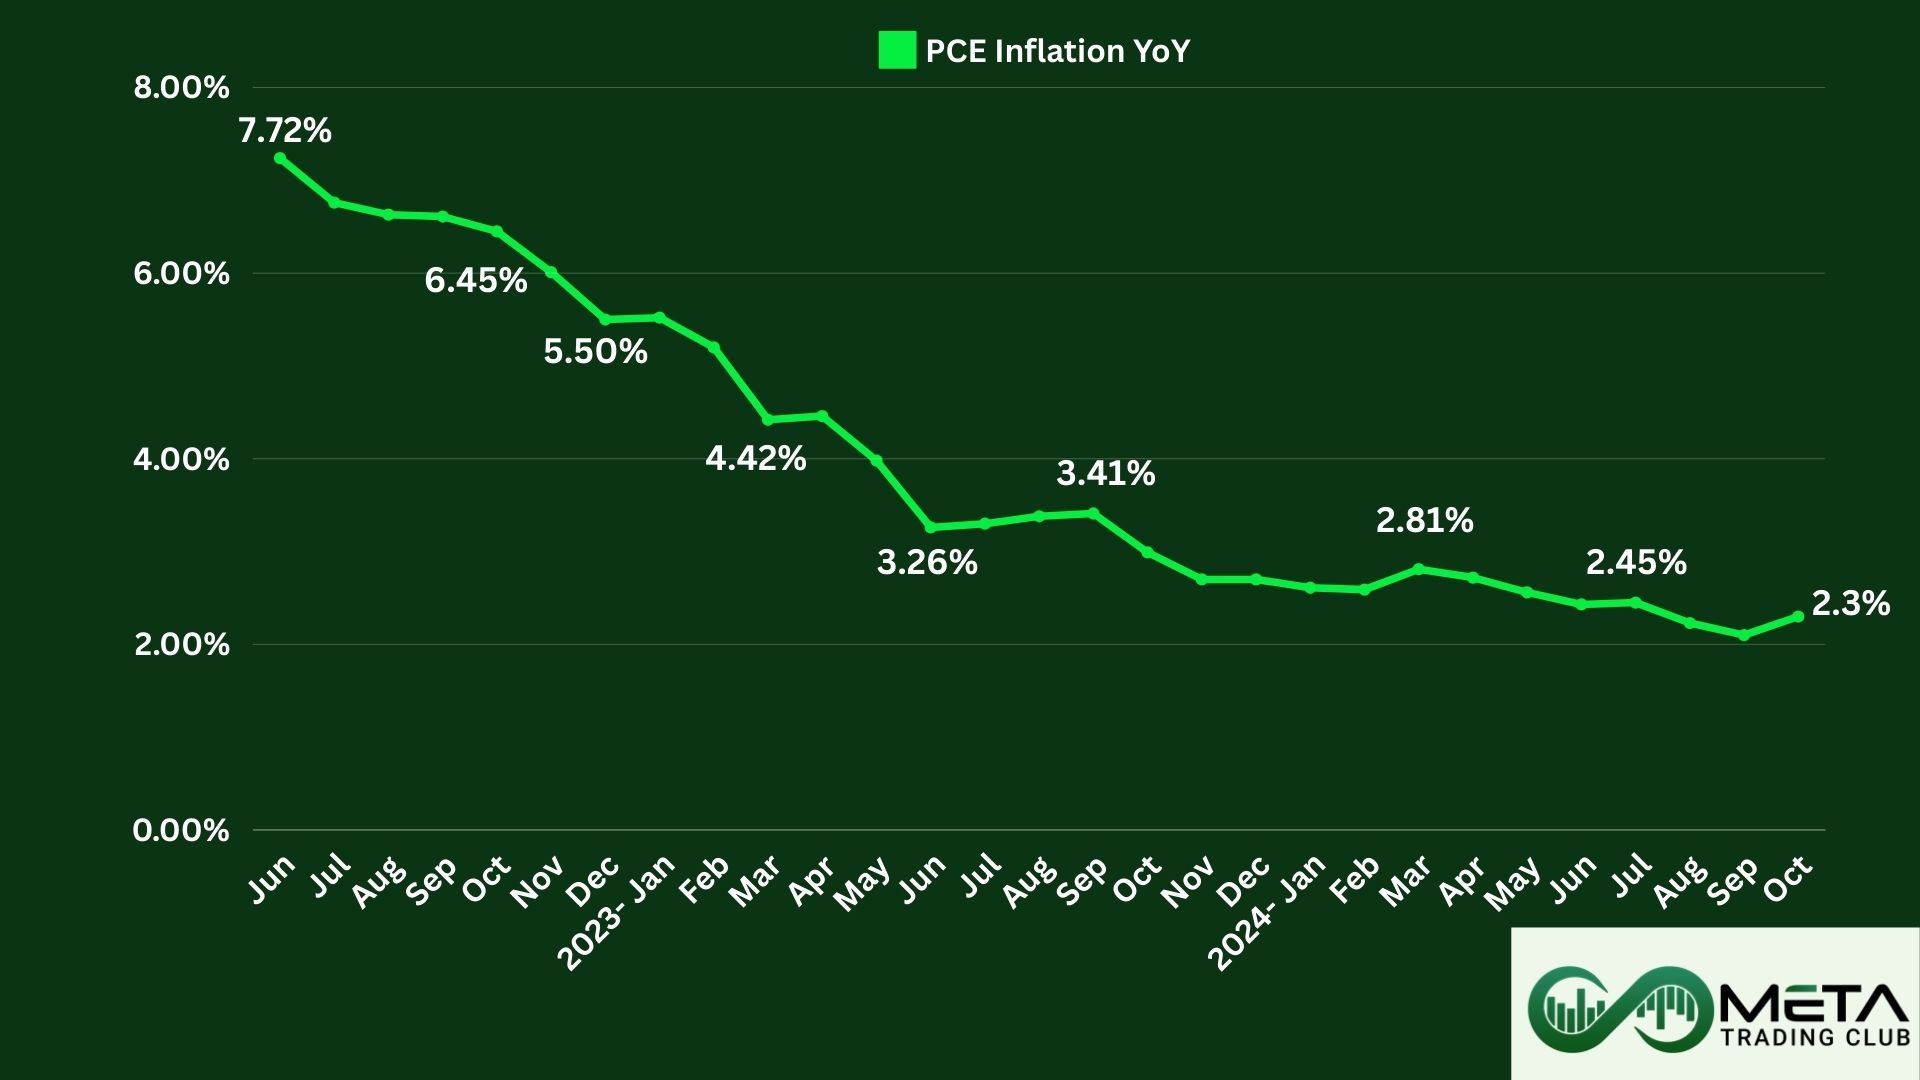
The Personal Consumption Expenditures (PCE) Price Index is a key inflation gauge used by the Federal Reserve to assess the prices of goods and services consumed by households. Unlike the Consumer Price Index (CPI), the PCE adjusts for changing consumer behavior, reflecting how people shift spending as prices change. The core PCE, which excludes volatile food and energy prices, is especially watched by policymakers to understand underlying inflation trends. It’s considered a comprehensive measure of inflation and guides decisions on interest rates and monetary policy.
October PCE Price Index
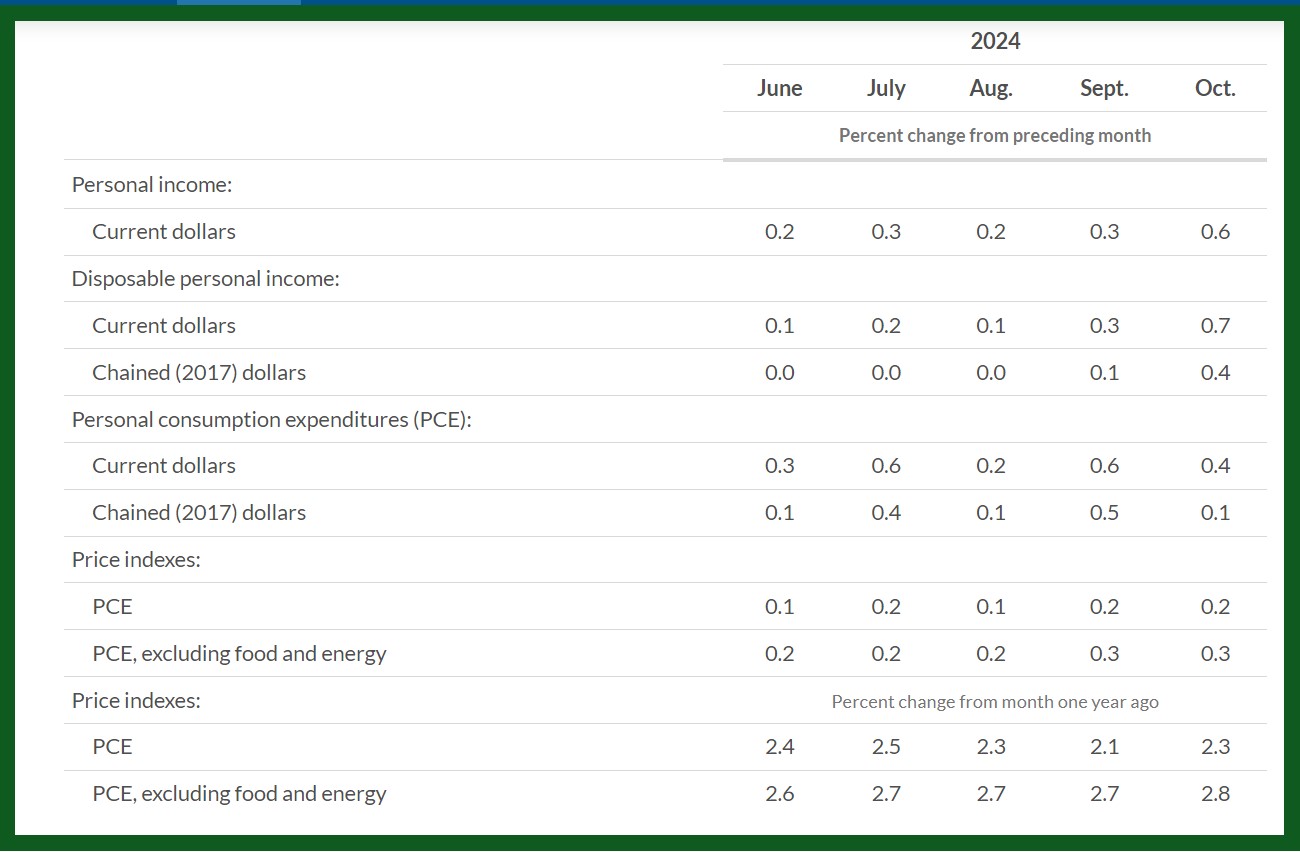
In October, the overall PCE price index increased by 0.2%, with the core PCE price index, which excludes food and energy, rising by 0.3%.
This growth reflects varied trends within goods and services: while goods prices decreased by 0.1%, service prices rose by 0.4%. Food prices remained relatively stable with a minor increase of 0.1%, and energy prices fell by 0.1%.
Examining year-over-year changes, the PCE price index rose by 2.3% over the previous year. The core PCE, excluding food and energy, increased by 2.8% year-over-year, highlighting persistent underlying inflationary pressures.
These figures provide a comprehensive look at the price dynamics impacting consumers, indicating moderate inflation trends driven by sector-specific variations in goods and services.
source: U.S. Bureau of Economic Analysis (BEA)
In October, real Personal Consumption Expenditures (PCE) increased by 0.1%. This slight rise reflects varied spending patterns in goods and services. Specifically, goods spending saw marginal growth of less than 0.1%, with recreational goods and vehicles being the primary contributors. Meanwhile, services spending increased by 0.2%, driven mainly by health care services, which included significant contributions from hospitals and outpatient services.
These changes indicate a modest but positive shift in consumer spending, highlighting the ongoing importance of both goods and services sectors to overall economic health.
Personal Income October 2024
In recent months, personal savings and outlays have shown significant changes. Personal outlays increased by $69.8 billion, primarily driven by higher Personal Consumption Expenditures (PCE) and interest payments.
Meanwhile, personal savings declined to $962.7 billion, with the personal saving rate falling to 4.4% from 4.6% in September. This indicates a continued reliance on income to support consumption.
Personal income growth was noteworthy, primarily driven by increases in compensation, personal income receipts on assets, and personal current transfer receipts. This marked the largest monthly growth in personal income since June 2024, reflecting a strong economic environment.
Disposable Personal Income (DPI) also saw an uptick, increasing by 0.7% in nominal terms. When adjusted for inflation, real DPI grew by 0.4%, indicating that individuals had more income at their disposal even after accounting for inflationary pressures. These trends highlight the dynamic interplay between income, saving, and spending in the current economic climate.
Impacts of October PCE Data
The October 2024 data reflects an acceleration in personal income growth, driven by increases in compensation and asset-related income. While PCE growth moderated compared to September, spending on services, particularly health care and housing, remained robust.
Also, inflation remained subdued, with the PCE price index rising by 0.2% monthly and 2.3% annually. However, declining personal savings and reduced spending on goods like gasoline highlight potential areas of consumer adjustment. The economic indicators signal a mixed but resilient consumer environment heading into the year’s final months.


