

Buying Call Options Payoff
- Underlying: AAPL (Apple Inc.)
- Type: Call Option
- Exercise Price (Strike Price): $150
- Expiry Date: 25th April (30 days until expiration)
- Market Price of Call Option (Premium): $5
When you purchase this call option, you pay the market price or premium of $5 to the option seller. This call option entitles you to purchase AAPL shares at the exercise price of $150. To achieve a profit, AAPL shares must trade above the break-even price, which includes the exercise price and premium paid.
Calculating the Break-Even Price
- Break-Even Price = Exercise Price + Option Premium
- Break-Even Price = $150 + $5 = $155
To break even, AAPL shares must be trading above $155. If AAPL falls below $155, the option will not be profitable to exercise, and you will lose the premium you paid ($5). If AAPL shares trade over $155, the option becomes lucrative.
Profit Potential
Unlimited Profit Potential: A long call option has a limitless profit potential because there is no limit to how high the stock price can increase before the expiration date.
Maximum Loss: The maximum loss is the premium you pay for the option, which is $5 per share. This loss occurs if AAPL falls below $155 by the expiration date and you choose not to exercise the option.
Option Payoff at Expiration Graph
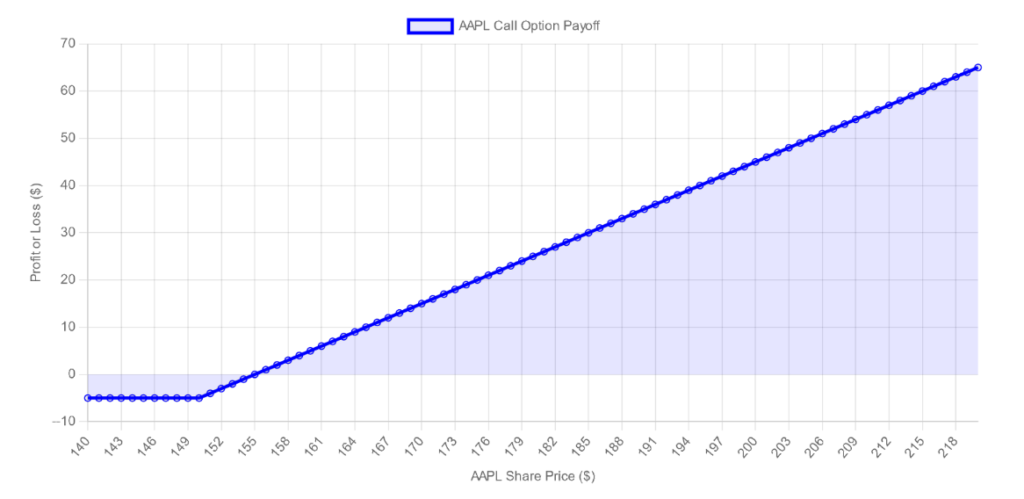
In the graph we can see the x-axis representing AAPL’s share price movement and the y-axis showing your profit or loss. The payoff for this option position is represented by a blue line.
Below the break-even point ($155), the vertical distance between the zero profit line and the blue line reflects your maximum loss, which is equal to the premium paid ($5).
The blue line rises above the break-even mark ($155), showing that your profit rises in tandem with the share price of Apple. For example, if AAPL’s share price is $200 at expiration, your profit will be $200 – $155 = $45 per share, minus the premium paid, for a net profit of $40 per share.
Selling Call Options Payoff
- Underlying: AAPL (Apple Inc.)
- Type: Short Call Option (Sold/Written Call Option)
- Strike Price: $150
- Option Premium Received: $5
As the seller of the call option, you receive a $5 upfront premium. This premium is your maximum profit if AAPL’s stock price remains below $150 at expiration. Above this price, the buyer of the call may execute the option, forcing you to sell AAPL shares for $150, potentially at a loss if the market price rises.
Payoff Profile
Maximum Profit: The premium earned, $5 per share, is realized if the AAPL stock price falls below the $150 strike price at expiration.
Breakeven Point: The strike price plus the premium received. For you, $150 + $5 equals $155. This is the stock price at which your premium profit is less than the cost of purchasing the stock at market price and delivering it to the option buyer.
Loss Potential: Losses begin to accrue once the balance exceeds $155. Losses increase if the stock price rises above $155, and there is no limit to how high a stock price can rise.
Short Call at Expiration Graph
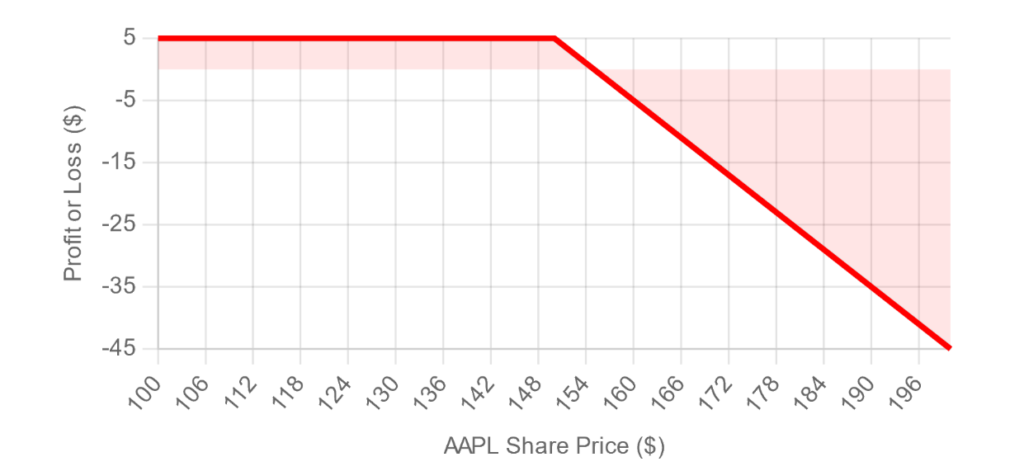
The x-axis shows AAPL’s share price at expiration. The y-axis indicates profit or loss in dollars. A horizontal line at $5 depicts the maximum profit if AAPL remains under $150. As the stock price rises above $150, the line slopes downward, indicating further losses. At the break-even mark ($155), the slope of the line steepens as losses compound with rising AAPL share prices. For example, if AAPL’s stock price climbs to $170 at expiration, you’d have to buy the stock at $170 and sell it to the option holder for $150, resulting in a $20 loss per share, minus the $5 premium paid, equivalent to a net loss of $15 per share.
Buying Put Option Payoff
- Underlying: AAPL (Apple Inc.)
- Type: Put Option
- Exercise Price (Strike Price): $150
- Expiry Date: 25th April (30 days until expiration)
- Market Price of Put Option (Premium): $5
When you purchase this put option, you pay the market price or premium of $5 to the option seller. This put option entitles you to sell AAPL shares at the exercise price of $150. To achieve a profit, AAPL shares must trade below the break-even price, which includes the exercise price minus the premium paid.
Calculating the Break-Even Price: The Break-Even Price equals Exercise Price minus Option Premium Break-Even Price which is $150 – $5 = $145. To break even, AAPL shares must be trading below $145. If AAPL trades above $145, the option will not be profitable to exercise, and you will lose the premium you paid ($5). If AAPL shares trade below $145, the option becomes lucrative.
Profit Potential Maximum Profit: A long put option has significant profit potential as the stock price can theoretically decrease to zero. The lower the stock price goes below the break-even point before the expiration, the higher the profit.
Maximum Loss Limited Risk: The maximum loss is the premium you pay for the option, which is $5 per share. This loss occurs if AAPL trades above $145 by the expiration date and you choose not to exercise the option.
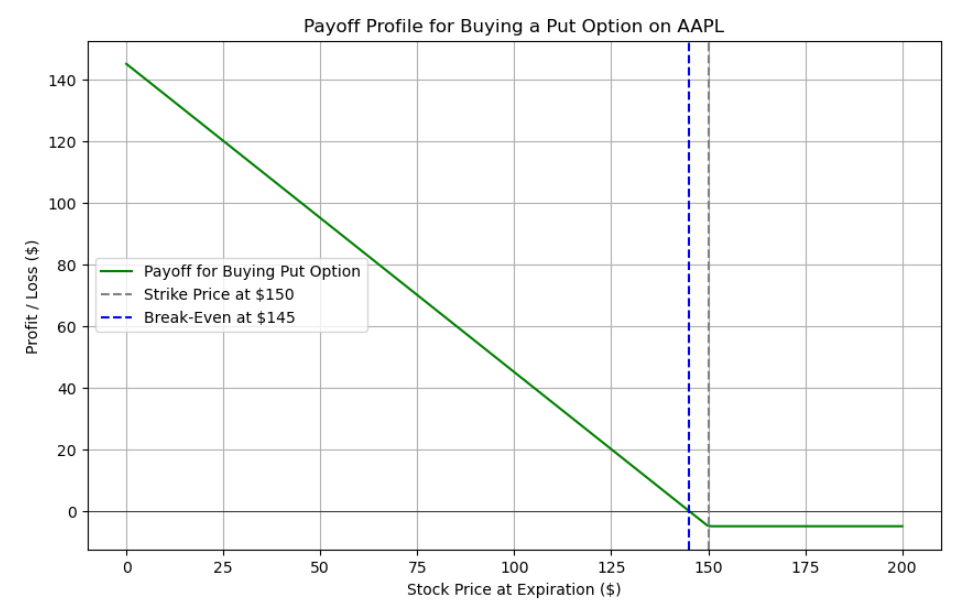
The graph shows three key points:
- Strike Price at $150 (Dashed Blue Vertical Line): This is the price at which the put option can be exercised. If the market price of AAPL is below this point at expiration, the option can be exercised for a profit.
- Break-Even at $145 (Dotted Blue Vertical Line): This is the stock price at which the holder of the put option breaks even. It is calculated by subtracting the premium paid for the option ($5) from the strike price ($150). If AAPL’s price is at $145 at expiration, the profit from exercising the option exactly equals the cost of the premium paid, resulting in a net zero profit/loss.
- Payoff for Buying Put Option (Green Line): This line represents the profit or loss for different stock prices at expiration. It is flat at -$5 above the strike price, indicating that if the stock price is above $150 at expiration, the put option will not be exercised, and the loss will be equal to the premium paid for the option. Below the break-even point, the line slopes downward, showing that as the stock price decreases, the profit increases. This continues theoretically until the stock price reaches zero, where the profit would be maximized (since AAPL cannot have a negative price, the maximum profit is when the stock price falls to $0).
In summary:
- Any price above $150: The put is not exercised, and the loss is the premium paid of $5.
- Any price below $145: The put is exercised, and the profit increases the further the stock price falls below $145.
- The maximum loss is limited to the premium paid ($5), and this occurs when the stock price is at or above the strike price.
- The profit increases without limit as the stock price falls towards zero.
Selling Put Option Payoff
- Underlying: AAPL (Apple Inc.)
- Type: Put Option (Selling)
- Exercise Price (Strike Price): $150
- Expiry Date: 25th April (30 days until expiration)
- Market Price of Put Option (Premium Received): $5
When you sell this put option, you receive the market price or premium of $5 from the option buyer. Selling a put option obligates you to purchase AAPL shares at the exercise price of $150 if the buyer decides to exercise the option. To achieve a profit, AAPL shares must trade above the break-even price.
Calculating the Break-Even Price
Break-Even Price = Exercise Price – Option Premium Received Break-Even Price = $150 – $5 = $145 To maintain profitability, AAPL shares must be trading above $145. If AAPL trades above $145, the option will expire worthless and you keep the premium received ($5). If AAPL shares trade below $145, you begin to incur losses.
Profit Potential Maximum Profit: The maximum profit is limited to the premium received from selling the put option, which is $5 per share. This profit is realized if the stock price remains above $145 at expiration, allowing the option to expire worthless.
Loss Potential Unlimited Loss: While the profit potential is capped, the loss potential is significant as the stock price can theoretically decrease to zero. The lower the stock price goes below $145, the greater the loss, as you might have to buy the stock at $150 per share, incurring losses that increase as the stock price falls.
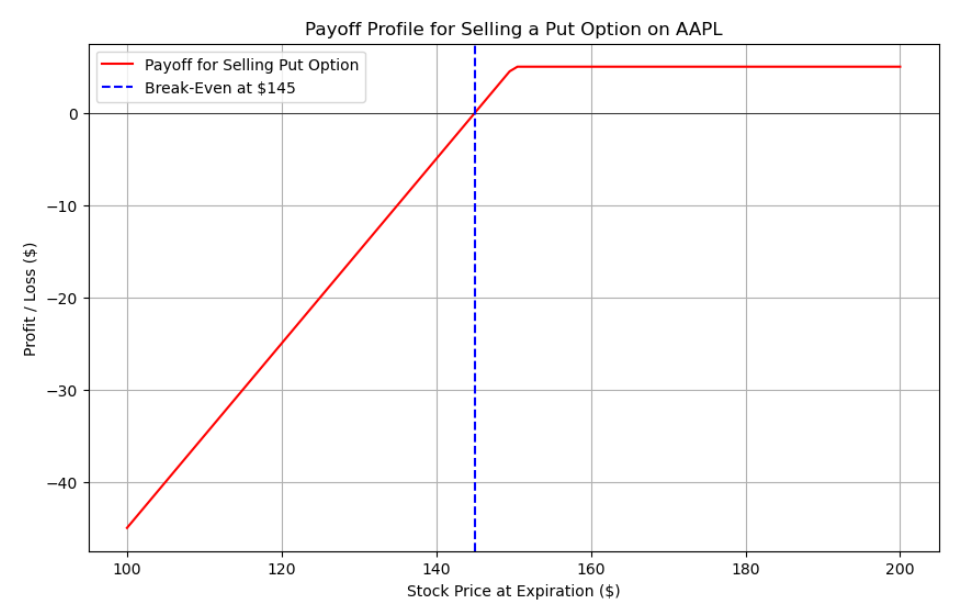
Key points of the graph:
- Break-Even at $145 (Dashed Blue Vertical Line): This line indicates the price at which the seller of the put option breaks even. It is calculated by subtracting the premium received ($5) from the strike price ($150). If AAPL’s price is exactly at $145 at expiration, the seller neither makes nor loses money.
- Payoff for Selling Put Option (Red Line):
- Flat Section (Above $150): This shows that if AAPL’s price is above the strike price of $150 at expiration, the option is not exercised, and the seller’s profit is the premium received, which is $5.
- Downward Sloping Section (Between $145 and $150): As the stock price decreases below $150 but stays above the break-even point, the profit decreases. The seller may be obligated to buy the stock at $150, incurring a loss relative to the market price.
- Horizontal Section (Below $145): Below the break-even point, the loss increases sharply. If the stock price is below $145, the seller is at a loss, which increases as the stock price decreases, because they must buy the stock at $150 (the strike price), which is higher than the market price.
In summary:
- For stock prices above $150, the seller keeps the full premium of $5, which is the maximum profit.
- The profit decreases as the stock price moves from $150 to $145.
- At any price below $145, the seller incurs a loss. This loss continues to increase as the stock price decreases, with theoretically no limit, because if the stock went to $0, the seller would still have to buy it at $150, resulting in a loss of $150 minus the $5 premium.
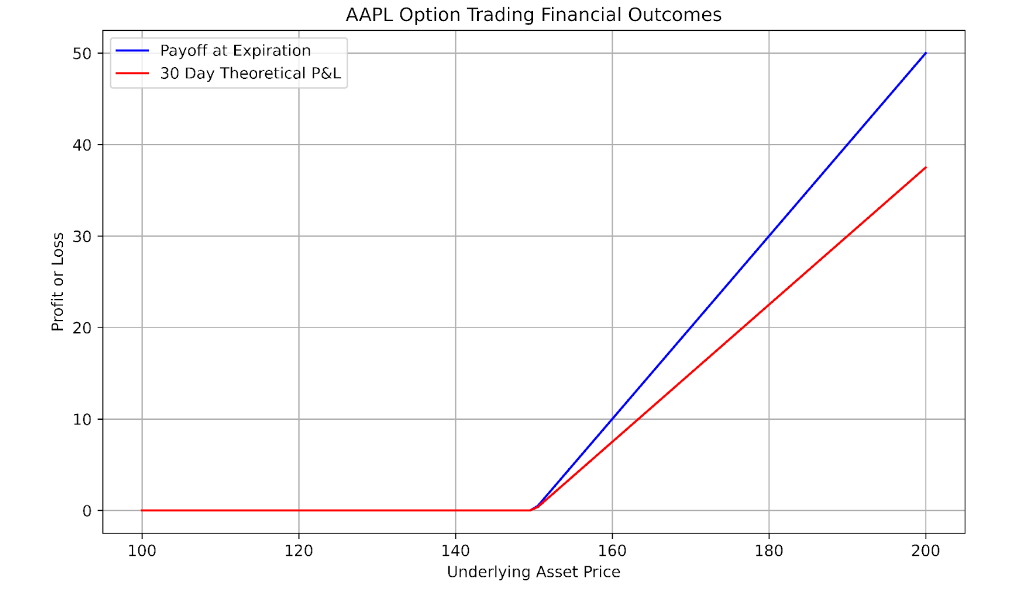
Theoretical P&L vs Payoff at Expiration
The graphs above have only looked at what an option will be worth at its expiration date. However, you will frequently see another line inside payout charts that is smooth and referred to as the theoretical P&L.
This theoretical line depicts what the option is currently worth and is calculated using a theoretical pricing model such as the Black and Scholes or Binomial Model. Given the period to expiration, the graph will show how your P&L will alter “today” if you hold this position versus the axis graphed, which is often the stock price.
Here is the same APPL call option chart now with theoretical P&L added.
Combination Payoffs
In terms of payback and profit and loss, outright calls and puts are rather simple to understand. However, payout charts are extremely useful when considering combinations of choices, i.e. when more than one leg is included in the strategy.
Take the option straddle, for example. A straddle is a combination of two options: a long call and a long put option with identical expiration dates and strike prices. Below is a straddle graph.
Let’s start by fetching the historical stock price data for AAPL. We’ll use the Yahoo Finance library for this purpose.
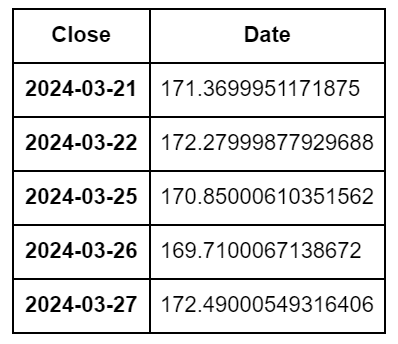
The historical closing prices for AAPL (Apple Inc.) during the previous few days are given here, with the most recent closing price of $172.49 on March 27, 2024. We’ll use this information to simulate a straddle strategy for this date.
To calculate and plot the payoff graph for a straddle strategy, we’ll make the following assumptions:
- Strike price: $170 (close to the current stock price)
- Call option price: $5
- Put option price: $4
- Range of stock prices to plot: $140 to $200
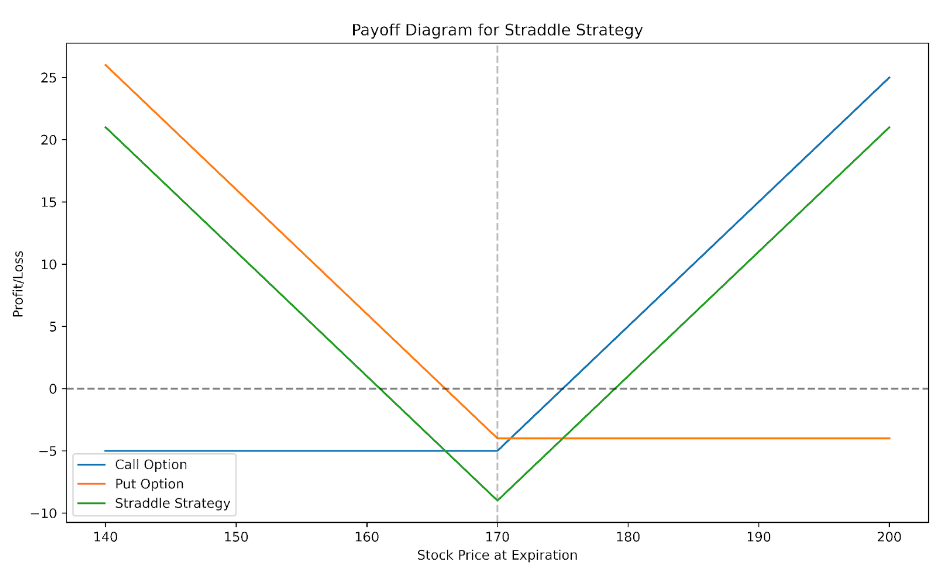
Key observations:
- The straddle method provides limitless profit potential on both the upside and downside since the reward increases linearly as the stock price moves away from the strike price in any direction.
- The maximum loss is limited to the total premium paid for the call and put options, which is achieved when the stock price at expiration equals the strike price.
- The breakeven points are reached when the stock price deviates enough from the strike price to cover the total premium paid. In this case, the breakeven points are about $161 and $179.
This method is frequently employed when an investor anticipates large change in the stock price but is unsure of its direction. The straddle benefits from volatility, regardless of whether the stock price goes up or down.
Meta Trading Club is a leading educational platform dedicated to teaching individuals how to trade and invest independently. Through comprehensive educational programs, personalized mentorship, and a supportive community, Meta Trading Club empowers traders to navigate financial markets with confidence and expertise.