

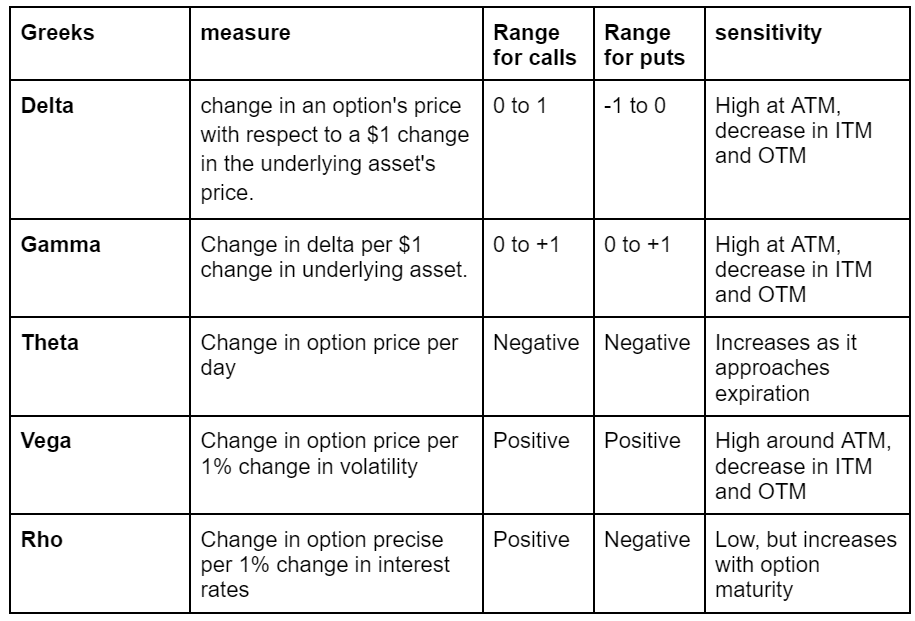
Option Greeks measure the sensitivity of an option’s price to various factors. They are essential tools for traders to manage risk and understand the potential price movement of options.
Delta (Δ): Sensitivity to Stock Price Changes
Delta measures the rate of change in an option’s price with respect to a $1 change in the underlying asset’s price. It ranges from 0 to 1 for call options and 0 to -1 for put options. Delta can be thought of as the probability that an option will expire in-the-money.
Example:
Call option
For call option on Stock X, which is currently trading at $50 per share. The call option has a strike price of $55 and is priced at $2.50 with a delta of 0.4.
If the price of Stock X increases to $51 (a $1 increase), the delta of 0.4 implies that the call option’s price would increase by 0.4 * $1 = $0.40. So, the new price of the call option would be approximately $2.90.
Call options have a positive Delta ranging from 0.00 to 1.00, typically around 0.50 for at-the-money options, increasing towards 1.00 as they move further in-the-money (ITM). As expiration nears, the Delta of ITM call options approaches 1.00, while that of out-of-the-money (OTM) options approaches 0.00.
Put option
Now, consider a put option on the same Stock X, also trading at $50 per share. This put option has a strike price of $45 and is priced at $1.75 with a delta of -0.3.
If the price of Stock X decreases to $49 (a $1 decrease), the negative delta of -0.3 indicates that the put option’s price would increase by -0.3 * -$1 = $0.30 (since the stock price movement is negative, the negative signs cancel out). The new price of the put option would be approximately $2.05.
put options have a negative Delta between 0.00 and -1.00, usually around -0.50 for at-the-money options, decreasing towards -1.00 as they go deeper ITM. The Delta of ITM put options approaches -1.00, and the Delta of OTM put options approaches 0.00 as expiration approaches.
P/L graph for the above example
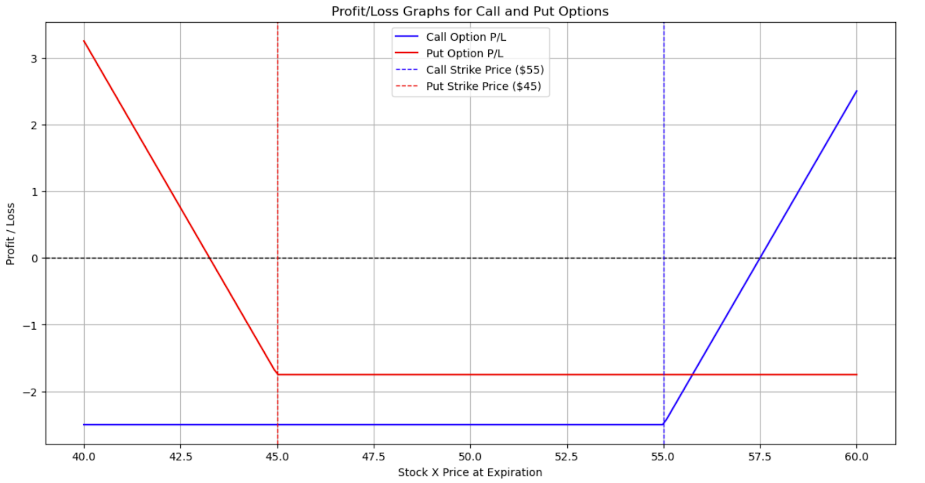
The blue line represents the P/L for the call option. You’ll observe a breakpoint at the strike price of $55, where the option starts to become profitable if the stock’s price exceeds this point by more than the premium paid.
The red line depicts the P/L for the put option. Here, the breakpoint is at the strike price of $45. The option is profitable if the stock’s price falls below this point minus the premium paid.
Gamma(Γ): Sensitivity of Delta to Stock Price Changes
Gamma indicates the rate of change in delta for a $1 change in the underlying asset’s price. It measures the stability of an option’s delta. An option with highest gamma suggests that it is at-the-money. If there is a decrease in the gamma the option is at the ITM or OTM.
Example:
Initial Scenario
- Stock Price: $100
- Option Delta (Δ): 0.5
- Option Gamma (Γ): 0.1
- Option Price: $5
If the stock price of Company XYZ increases to $101, a $1 increase.
Gamma, which is 0.1 in this case, measures the rate of change in Delta due to a $1 change in the stock’s price. Thus, when the stock price increases by $1 to $101, the Delta of the option increases by Gamma’s value (0.1).
New Delta (Δ): The new Delta becomes 0.5 (initial Delta) + 0.1 (Gamma) = 0.6. That means that for the next $1 increase in the strike price, the option’s price is expected to increase by $0.60 instead of $0.50.
Considering the initial $1 increase in stock price, the option’s price would increase by the initial Delta of 0.5 * $1 = $0.50. So, the new option price would be $5.50.
From the above example, as the stock price approaches the strike price or moves further into the money, the option becomes more sensitive to stock price movements, as indicated by the increase in Delta. This dynamic adjustment is crucial for options traders to understand to hedge their portfolios.
Gamma in Option Chain
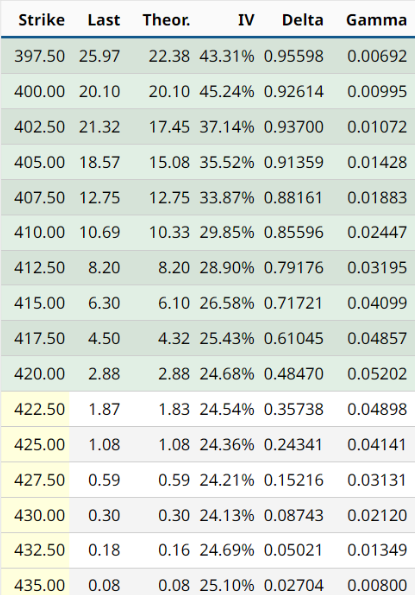
As the stock price is $420.70, which is close to the strike price of $420.00, the options around this strike price are likely to have higher Gamma values. Gamma being positive means that if the stock price were to increase by $1, the Delta of the $420.00 strike option would increase by 0.05202.
Theta(θ): Time Decay of Options
Theta quantifies the rate of decline in an option’s price as it gets near to the expiration time, also known as time decay, assuming all other factors remain constant. A high theta value means the option loses value quickly as expiration approaches. Theta is particularly important for traders managing short-term options.
Example:
- If Stock X Price: $100
- Call Option Strike Price: $105
- Call Option Premium: $5
- Days to Expiration: 30
- Theta (Θ): -0.10
The theta of -0.10, this means the option’s price is expected to decrease by $0.10 each day, assuming all other variables (like stock price and implied volatility) remain constant.
Impact of Theta After 10 Days:
After 10 days have passed, with all other factors staying the same, the option’s premium would decrease due to time decay alone. The total decrease would be 10 days * $0.10/day = $1.00.
New Option Premium: $5 – $1 = $4.
Theta in option chain
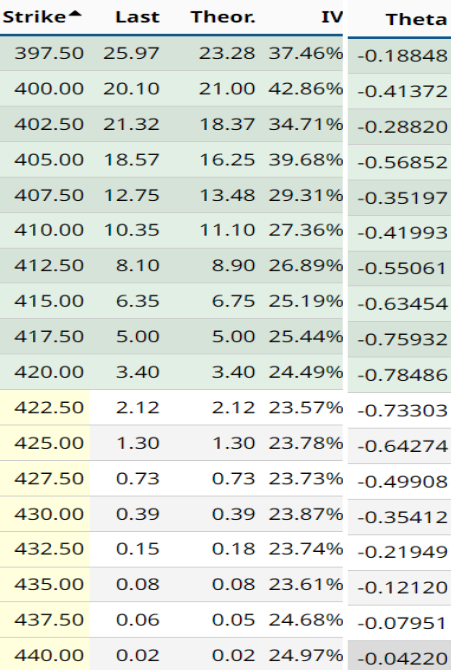
With the stock price at $420.70, the option at the $420.00 strike shows a Theta of -0.78486, indicating it loses roughly 78 cents per day. As moving away from the $420.00 strike, Theta’s absolute value decreases, indicating a slower rate of time decay for these options. For example, Theta for the $415.00 strike is -0.63454, and for the $425.00 strike is -0.64274.
Vega(ν): Sensitivity to Volatility
Vega measures the change in option price per one percentage point in the implied volatility of the underlying asset.
Vega is neutral with respect to the direction of the underlying asset’s price changes. It does not predict the direction of the price change but rather the potential magnitude of price movement.
Vega tends to be higher for options that are at-the-money and have longer times to expiration. This is because there’s more time for potential volatility, and thus more “uncertainty,” which affects the option’s price.
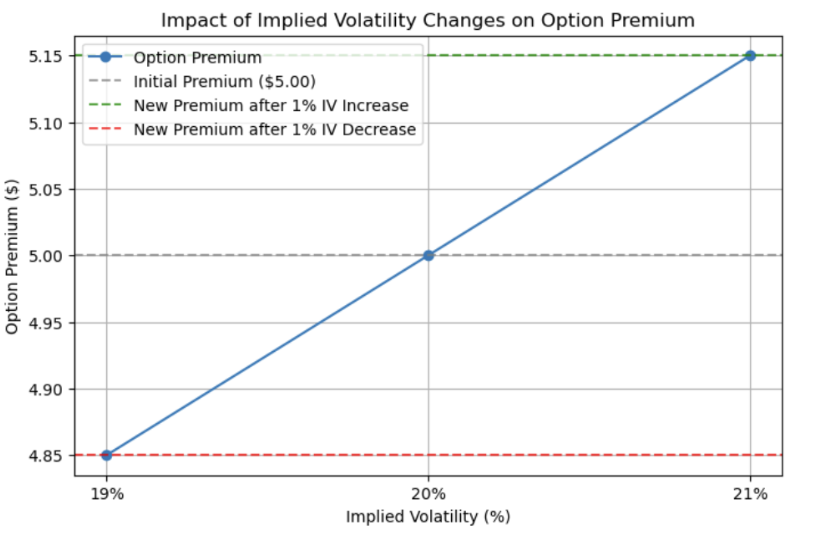
Example:
- Stock A Option Premium: $5.00
- Current Implied Volatility (IV): 20%
- Vega Value: 0.15
If the Implied Volatility ticks up from 20% to 21%, a one percentage point shift, we apply the Vega:
- New Option Premium = $5.00 + ($0.15 * 1)
- New Option Premium = $5.00 + $0.15
- New Option Premium = $5.15
Conversely, if the Implied Volatility shifts downwards by one percentage point to 19%, the Vega value works similarly, but this time reducing the option’s premium:
- New Option Premium = $5.00 – ($0.15 * 1)
- New Option Premium = $5.00 – $0.15
- New Option Premium = $4.85
Options with a high Vega are more sensitive to changes in volatility and gain value for both calls and puts. Options with low Vega will not change in price much as volatility, but with gradual decrease in vega will cause the loss of value for calls and puts.
Rho(ρ): Sensitivity to Interest Rate Changes
It measures the sensitivity of an option’s price to changes in interest rates. Specifically, it represents the change in the option’s price for a one-percentage-point change in risk-free interest rates. For call options, a rise in interest rates typically leads to an increase in the price of the option, while for put options, the effect is generally the opposite.
Call Options: Generally have a positive Rho, meaning their value tends to increase with rising interest rates. This is because higher interest rates increase the cost of holding the underlying asset, which is reflected in the option premium.
Put Options: Typically have a negative Rho, implying that their value tends to decrease as interest rates rise. Lower values of the expected cost to exercise the option in the future make the put option less valuable when interest rates are higher.
Example:
A call option on Stock B with a premium of $2, a Rho of 0.05, and currently, the risk-free interest rate is 2%.
If the risk-free interest rate increases to 3%, an increase of one percentage point:
The call option’s price is expected to increase by the Rho value times the change in interest rate.
- New Option Price = Current Option Price + (Rho * Change in Interest Rate)
- New Option Price = $2 + (0.05 * 1) = $2 + $0.05 = $2.05
Conversely, if the risk-free interest rate decreases to 1%, a decrease of one percentage point:
The call option’s price is expected to decrease by the Rho value times the change in interest rate.
- New Option Price = Current Option Price – (Rho * Change in Interest Rate)
- New Option Price = $2 – (0.05 * 1) = $2 – $0.05 = $1.95
Option Chain
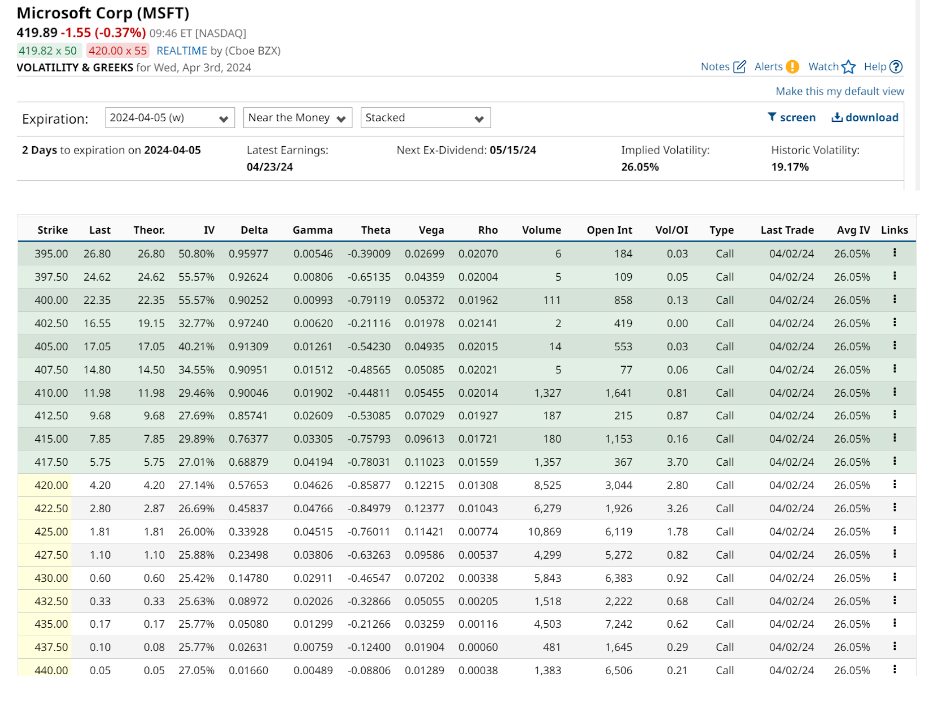
Green covered indicates In-the-money options. ITM options have intrinsic value, which is the actual profit that could be realised if the option were exercised at that moment. Yellow covers indicate at-the-money (ATM) or Out-of-the-money options. It has an extrinsic value because the underlying asset price is more than the strike price.
References:
MSFT – Microsoft Corp Stock Options Volatility & Greeks – barchart.com. (2024, April 5). Barchart.com. https://www.barchart.com/stocks/quotes/MSFT/volatility-greeks?expiration=2024-04-05-w&moneyness=10
Meta Trading Club is a leading educational platform dedicated to teaching individuals how to trade and invest independently. Through comprehensive educational programs, personalized mentorship, and a supportive community, Meta Trading Club empowers traders to navigate financial markets with confidence and expertise.