Nvidia Stock and other AI related stocks absolutely mooned with the AI bloom of Chatgpt and increasing interests in Artificial Intelligence. It seemed as if AI is a fairy dust that companies could sprinkle on their stocks to make it more lucrative to investors.
However in these last days, NVDA stock, the so-called Godfather of AI stocks, has received an unexpected beating and dragged down the whole AI and semiconductor space. Many traders and investors alike are fleeing the markets and many consider the AI hype over.
But the question that keeps cycling through many minds is whether the AI hype is just hype or of substance? In this article we will cover the latest Nvidia news and analysis and see if you should buy the dip or let it RIP.
Table of Contents
Why is the Nvidia Stock going down?
Simply put, over extension. No matter what stock it is, it’s never gonna go up forever. But why is everyone panicking? The story goes back to Super Micro Computer Inc (SMCI) and the unhealthy habit of releasing early earning reports.
Those who were accustomed to SMCI early releases were shocked to find out that the company intended to kick the habit, causing many shareholders to go short in anticipation of bad news from SMCI.
This sell off spread to Nvidia Stock and many consider it to be the initial cause of 20% price drop of NVDA shares. This might be one of the underlying causes, but it isn’t the only one.
The prices were simply too high for new investors and the sustainability of it was under question, resulting in people taking profit sooner or later. In other words, Nvidia’s stock price is naturally being corrected. But what about the AI space? Did it run out of hopium or was AI simply not practical enough?
With the price of Nvidia shares down 20%, it has affected other companies and dragged ETFs and Indexes down with it. However, It seems the AI hype is not over, as many giant tech companies are doubling down on building AI infrastructure.
One of such companies is the Japan Sakira AI, which stated that they have plans to five-fold the amount of GPU units bought from 2000 units to 10000 in the next 3 to 5 years. In fact GPUs and other processing units are in such high demand that many companies are considering coming up with their own chipsets to meet demand.
Although AI is the current big thing for tech giants in the US and it’s showing crazy bullish sentiments for the near future, it isn’t the only thing tech companies offer. The data shows that other tech markets like PC, Smart Phones, and servers are not performing well and they might hinder the performance of the Nvidia company overall.
The other factor that affects the future of Nvidia is their power hungry hardware. Nvidia GPUs though powerful, consumes an unprecedented amount of power relative to its competitors such as AMD. This might bottleneck companies’ profit margin which in turn affects earning and ultimately the stock price.
Is Nvidia a buy?
As Nvidia price falls many refer to it as a great discount and all those who are yet to jump on the hype train must do so immediately or lose the chance forever. But to what extent is this true?
Fact of the matter is that no one knows what’s gonna come next for Nvidia but we can guess some rough estimates based on the data we have at hand. The question you should ask at this point is what makes a company valuable? Is it the product? Is it the price of each share or the dividend yield it pays?
The answer is plain and simple, everything goes back to the company’s earnings. The more revenue and cash flow it generates the more valuable the company is. In the following section we will analyze Nvidia stock Price to Earning ratio (P/E) and compare Nvidia earning data to other tech giants to decide whether NVDA is a buy or not.
As of writing this article the P/E ratio of Nvidia stock is at 63 which is relatively a high number and signals the nvidia stock being overvalued. On the positive side, Nvidia’s net income has gone up 581% this year while the company debt has gone down 6.74% which is not bad for an operating expenses increase of 15.86%.
In the table below you can see a comprehensive comparison of three tech behemoths. As shown in the table below (Data provided by Stock.MVP), Nvidia clearly has performed superior to the other two.
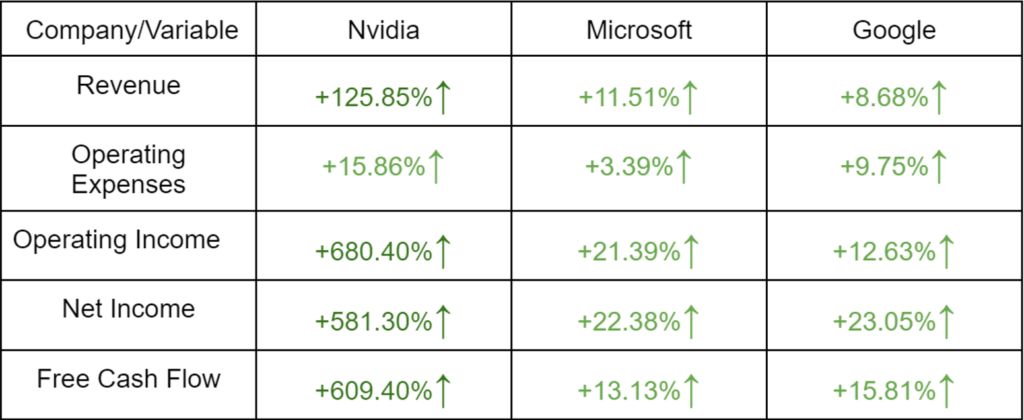
Based on the provided data, if the AI hype continues as frenzied as before, the optimistic view is another 50% increase till the next year while the conservatives estimate a 35% increase in price. In addition to earning reports, supply chain disruptions can also affect the price. TSMC stands as the heart of semiconductor stocks and the looming threat of China can result in major supply chain issues and a global price increase of nearly all AI hardware.
So the fundamentals are looking good for the future of Nvidia, but will Nvidia share owners gain more profits in another bull run?
Well, if you are keen on making consistent profits then you should consider joining Meta Trading Club Incubator and make greens regardless of the market direction. Our special offer lasts only for the next 14 days so don’t lose the opportunity to join our family of successful traders.
Fundamentals aside, we are yet to show some love to technical analysis of the Nvidia price chart. So let’s grab our classical patterns, add some indicators and jump straight into Nvidia technicals.
Nvidia Chart Technical Analysis
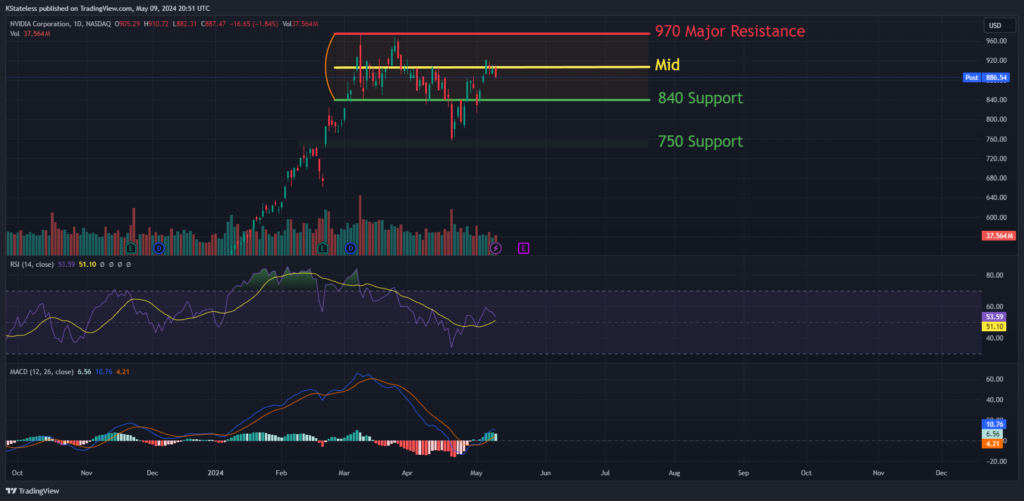
As you can clearly see in the chart, after a beautiful uptrend, price entered a distribution zone followed by a valid bearish breakout of $840 support level causing the price to fall below and turning the $840 support to a resistance level. The massive price correction is followed by a green candle forming a Fair Value Gap (FVG). With the formation of a FVG zone, another green candle was expected due to the drag force of the FVG.
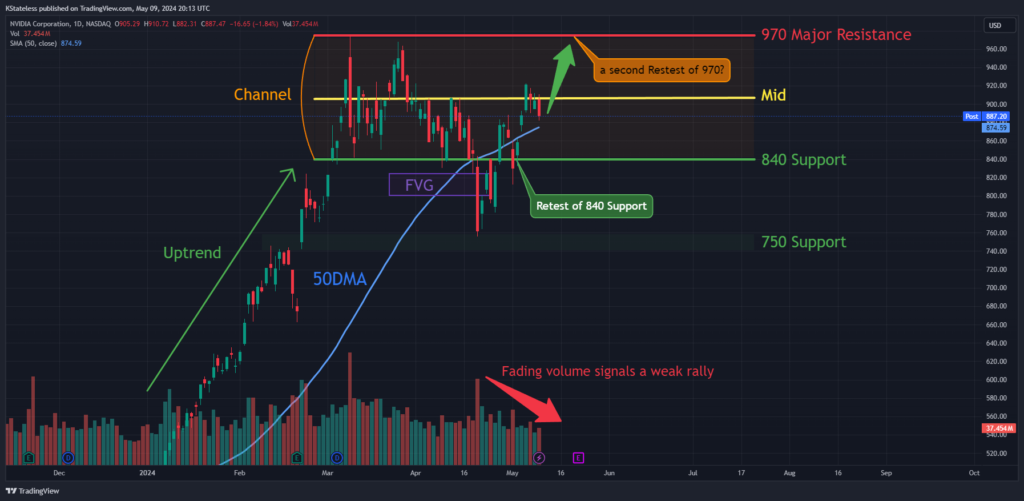
With the massive red candle neutralizing the FVG drag force, bulls began a massive march upward proving that they still have the spirit to fight for $840 support zone and keep it as theirs. Things are looking up right? Well, not really!
After a winning retest of $840 support, the price went up as expected. But there’s a catch, while the price is climbing, the volume’s dropping. That’s what we call a price-volume divergence, indicating this bullish rally might not be all that strong. With the price reaching the channle’s midline and fading volume, a second retest of $970 major resistance is at sight.
But here’s the kicker: if volume keeps tanking, it could mean investors are spooked about a big correction, steering clear of the market. And that could spell trouble, potentially sending prices crashing back down to $870 or even $750 support levels.
But what comes next? Well let’s check out what our beloved indicators have to say. The bullish coating of candles forming above the Fifty Day Moving Average (50 DMA) is losing its warmth since the volume is falling and the last red candle has reduced the distance between the candles and the 50 DMA.
As for RSI and MACD, as depicted in the image provided, both indicators are barely above average and coupled with low trading volume shows major indecisiveness in the market. Despite RSI’s recent upward breakout from its moving average following three retests, it has since tested the RSI-MA twice which shows signs of weakness in the upward momentum.
Similarly, MACD sends faint signals of buying opportunities, but if not followed by a surge in market engagement and an increase in trading volume, it might be a false signal. Let’s add Bollinger bands and Stochastic indicators to see what these two have to add to our analysis.
By adding the standard Bollinger Bands (BB), you’ll see candles forming near the upper band though closing in on the Simple Moving Average (SMA). If price continues to go downward, the Bollinger bands will converge which can be interpreted as a sign of market stagnation. Adding this stagnation to bearish price-volume divergence doesn’t paint a favorable picture for Nvidia bulls.
Things get even uglier if you add the Stochastic oscillator to the mix. While both Stoch lines are in the overbought territory, the K% is clearly below the D% line while both are about to leave the overbought zone. This sends a clear signal, more bears are joining in, pointing at the possibility of the channel midline rejecting the upward price movement.
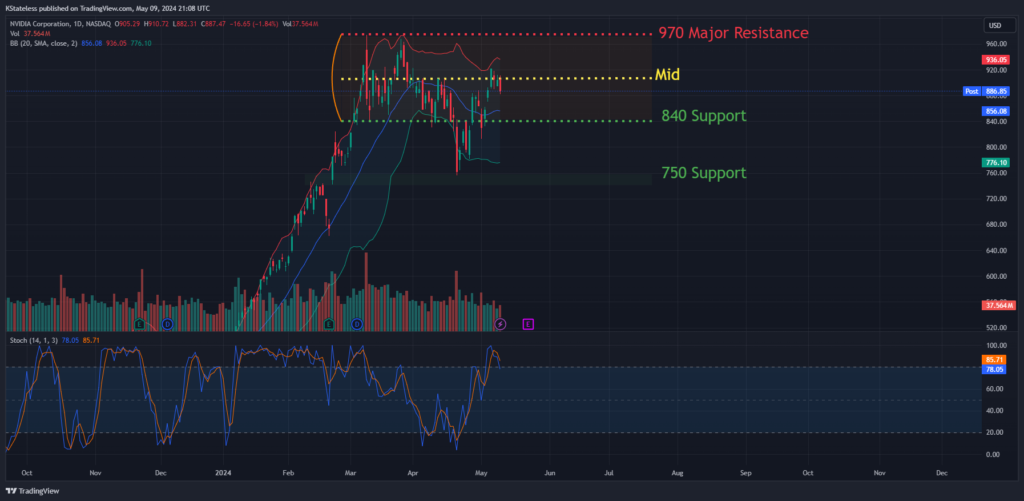
Overall, technical analysis of the Nvidia price chart shows market indecisiveness with signs of increasing bearish presence. Should bears continue to sell, panic might ensue resulting in more selloffs and a second retest of the $840 support.
Alternatively, there’s a chance that bulls could shrug off the setback, entering the market by mass and extending their rally towards the next significant resistance zone, fighting the bears around the $940 price threshold. However, for this scenario to materialize, the upward price movement must be accompanied by a rise in trading volume in the coming days.
If this market uptrend continues with more market avoidance and relatively low volume, bulls might fall into a bull trap. In such a scenario, bears could enter the market when prices are high, resulting in significant capital losses for bulls and another period of bloodshed.
Final Insights on Nvidia's Stock Performance
With the rise of AI and growing demand for chipsets, Nvidia seems to have a bright future ahead. In the last year the price of Nvidia shares has gone up nearly 500%, an unprecedented amount even in more volatile markets like the cryptocurrency market. However, with the recent panic selling of shares, Nvidia has dragged down not only the tech stocks, but many ETFs and Indexes as well.
The AI hype seems to continue as the US and other countries like Japan are doubling down on their investments to build more AI infrastructures for further AI development.
As of now it appears that many investors are shying away from NVDA stock, resulting in a drop in market participation and trading volume. There are bullish sentiments in the market, but the increasing presence of bears is casting a shadow over these positive outlooks.
However, with a more long term look, Nvidia has the potential to promote itself from the Godfather to God of all AI companies with its share price in the thousands.
If you are interested in investing in Nvidia and AI technology, we recommend Dollar Cost Average (DCA) in these rainy days and avoid timing the market. At the end of the day nobody can predict the market movement with 100% certainty and all we can make are educated guesses, as Warren Buffet says:“The only value of stock forecasters is to make fortune-tellers look good.”
If you’re keen on staying updated with stock news and trading insights, be sure to follow our Instagram accounts @Shahryartrades or @Metatradingclub, and subscribe to our YouTube channel for an edge over the competition.
FAQ
- Why is Nvidia so high?
Nvidia is one of the leading companies in the AI sphere and with the recent boom of AI technology, many investors showed interest in owning shares of the so-called Godfather of AI stocks, resulting in an upward price surge.
- Why is Nvidia stock going down?
There is much speculation regarding the recent Nvidia price correction, but many consider the Nvidia shares overvalued and its high price unsustainable. Moreover, the geopolitical threat of China and rising tensions in the Middle East can also be a factor.
- Is Nvidia a buy?
It all depends on your strategy. Fundamental analysis of the stock shows strong bullish sentiments while short term the stock is expected to continue the downtrend with occasional rebounds.
- Is Nvidia stock overvalued?
Based on the Price to Earning ratio of Nvidia Stock, it seems that the stock is currently overvalued. However, due to the hype surrounding the AI space some bulls might be willing to buy more shares at relatively high prices.
- Will Nvidia stock crash?
Many sources refer to Nvidia stock price as unsustainable and at the verge of collapse. However, the earning and growth reports of the company in 2023 shows that Nvidia still has some serious uptrend potential.

