

Multiple Time Frame Analysis
Multiple time frame Analysis is a technique that involves looking at the same security over different time frames (such as 5-minute, 30-minutes, 1-hour, 4-hour, and daily charts). This approach is mostly used by technical traders to gain better insight into the market trends of a given financial security, like JPY/USD, Tesla and Bitcoin.
By analyzing the same security in different time frames, you can gain a better understanding of the direction of the overall trend. For instance, you may observe a strong uptrend on the daily chart but spot a potential reversal on the 4-hour chart.
This type of analysis can help you to make more informed decisions and increase your chances of trading success.
What Are Time Frames?
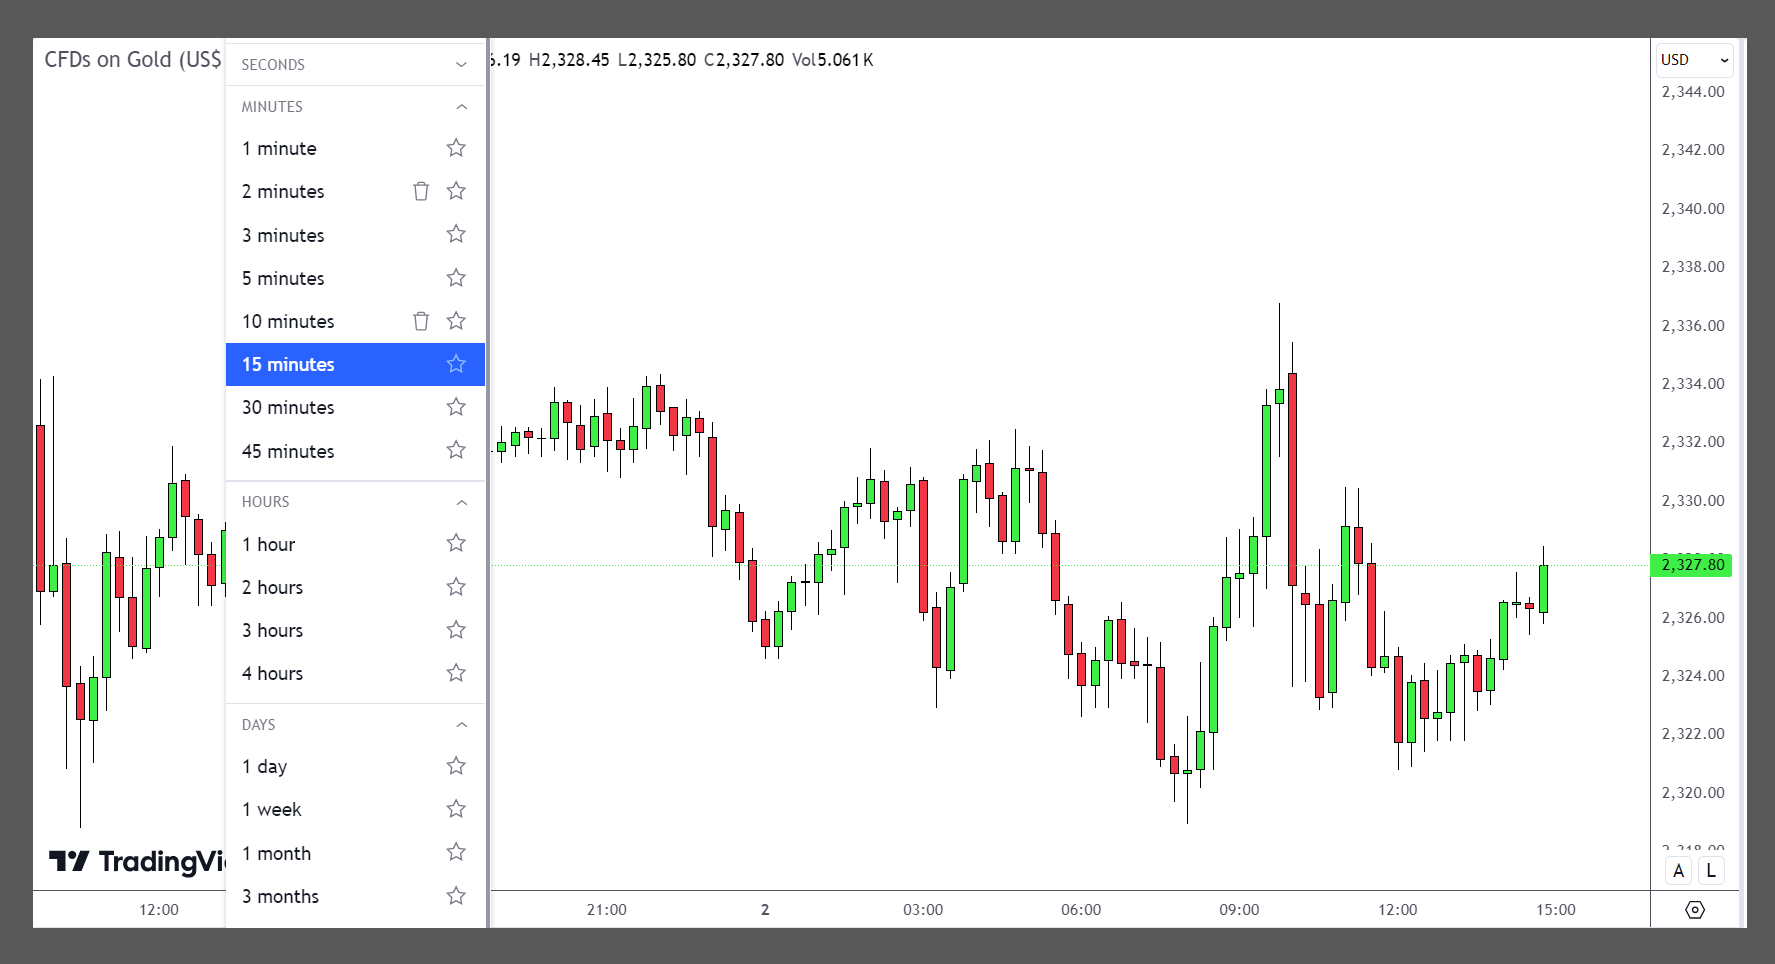
In trading charts, time frames represent the duration of time that each individual chart bar or candlestick covers. They are crucial for traders to understand and analyze market trends, price movements, and patterns. Here is a breakdown of common time frames used in trading charts:
Short-Term Time Frames:
- 1-Minute: Shows price changes every minute, suitable for scalping strategies.
- 5-Minute: Display price changes every 5 minutes and provides more detail than the 1-minute chart and is usually used by day traders.
- 15-Minute: By presenting price changes in each 15 minute interval, offers a balance between the shorter time frames and the broader perspective of longer ones.
Medium-Term Time Frames:
- 1-Hour: Useful for traders looking to hold positions for a few hours to a day (shows price changes in every hour).
- 4-Hour: Helps swing traders identify medium-term trends (demonstrate price changes in every 4 hours).
Long-Term Time Frames:
- Daily: Captures the overall trend for a day, usually used by swing traders and position traders (Present daily changes in price).
- Weekly: Provides a broader view of the market’s movement, ideal for long-term trend analysis.
- Monthly: Shows the most extended view of the market’s trends and is used for long-term investment decisions.
Traders often use multiple time frames to get a more comprehensive view of the market. For instance, a day trader might use a combination of 15-minute charts to identify short-term trends and hourly charts to understand the primary trend1. Similarly, a swing trader might use daily charts for the general trend and 4-hour charts for entry and exit points.
What is Multiple Time Frame Trading?
By doing multiple time frame analysis, you are using more than one time frame to analyze an asset’s price. For example, if trading the XAU/USD, you may be looking at the daily, 4-hour and also the 30-minute chart.
Also, when traders use multiple timeframes, they look for signals that agree across all time frames. This technique can give a good perspective of what price is doing overall. In addition, multiple time frame analysis can result in profitable market entries and exits. Hence, this type of analysis allows us to make buy-sell decisions by combining price action trends from different charts. Also, you can use multiple time frame analysis to trade successfully in Forex, Stocks, Cryptocurrencies.
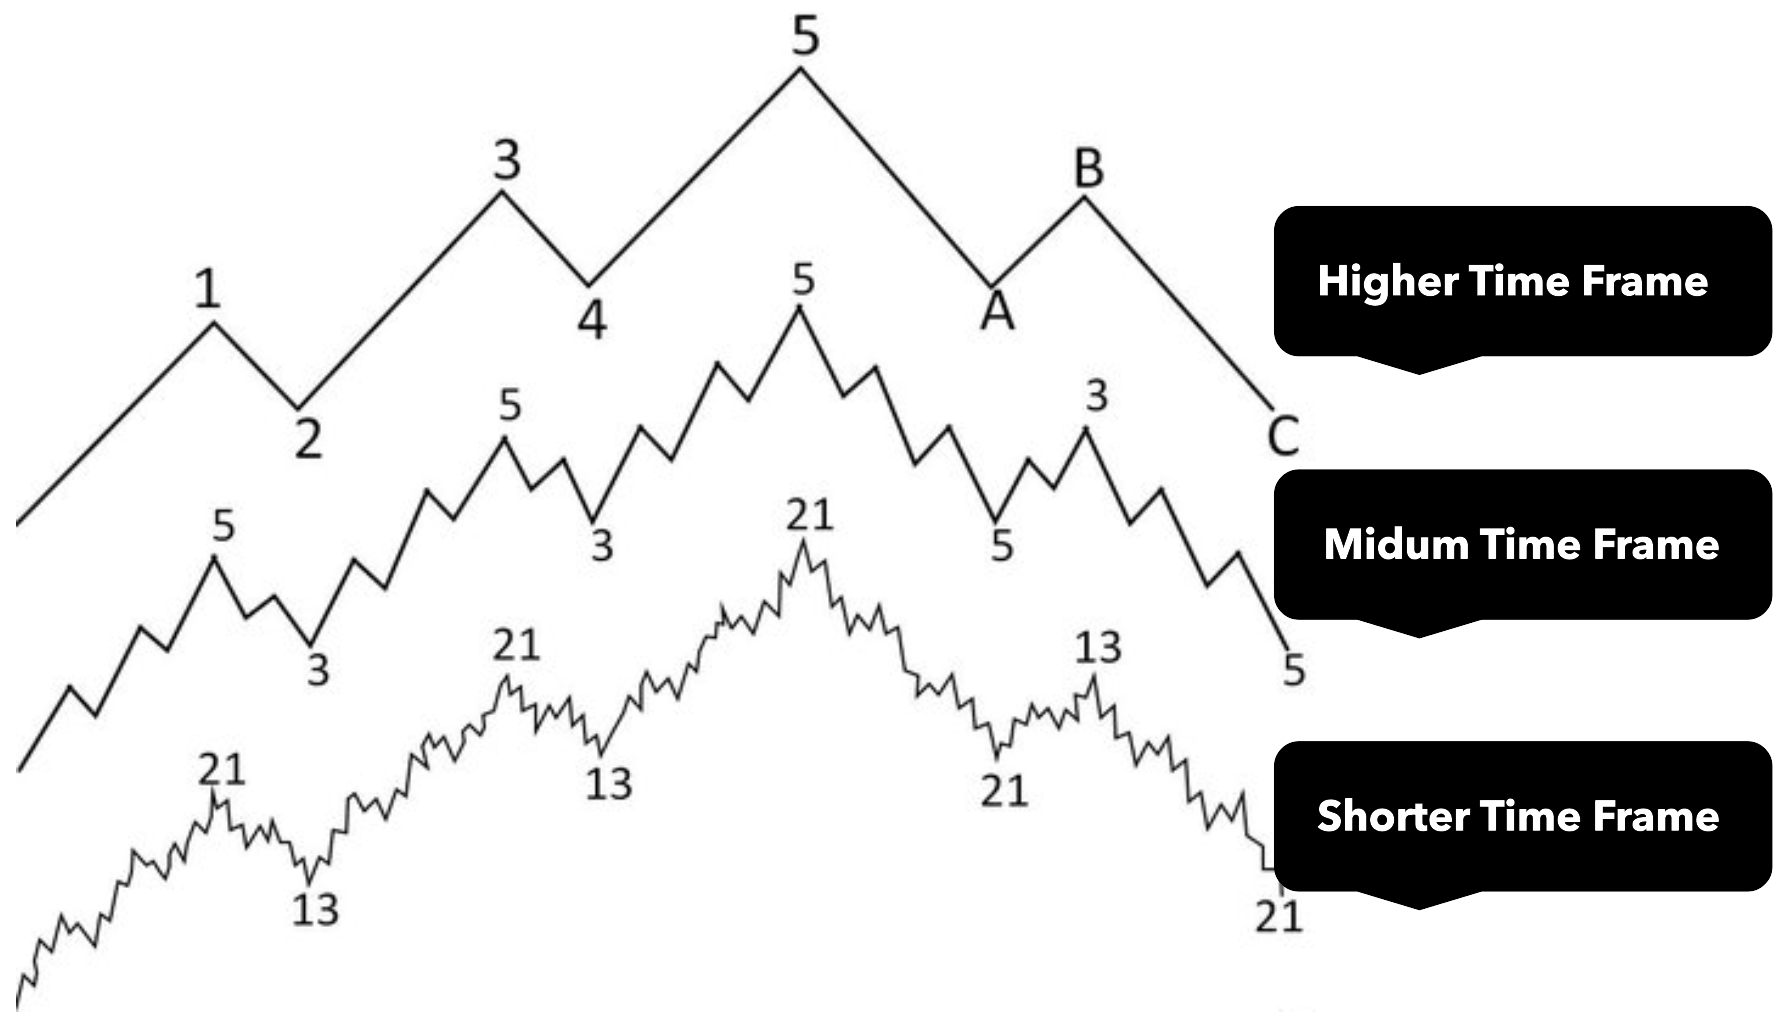
However, each time frame has its own trends and movements. The higher the time frame shows the stronger the price action and signals. However, the shorter the time frame, the more noise and false moves you will encounter.
If you can combine multiple time frames, then you can start to gain a very clear picture of exactly what the price action is doing. The principle behind using multiple time frames is that you can start to build a clearer picture of the price action and technical analysis.
For example, you may find that the higher time frames (such as the daily) are trending higher, so you begin looking for long trades. Although, in a daily time frame, your entry will not be ideal, and your stop loss will be wide. So, you could use the information you have from the daily chart and by using a smaller time frame such as the 30-minute chart to explore the ideal long trade entry. Also, you can find a tight stop loss and a much bigger potential risk to reward ratio.
Importance of Multiple Time Frame Analysis
Multi timeframe analysis is essential in trading because it provides a more comprehensive view of the market by examining different time frames simultaneously.
With using multi time frame analysis you can:
- Identifying the underlying trend: By analyzing longer time frames, you can identify the primary trend, which helps in making more informed decisions.
- Refining entries and exits: Shorter time frames can be used to refine entry and exit points, making the trading strategy more precise.
- Confirming trade hypotheses: Reviewing longer-term charts can confirm a trader’s hypotheses about market movements.
- Avoiding contradictory trends: It helps traders avoid situations where different time frames may indicate contradictory trends, which can lead to poor trading decisions. (like image below)
- Increasing success odds: Traders can greatly increase their odds for a successful trade by taking the time to analyze multiple time frames.
In essence, multi timeframe analysis allows traders to get a big picture perspective while also paying attention to short-term fluctuations, leading to a more balanced and informed trading approach. It’s a way to align trades with the overall market direction while optimizing timing for trade execution.
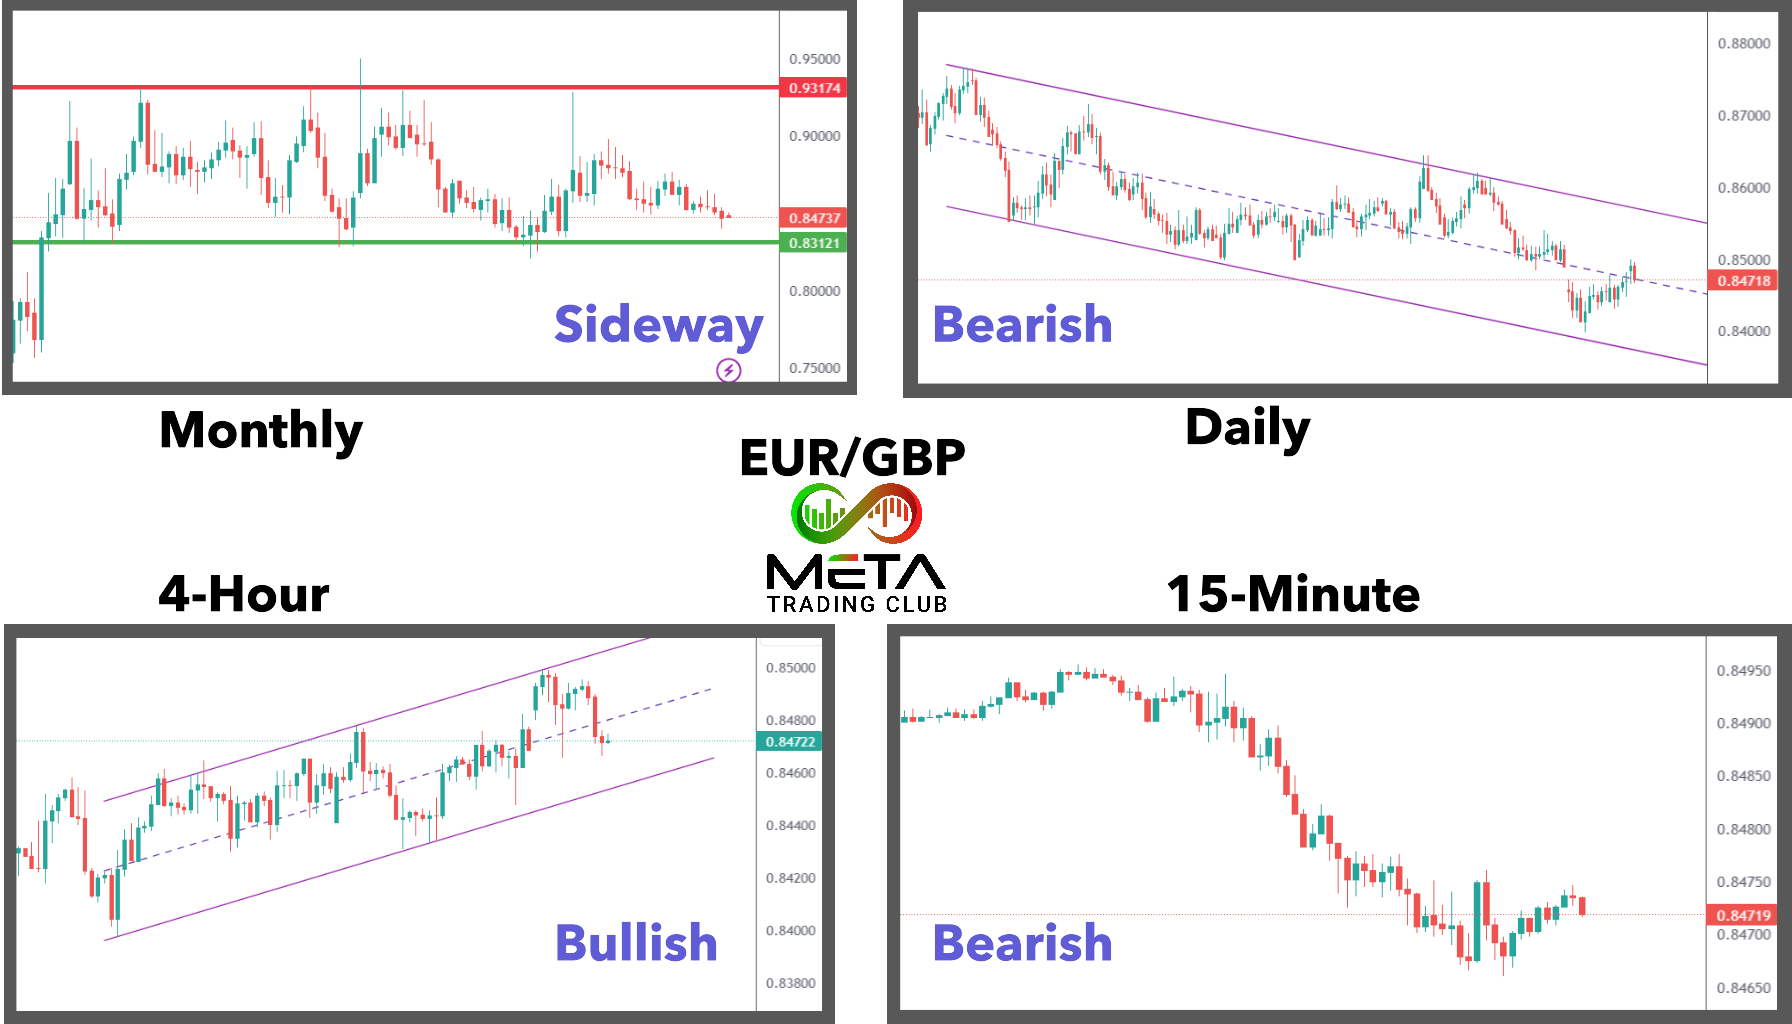
Also, the main reason that so many traders use multiple time frames in their trading is because it gives their trades a level of confirmation. When trading with one time frame only, that is all the information you have. When using multiple time frames, you start to build a really clear picture of the price story. Look at the image below which shows EUR/GBP charts in 4 time frames, each time frame shows different trends which can lead to poor trading decisions.
How to Choose The Best Time Frame?
We discussed above that sometimes different time frames may indicate contradictory trends. So, it is important to choose an appropriate time frame for your trading. Choosing the best time frame for multi timeframe analysis in trading depends on your trading style and strategy. In general, traders should select a time frame in accordance with:
- Discover your trading style: Different trading styles require different time frames. For instance, scalpers may use a 1-minute to 5-minute chart, day traders might prefer 15-minute to 1-hour charts, and swing traders could opt for 4-hour to daily charts.
- Use a higher to lower approach: Start with a higher time frame to establish the overall market trend and sentiment, then move to a lower time frame to fine-tune entry and exit points.
- Factor of 4 or 6 rule: When selecting time frames, use a factor of 4 or 6 to decide the higher and lower time frames for analysis. For instance, for the factor of 4, if your medium time frame is 1 hour, your higher time frame could be 4 hours and your lower time frame could be 15 minutes.
- Use technical analysis: Implement tools like trend lines, moving averages, and technical indicators to identify trends and signals across different time frames. If you want to enhance your technical skills, participate in our 4 weeks incubator.
- Confirm signals: Look for potential entry and exit signals in each time frame to confirm your trade hypothesis.
- Pinpoint entry and exit Levels: Identify potential entry and exit levels on the chart to manage your trades effectively.
Remember, consistency is key. Stick to your chosen time frames to gain experience and see if they fit your trading approach. It’s also important to adapt as you learn more about how different time frames interact with your trading strategy.
Example:
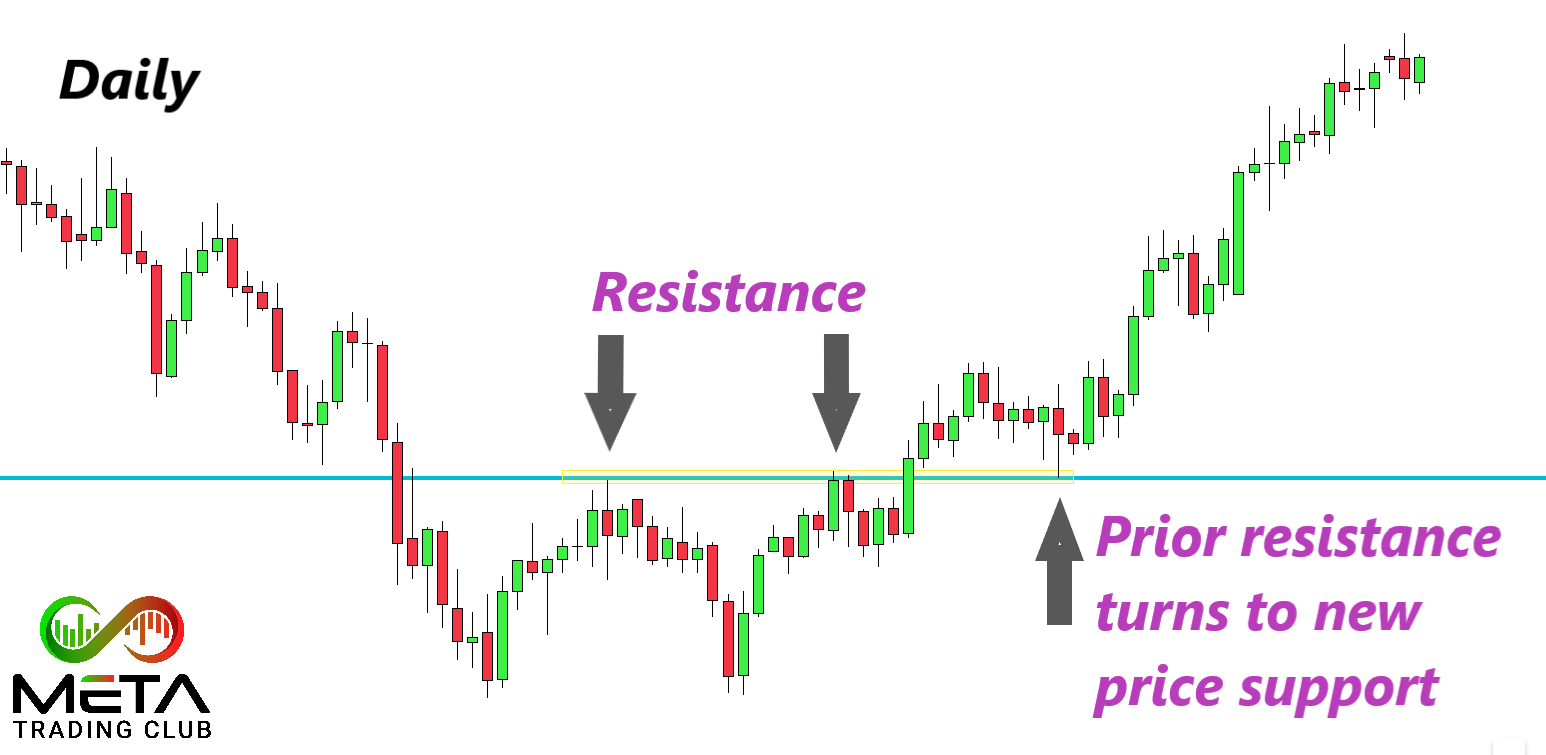
In the example below, we can see that the daily chart price is in a trend higher. We can also see that price has pulled back lower into an important support level.
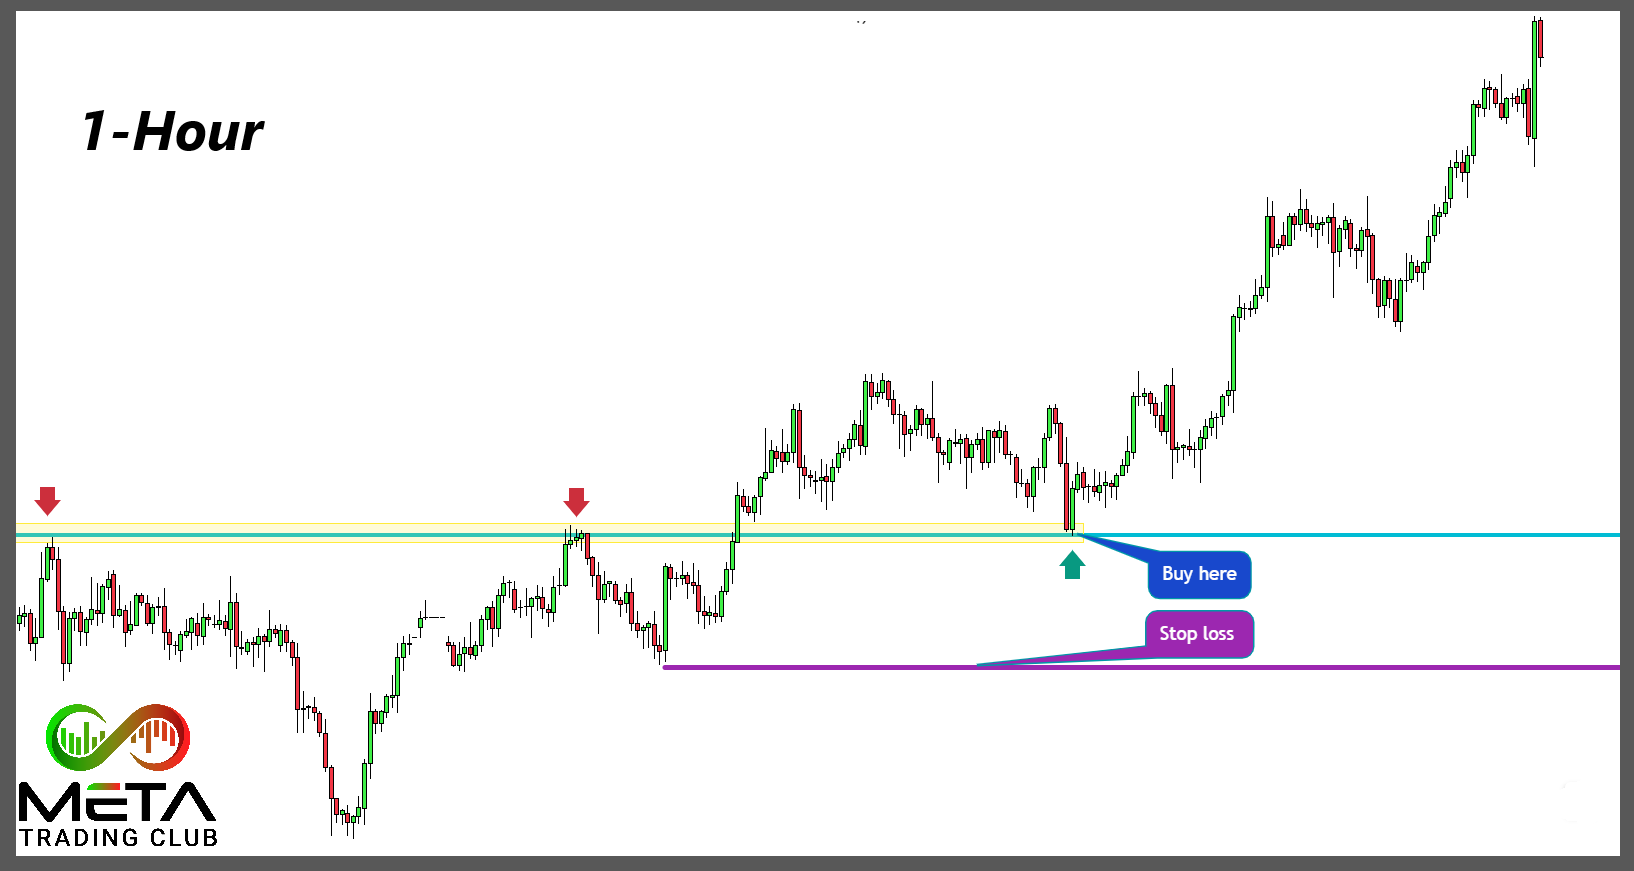
The second chart below shows the same pair; however, this is the 1-hour time frame. We could use this smaller time frame to look for a better entry signal to go long that would give us a tighter stop loss.
Analyze 3 Time Frames
Most traders when analyzing their trades over multiple time frames will use at least three time frames. By looking at at least three timeframes, they will be in a good position to confirm whether the trend is indeed forming.
The reason for this is because you normally want a higher time frame, such as the daily or weekly time frame to show you the price trend. Also, you need an intraday time frame such as the 4 hour or 1 hour time frame to demonstrate what has been happening on the intraday charts. And lastly, you want a smaller time frame to help you find the best trade entries. These time frames are normally smaller time frames like the 30 minute and 15 minute time frames.
The higher time frame, such as the daily chart, will show you a clear picture if the price is in a trend or ranging and will have fewer false signals. As you start to move to lower time frames, there will be more noise on your charts and many more false signals.
If you can combine the higher time frames with the lower time frames, you can start to get a really good idea of where the market is looking to head next. The powerful moves in the market occur when different time traders are all moving in the same direction. This is all needed to make easy money in the market.
How to Trade With Multiple Time Frames
One of the best strategies when multiple time frame trading is to trade with the higher time frame momentum and use the smaller time frames to pinpoint your entries.
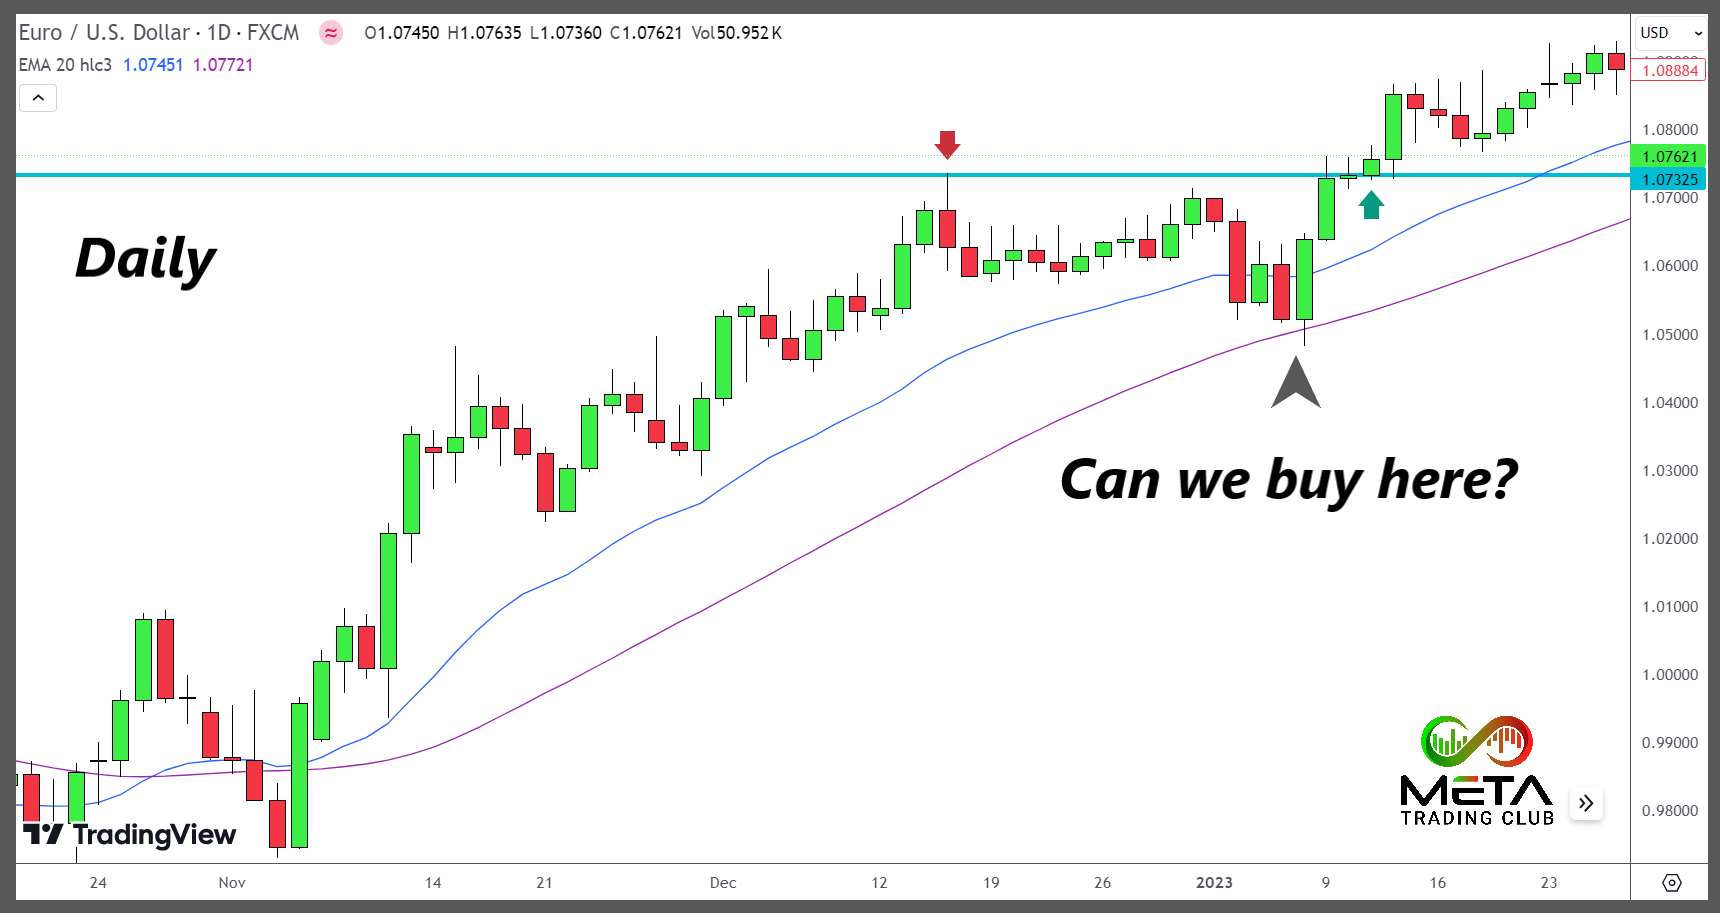
As an example, there are two charts of the Forex pair EUR/USD, the daily and 4 hours. In the daily time frame you see the price trend is bullish and it reaches a 20-day moving average. If you have a bullish opinion about the future trend of the market, will you buy here at 1.048? To answer this question, you should look at the lower time frames.
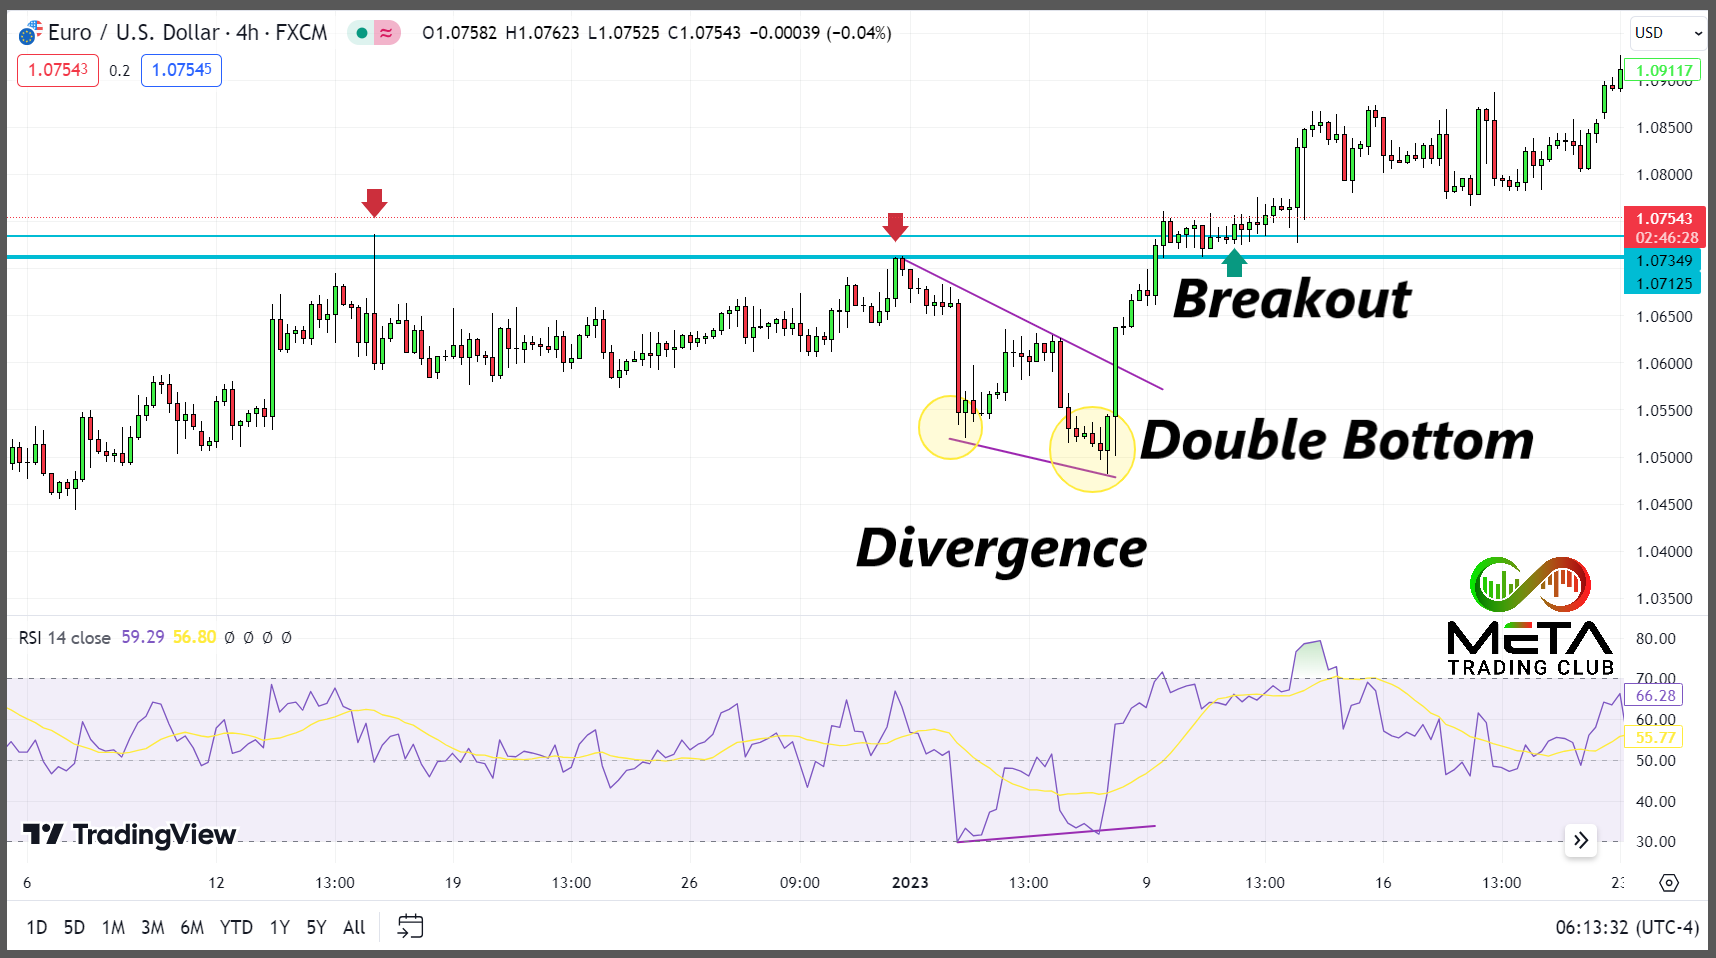
By looking at the 4-hour chart, you can find out more information about the price. There is a divergence between price and RSI indicator at the price you are questioned about.
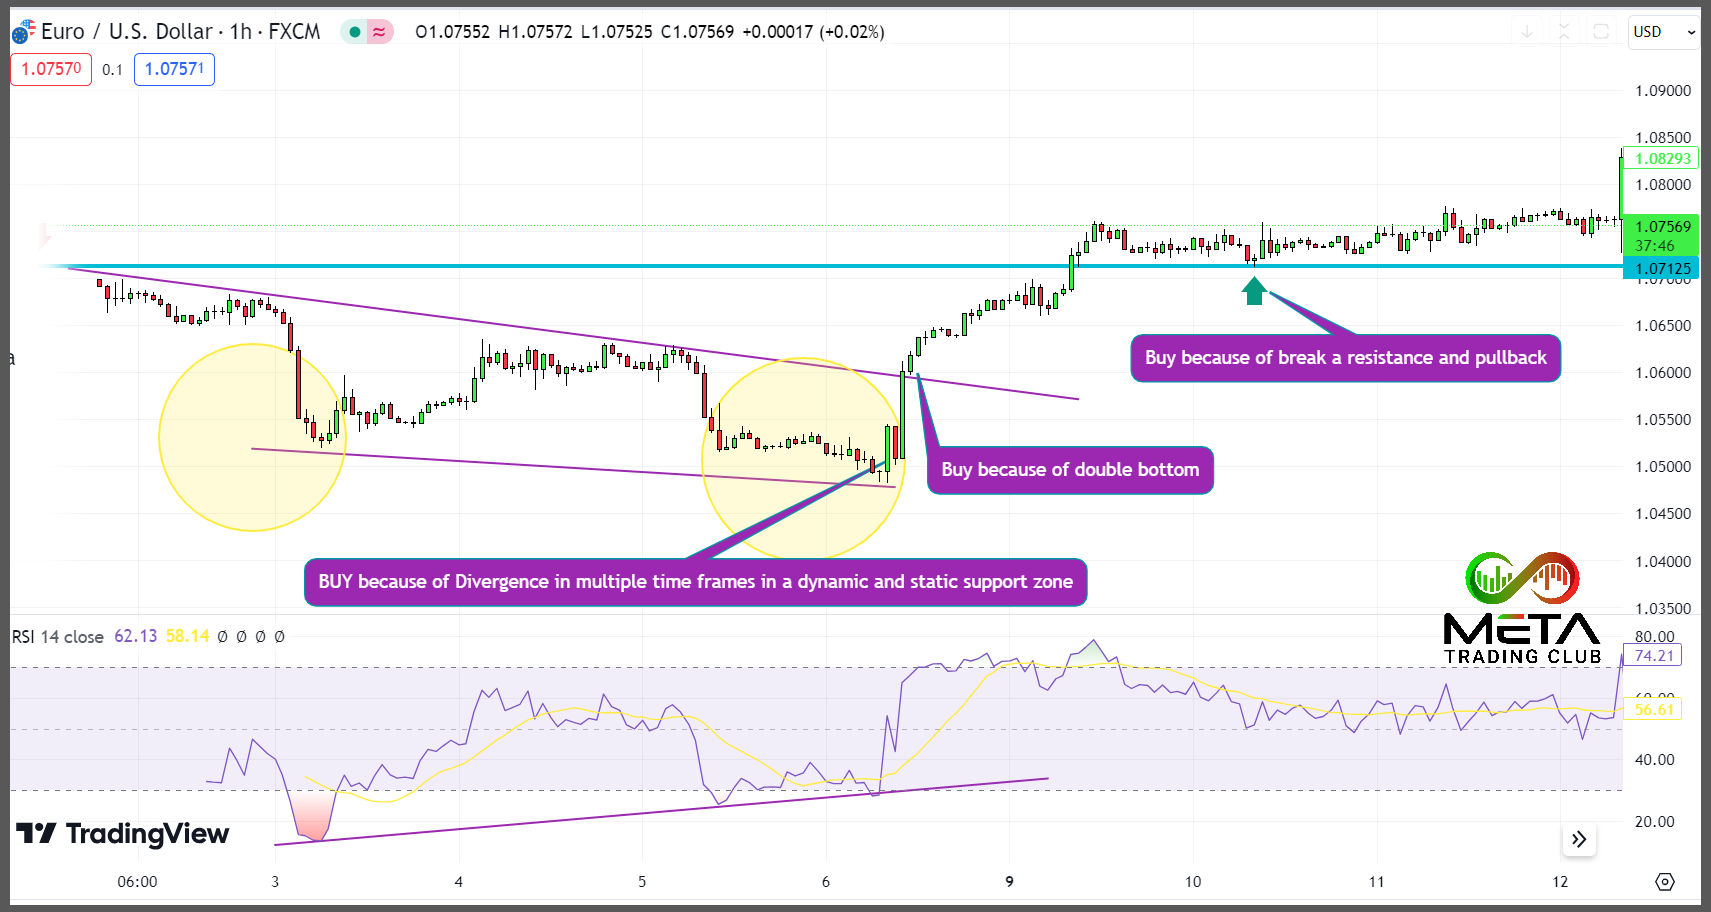
After getting this information you can find the appropriate price for opening a long position based on your strategies. Here, we show some kind of approaches:
Final Words
Multi-timeframe analysis is an important thing for all traders. In fact, many professionals in the industry use it every day.
Before you open a trade, we recommend that you look at a chart in several timelines. This will help you avoid making mistakes and identifying some points of interest.
FAQs
- What are multiple time frames?
Multiple time frames refer to analyzing the same asset or currency pair across different time intervals. Traders use this approach to gain insights into both short-term and long-term trends. - What is the time frame of analysis?
The time frame of analysis refers to the specific duration which trades open. It can vary from minutes (intraday) to days, weeks, or even months (long-term). Traders choose time frames based on their trading style and objectives. - What is a 3-time frame analysis?
A 3-time frame analysis involves analyzing an asset or security using three different time intervals. Typically, traders consider short-term, intermediate, and long-term charts to gain a comprehensive view of price movements and trends. This approach helps identify potential entry and exit points based on multiple perspectives. - What is multiple time frame analysis for scalping?
Multiple time frame analysis for scalping involves using short-term charts (1-minute or 5-minute) alongside slightly longer time frames (like 15-minute or 30-minute). Scalpers use this approach to identify quick entry and exit points based on price movements across different time scales. - How to use multiple timeframes in TradingView?
Open the indicator’s settings and find the “Resolution” parameter in the Inputs section. Then adjust the resolution to the timeframe you prefer. This allows you to view multiple time frames simultaneously on a single chart.