
If you are among those people that enjoy getting in and out of the market with profits in your pockets fast, then Momentum Strategy is your friend. Momentum trading is a strategy that capitalizes on the strength of an asset’s price movement. In simple terms, traders who use this approach aim to go long when the prices are trending upwards and exit before the trend reverses. The idea is to ride the wave of the price momentum, profiting from the continued movement in its current direction.
This strategy is particularly well suited for Day traders and scalpers. Why? Because these traders thrive on quick, short term trades. Momentum trading allows them to make the most of small to moderate price movements, executing trades within minutes or hours. For those who enjoy the fast paced nature of the market, momentum trading provides the perfect opportunity to capitalize on short term price shifts.
If you’re eager to grasp the art of momentum trading and master this strategy, stick with us till the end. We’ll guide you through everything you need to know, from the basics to advanced tactics, so you can start trading with confidence.
Table of Contents
How Momentum Trading Works?
For momentum to form, a bunch of stars must align, or in this case, technicals. Momentum in the market doesn’t just happen out of nowhere. It usually results from specific catalysts. These catalysts could be anything from a fundamental event, such as a positive earnings report, to encouraging news that sparks traders and investor confidence.
When it comes to bullish momentum, a trading opportunity often arises when high trading volume supports the price breaking above a pre-established resistance level with a strong, green candle body.
This breakout can signal the start of a continued upward trend, often confirmed by subsequent green candles. Sometimes, the price may briefly retest the broken resistance, using it as new support before moving higher.
However, there’s always the risk that the momentum might not be strong enough. In such cases, the price may fail to climb, leading to what’s known as a Bull trap. A Bull Trap is a situation where traders are lured into buying, only for the price to reverse and fall.

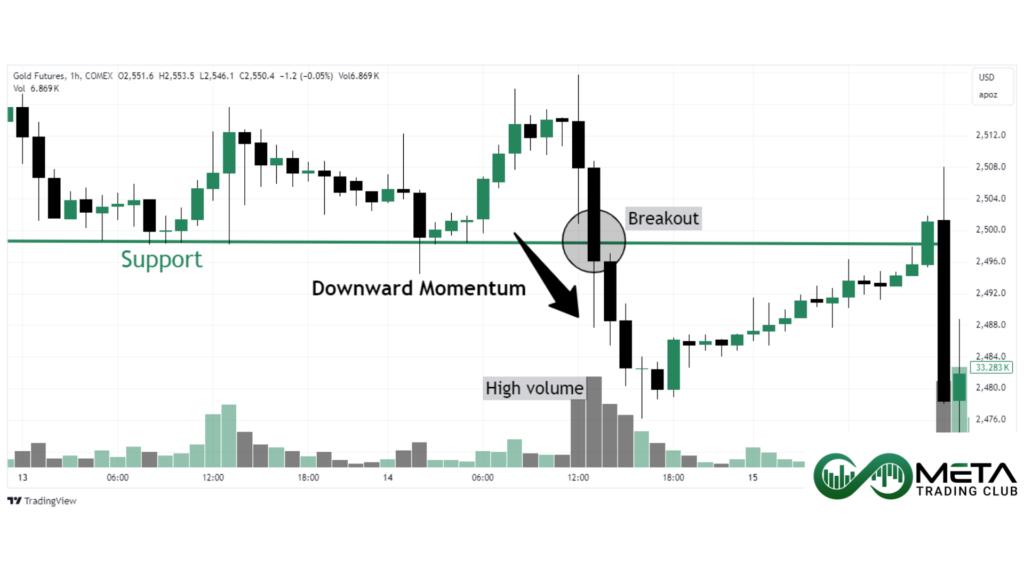
But momentum trading isn’t just about capitalizing on bullish trends. There’s also profit to be made from bearish momentum. In a bearish scenario, the reverse of the events mentioned earlier occurs. When the price breaks below a key support level with high volume, a short position can become highly profitable. However, just like with bullish momentum, it’s crucial to measure the strength of the bearish breakout. If the momentum isn’t strong enough, it could quickly reverse, leading to a bear trap that could wipe out your profits or even cause significant losses.
Now, you don’t need a crystal ball to predict when momentum will start forming. The key is not to try to time the market perfectly but rather to identify the momentum once it’s already in motion. By doing this, you’re not trying to catch the exact moment the market shifts but instead riding the wave as it comes, allowing you to capture profits along the way.
One of the best ways to gauge the strength of a breakout is by analyzing chart patterns or candlestick formations combined with high trading volume. These patterns can give you a clearer signal that momentum is building and help you decide whether to enter a trade. In the next section, we’ll cover these patterns in more detail.
Momentum Trading Confirmation
To increase your chances of success in momentum trading strategy, looking for confirmations that strengthen the momentum you’re observing is a must. Each confirmation you find increases the likelihood that the momentum is strong and that your trade will be a win. These confirmations can be grouped into three main categories: candlestick patterns, chart patterns, and indicators.

Candlestick Patterns
Candlestick patterns are visual representations of price movements within a specific time period. These patterns help you anticipate future price movements based on recent price action.
When you locate momentum, it’s crucial to focus on continuation candlestick patterns that signal the strength of the ongoing trend. Patterns like the Marubozu candle (a strong, full bodied candle without shadows) or the Three White Soldiers (a series of three consecutive long green candles) are examples of continuation patterns that indicate sustained bullish momentum.
On the other hand, encountering reversal candlestick patterns can be dangerous, especially for novice traders. Patterns like the Harami or Shooting Star can signal potential reversals, leading to bull or bear traps that catch traders off guard and result in losses.
It’s also important to consider the bigger trend when analyzing candlestick patterns. If the pattern and breakout align with the broader market trend, it adds validity to the breakout and significantly increases the chances of a continued rally.
Chart Patterns
Chart patterns are formations created by the price movements of an asset, displayed over a longer period on a candlestick chart. While similar to candlestick patterns, chart patterns consist of multiple candlesticks, often forming over days, weeks, or even months to be effective. Chart patterns typically include a larger group of candles compared to Candlestick patterns.
Like candlestick patterns, chart patterns can also signal the strength of a breakout. When you identify a chart pattern during a forming breakout, ensure it’s one of the continuation patterns that aligns with the breakout direction. The trading volume within the chart pattern is crucial. The ideal trading volume differs from pattern to pattern but they all share a high volume final stage. This surge in volume often confirms the strength of the breakout.
Among the various continuation patterns, two stand out for their reliability: the Flag pattern and the Ascending/Descending Triangle. Let’s start by covering the Flag pattern first.
Flag Continuation Pattern
The Flag pattern is a popular continuation pattern that signals a brief pause in a strong trend before the trend continues in its original direction. Understanding the anatomy of the Flag pattern is key to using it effectively in momentum trading.
First let’s set something straight, there are two main variants of the Flag pattern: the Pennant-shaped Flag and the Rectangular Flag. Both of these can appear as either bullish or bearish, depending on the context in which they form on the chart.
The Pennant Flag resembles a small symmetrical triangle, where the price action converges toward a point, creating a pennant shape. The pennant usually forms after a strong price movement, known as the “pole”. The consolidation within the pennant is typically brief, after which the price breaks out in the same direction as the original trend.
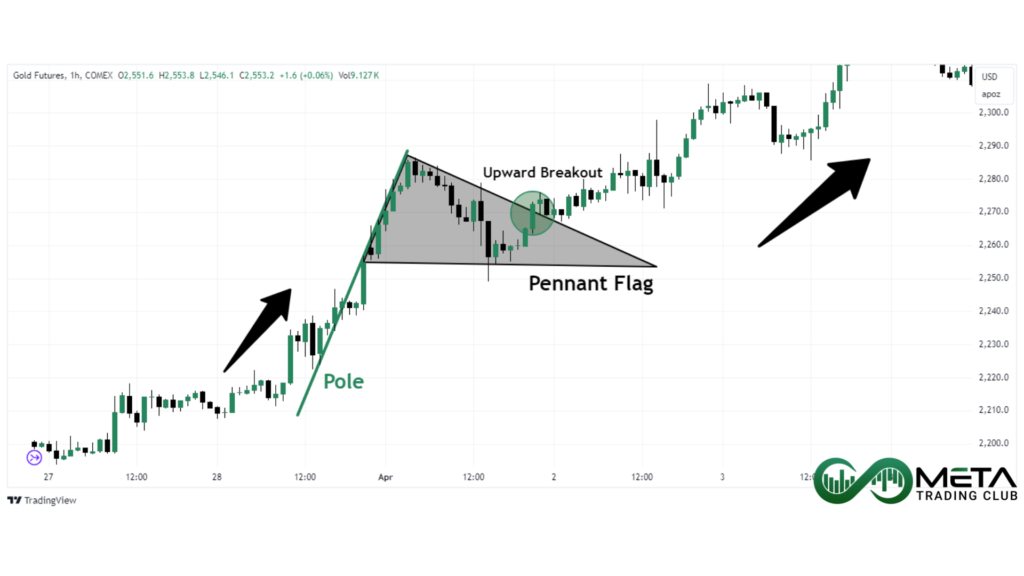
Now what happens this break out aligns with the break out of a pre-established resistance with major momentum? Simple, you will have a much higher chance of winning a trade.
The Rectangular Flag variant looks and functions pretty much the same. It looks like a small rectangle where the price moves within parallel trendlines, slightly sloping against the prevailing trend. Like the pennant, the rectangular flag forms after a strong price movement, and the consolidation within the rectangle suggests a brief pause before the trend resumes.
Keep in mind that both Flag variants can easily be used for bearish breakouts, you simply need to mirror them horizontally.
Ascending and Descending Triangle
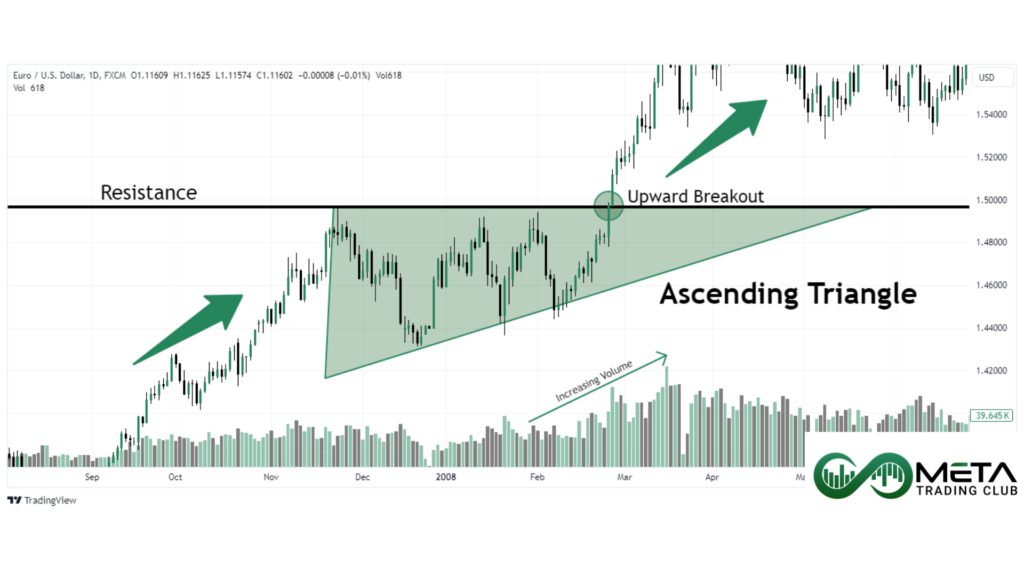
The Ascending Triangle is a powerful continuation pattern that often precedes a strong bullish breakout. The anatomy of an ascending triangle is defined by a horizontal resistance line at the top and an upward-sloping trendline at the bottom.
Ascending Triangle forms as the price tests a certain resistance level multiple times. Each time the price retraces from the resistance, it pulls back less, creating a series of higher lows. This tightening price action indicates that buyers are gaining strength and are likely to push the price through the resistance level.
When the price finally breaks through the resistance, it usually does so with high volume and momentum, signaling the start of a strong upward movement.
The significance of the Ascending Triangle lies in its ability to indicate increased trading activity and a higher probability of trend continuation. When this pattern is detected in conjunction with a high momentum breakout, it signals a very strong movement, substantially increasing the chances of the breakout continuing.
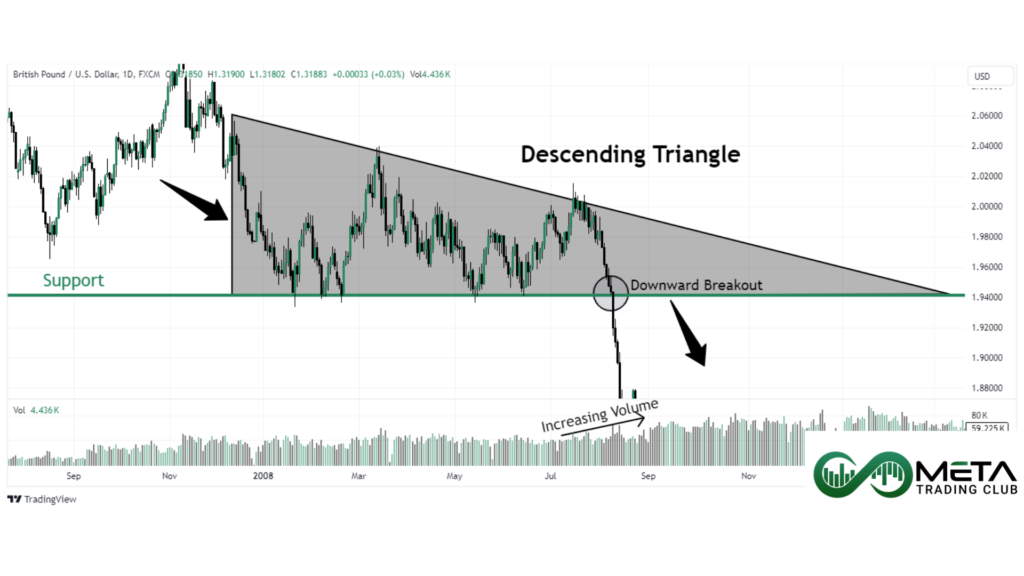
The Descending Triangle, while similar in structure to the Ascending Triangle, signals a bearish continuation. The descending triangle pattern features a horizontal support line at the bottom and a downward-sloping trendline at the top. The price tests the support level multiple times, with each bounce off the support creating lower highs. This pattern shows that sellers are becoming increasingly dominant, with each rally being weaker than the last.
When the price finally breaks below the support level, it typically does so with strong momentum and high volume, leading to a significant downward movement. Other than their direction, the mechanics of the Descending Triangle are not much different from those of the Ascending Triangle. Both patterns indicate a buildup of pressure that, once released, can lead to a powerful continuation in the direction of the breakout.
Indicators
Indicators are another tool in a trader’s arsenal. You can use indicators to gauge a breakout’s momentum and enter trades with higher chances of winning. We will go through 3 key indicators you can use for your momentum trading strategy and better informed decisions.
Moving Average (MA)
The Moving Average (MA) is a widely used indicator that smooths out price data to identify the direction of the trend. There are two main types of moving averages: Simple Moving Average (SMA) and Exponential Moving Average (EMA). The SMA calculates the average price over a specified period, while the EMA gives more weight to recent prices, making it more responsive to new information.
Moving averages can help confirm the strength of a breakout. For instance, when a short term moving average (20 MA) crosses above a long term moving average (50 MA), it’s a bullish signal that indicates strong momentum. Similarly, a breakout above a key moving average level with increasing volume suggests that the breakout is likely to be sustained.
MACD
The Moving Average Convergence Divergence (MACD) is a momentum indicator that shows the relationship between two moving averages of an asset’s price.
The MACD consists of two lines: the MACD line and the signal line. When the MACD line crosses above the signal line, it indicates bullish momentum, and when it crosses below, it indicates bearish momentum.
The MACD is invaluable. A strong breakout is often accompanied by a significant divergence between the MACD and the signal line, indicating that momentum is firmly in favor of the breakout direction. Additionally, if the MACD histogram (which shows the difference between the MACD line and the signal line) increases sharply, it further confirms the strength of the breakout.

RSI
The Relative Strength Index (RSI) is a momentum oscillator that measures the speed and change of price movements on a scale of 0 to 100. An RSI above 70 generally indicates that a security is overbought, while an RSI below 30 suggests it is oversold.
In momentum trading strategy, the RSI helps traders assess whether a breakout has the strength to continue. If a breakout occurs and the RSI is moving towards overbought territory (above 70) with strong momentum, it may indicate that the breakout has the potential to continue. However, traders should be cautious if the RSI becomes extremely overbought, as this can signal that the asset may soon reverse or consolidate.
Momentum Trading Risk Management
So now you know how to detect a strong momentum, how to make sure it’s strong enough, but you wonder, “How am I Supposed to Trade This?”
Worry not as you will learn where to enter your position, set stop loss and take profit limits.
When you spot an upward breakout, it can be tempting to jump in and open a long position immediately. As soon as the price breaks above a resistance level, you technically have an entry point. However, to increase your chances of a successful trade, it’s often better to wait for a confirmation.
We recommend waiting for a second green candle to close above the breakout level. This confirmation can significantly increase your chances of the breakout being genuine, rather than a false signal that could lead to a bull trap.
After entering the trade, setting a stop loss is crucial for managing risk. A good rule of thumb is to place your stop loss at least 5% below the broken resistance level. This cushion helps protect your position from minor pullbacks that might occur after the breakout. Depending on your trading plan and risk tolerance, you might adjust this distance slightly, but the key is to give the trade enough room to breathe without exposing yourself to unnecessary risk.

As for setting your profit target, there are a few strategies you can use:
Measure the Height of the Previous Range: One common approach is to measure the height of the range that preceded the breakout (the distance between the resistance and the previous support). You can then project this distance upward from the breakout point to set your initial profit target.
Use Key Resistance Levels: Another method is to look for upcoming resistance levels on the chart, which could act as potential targets. If the next significant resistance is 10% above the breakout level, that might be a logical place to set your target. You can also use tools like Fibonacci extension.
Trailing Stop: If you want to maximize your gains, you can use a trailing stop. This method involves moving your stop loss up as the price moves in your favor, locking in profits as the trade progresses without capping your upside potential. After reaching a certain profit margin, we suggest moving your stop loss to your initial entry to make your trade risk free.
Final Words
And with that you know what Momentum Trading Strategy is. We’ve explored the essentials of momentum trading and how to leverage this powerful strategy to maximize your trading success. We started with an introduction to momentum trading, explaining why it’s a perfect match for day traders and scalpers. Then, we delved into how momentum trading works, discussing the importance of understanding and identifying strong momentum through various conformations.
We covered key concepts like candlestick patterns and chart patterns, highlighting the significance of continuation patterns like the Flag and Ascending/Descending Triangles. We also introduced essential indicators (such as Moving Averages, MACD, and RSI) and explained how they can help you gauge the strength of a breakout.
Finally, we walked through the steps to open a long position during an upward breakout, from waiting for confirmation to setting your stop loss and profit target.

If you’re looking to dive deeper into the world of trading and enhance your skills, I invite you to download my Free Ebook. It’s packed with in-depth knowledge, strategies, and tips that will help you become a more confident and successful trader.
FAQ
Momentum trading is a strategy where traders buy assets rising in price and sell those falling, aiming to profit from the continuation of existing trends.
Momentum is used to identify and capitalize on strong price trends, buying in an uptrend and selling in a downtrend.
The Moving Average Convergence Divergence (MACD) is often considered one of the best indicators for momentum trading.
Confirm high momentum by looking for strong price movements with increased trading volume, supported by indicators like MACD or RSI.
Momentum trading involves identifying strong price trends and trading in the direction of the trend, aiming to profit from continued movement.