On June 5, 2024, financial markets exhibited a range of movements influenced by economic data and market expectations. WTI crude oil futures traded above $74.5 per barrel, rebounding after reaching a four-month low earlier in the week. Gold prices surpassed $2,360 per ounce as softer US job data increased the likelihood of Federal Reserve rate cuts. Silver prices dipped below $30 per ounce due to mixed economic signals and industrial demand dynamics. In currency markets, the euro rose slightly following an ECB rate cut, while the British pound fell as investors took profits. The Australian dollar found support amid better-than-expected domestic economic data. Meanwhile, US stock futures hovered around the flatline after the S&P 500 and Nasdaq reached new highs, and Treasury yields briefly dropped before stabilizing.
Table of Contents

Economic Events:
Initial Jobless Claims:
The number of initial jobless claims in the United States increased to 229,000 for the week ending June 1, 2024, up from 221,000 the previous week. Historically, the average has been 364,610 claims from 1967 to 2024, with a peak of 6,137,000 in April 2020 and a low of 162,000 in November 1968.
Labor Productivity:
Labor productivity in the nonfarm business sector rose by 0.2% in Q1 2024. This was slightly below the preliminary estimate of a 0.3% increase but exceeded market expectations of a 0.1% rise. Output grew by 0.9%, while hours worked increased by 0.6%. Year-on-year, productivity saw a 2.9% rise, the largest since Q1 2021.
Job Cuts:
US employers announced plans to cut 63,816 jobs in May 2024, down 1.5% from April and 20.3% from a year earlier. The entertainment and leisure sectors reported the most cuts, followed by technology, utilities, and services. Despite lower hiring announcements, the job cut total for January to May 2024 remains the third highest since 2009.
Trade Deficit:
The US trade deficit widened to $74.6 billion in April 2024 from a revised $68.6 billion in March, falling short of the forecasted $76.1 billion gap. Imports increased by 2.4%, driven by passenger cars, computer accessories, and crude oil, while exports rose by a modest 0.8%. The largest trade gap was with the European Union, while deficits with China and Mexico narrowed.

Commodities::
WTI Crude Oil
WTI crude futures climbed above $74.5 per barrel, continuing a technical rebound after hitting a low of $73 earlier. A rise in US crude inventories and the possibility of Federal Reserve rate cuts spurred optimism for increased economic activity and oil demand.
GOLD
Gold prices exceeded $2,360 per ounce, buoyed by expectations of Fed rate cuts following weaker-than-expected US job data. Markets anticipate two rate cuts this year, with a 70% chance of a cut in September, per CME FedWatch Tool.
Silver
Silver prices fell below $30 per ounce, retreating from an 11-year high amid mixed signals on central bank rate policies and industrial demand. US tariffs on Chinese solar cell imports and strong domestic demand in China influenced market dynamics.
Currencies:
EURUSD
The euro edged up to $1.088 after the ECB cut interest rates by 25 basis points as expected. Policymakers indicated a cautious approach to further cuts, noting persistent inflation pressures.
GBPUSD
The British pound declined to $1.27, with investors taking profits after its strong performance in May. Focus shifted to the ECB decision and upcoming US employment data, while UK inflation data and political uncertainties added pressure.
AUDUSD
The Australian dollar steadied above $0.665, supported by domestic economic data that exceeded market expectations. Although Q1 GDP growth was modest, it averted a contraction, providing some relief to investors.
Stock Market:
US500
US futures remained flat, with the S&P 500 and Nasdaq having reached record highs. Market participants awaited further economic data to gauge the monetary policy outlook. Initial jobless claims and labor cost revisions suggested potential for Fed rate cuts later this year.
Crypto:
BTC
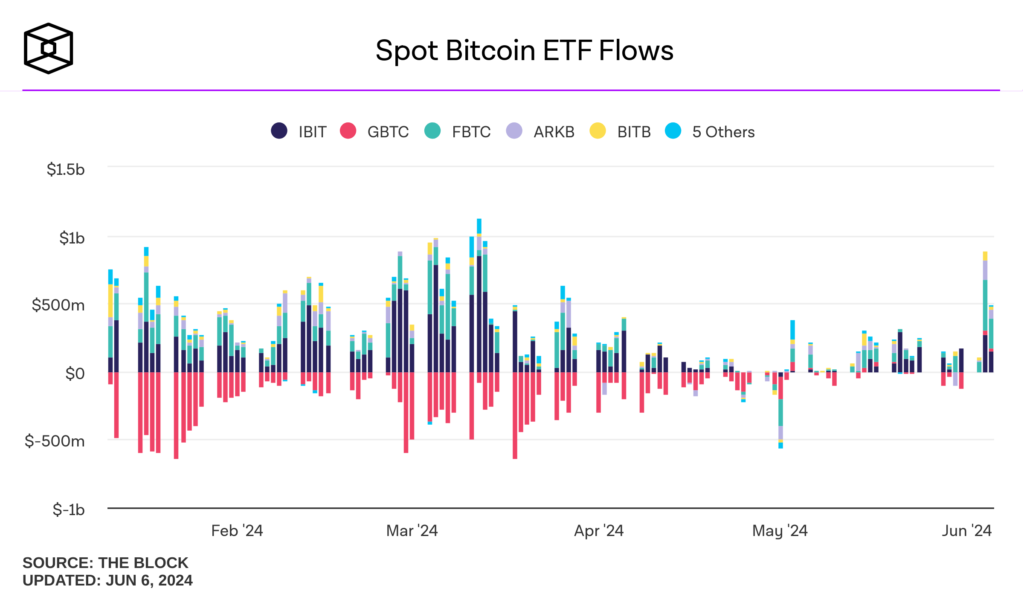
The chart titled “Spot Bitcoin ETF Flows” illustrates significant fluctuations in the net flows of various Bitcoin ETFs during the first half of 2024. In February and March, there are notable peaks in inflows, particularly for IBIT and GBTC, indicating increased demand for these ETFs. However, from April onwards, the flows stabilize, with smaller fluctuations and more balanced inflows and outflows. This trend suggests a period of adjustment and consolidation in the Bitcoin ETF market. Overall, the data highlights the dynamic nature of Bitcoin ETF investments and the varying investor sentiment throughout this period. The chart is sourced from “The Block” and was last updated on June 3, 2024.

Treasuries:
US10Y
The yield on the US 10-year Treasury note briefly dropped to 4.29% before rebounding to 4.34%. Investors increasingly anticipate a rate cut in September, driven by weaker job data and mixed economic indicators.
Disclaimer: The views and opinions expressed in the blog posts on this website are those of the respective authors and do not necessarily reflect the official policy or position of Meta Trading Club Inc. The content provided in these blog posts is for informational purposes only and should not be considered as financial advice. Readers are encouraged to conduct their own research and consult with a qualified financial advisor before making any investment decisions. Meta Trading Club Inc shall not be held liable for any losses or damages arising from the use of information presented in the blog posts.


