An inflation report is published by the government, typically by the central bank, and provides detailed information on current inflation rates. It includes data on price changes for various expenditure categories like housing, food, and transportation, and identifies factors driving inflation.
A Consumer Price Index (CPI) report measures the average change in prices paid by urban consumers for a market basket of goods and services, providing a key indicator of inflation. Published monthly by national statistical agencies, it includes data on categories like food, housing, and transportation. The CPI report helps policymakers, economists, and investors understand economic trends and make informed decisions.
Inflation January 2025
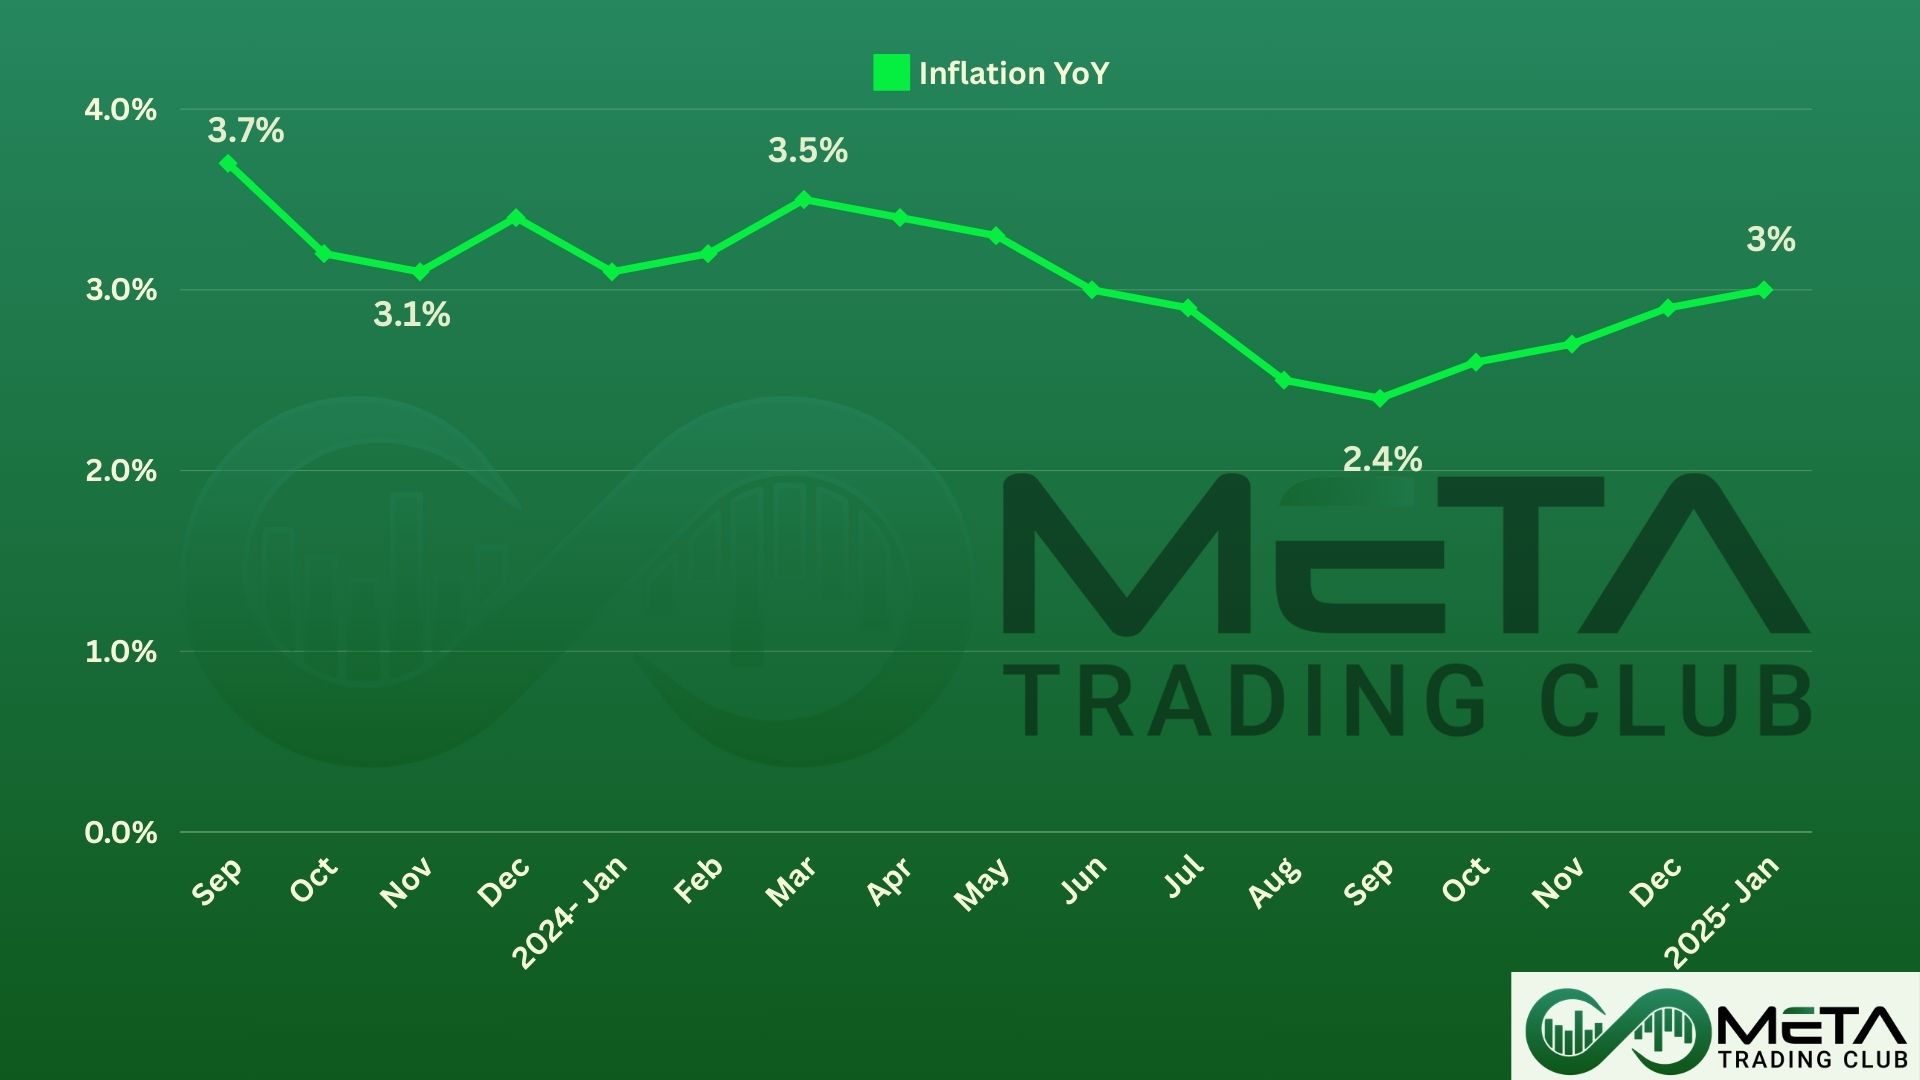
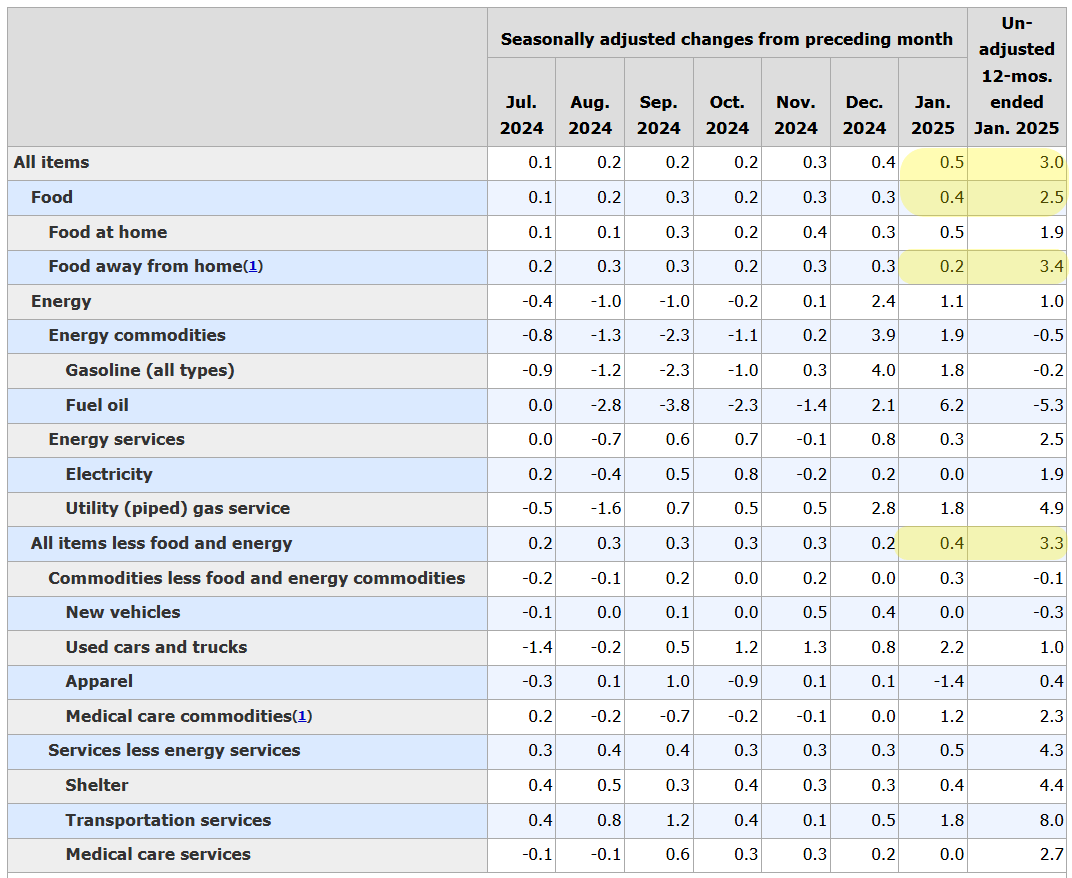
In January, the Consumer Price Index (CPI) increased by 0.5%, following a 0.4% rise in December and above forecasts.
Notably, the shelter index rose by 0.4% in January, accounting for nearly 30% of the monthly increase in the CPI index. The energy index also saw a rise of 1.1%, with gasoline prices increasing by 1.8%. The food index grew by 0.4%, with food at home increasing by 0.5% and food away from home by 0.2%.
Excluding food and energy (Core Inflation), the index rose by 0.4% in January. Significant increases were observed in motor vehicle insurance, recreation, used cars and trucks, medical care, communication, and airline fares. However, the indexes for apparel, personal care, and household furnishings and operations decreased during the month.
Over the past 12 months, the CPI index rose by 3%, while the index for all items less food and energy increased by 3.3%. The energy index saw a modest increase of 1%, and the food index rose by 2.5% during the same period.
Source: BLS report
Food
- The food index increased by 0.4% in January.
- Food at home rose 0.5%, with notable increases in the indexes for meats, poultry, fish, and eggs, which surged 1.9%, and eggs specifically increased by 15.2%.
- Fruits and vegetables fell by 0.5%, and cereals and bakery products decreased by 0.4%.
- Food away from home increased by 0.2%.
Energy
- The energy index rose 1.1% in January, with gasoline increasing by 1.8%.
- Over the past 12 months, the energy index increased by 1%, with electricity rising 1.9% and natural gas up by 4.9%.
All Items Less Food and Energy
- This index rose 0.4% in January.
- The shelter index increased by 0.4%, while medical care increased by 0.2%.
- The index for motor vehicle insurance went up by 2.0%, and used cars and trucks rose by 2.2%.
- Over the past 12 months, this index increased by 3.3%, with shelter rising by 4.4%.
Impacts of January Inflation Data on Market
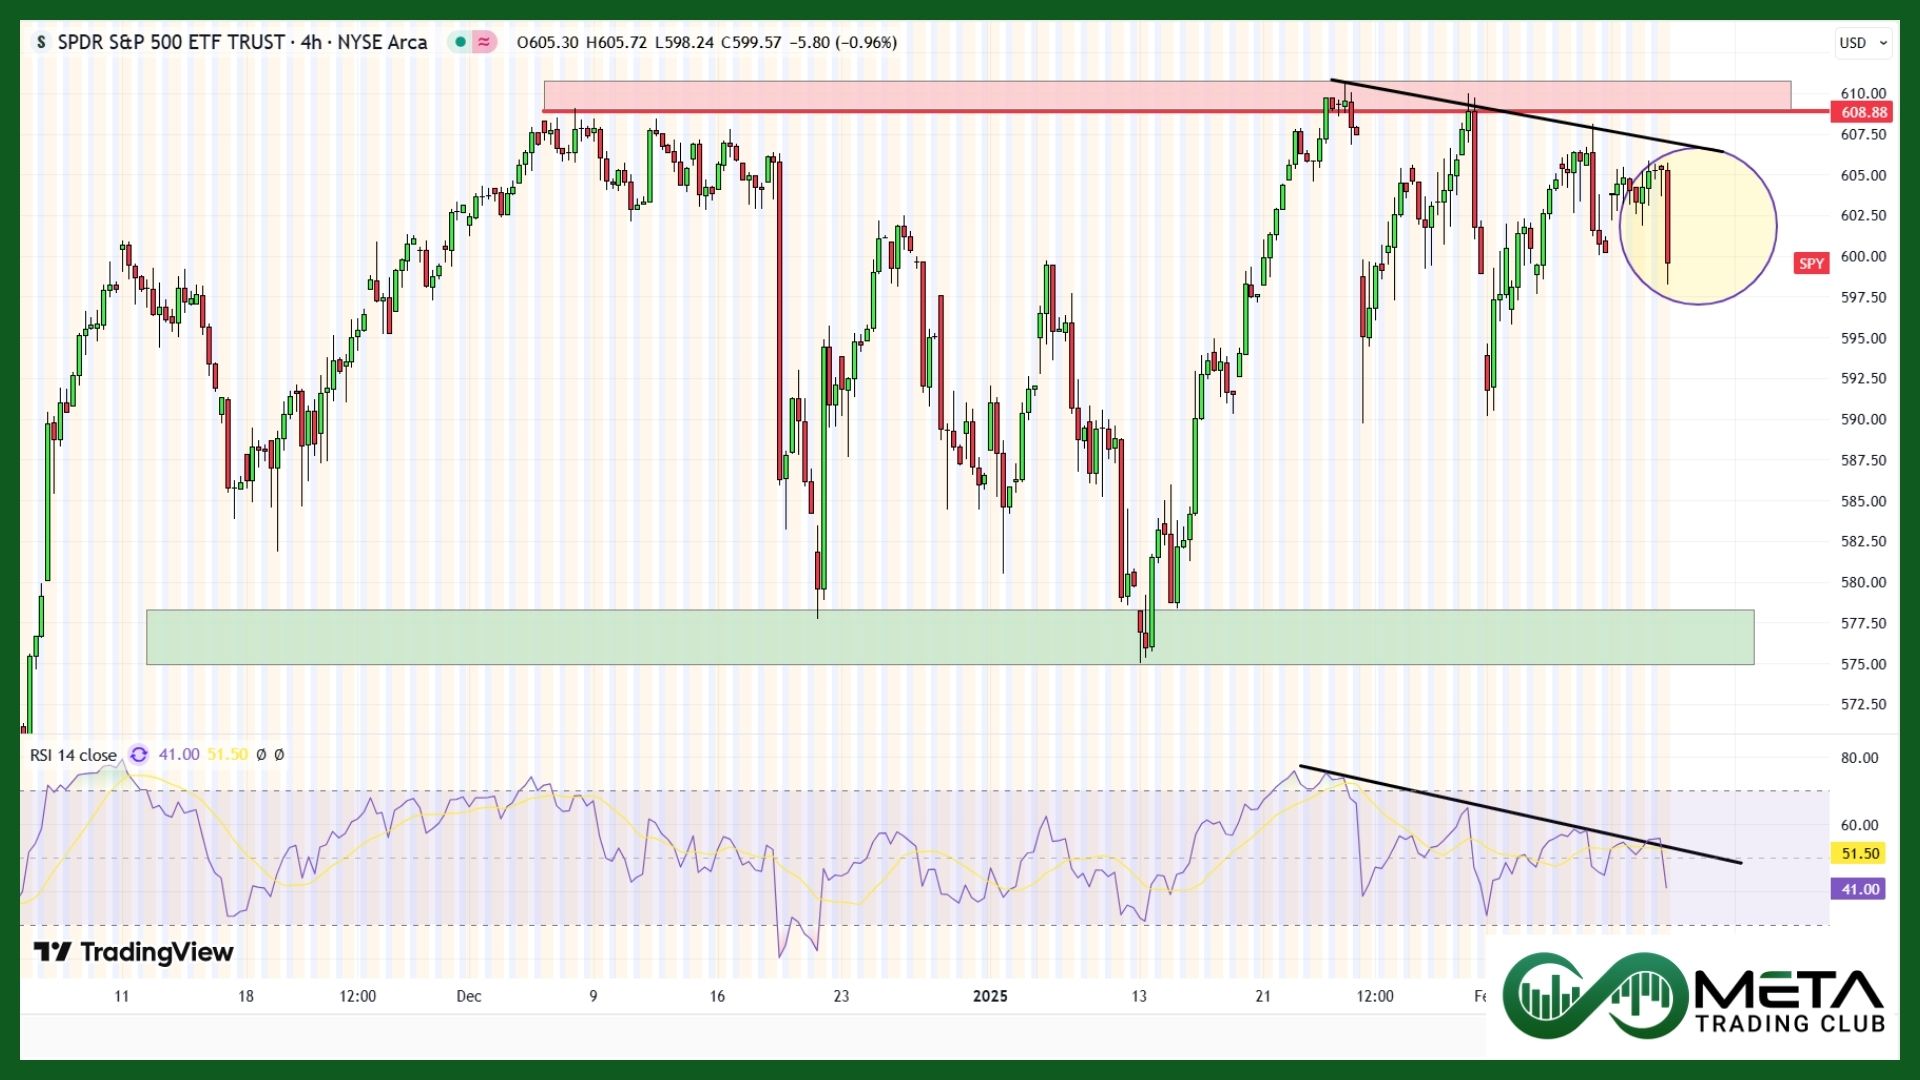
Following the release of January’s inflation data, the stock index dropped by over 1% in pre-market trading. Investors are worried about continuing inflation and the possible delay in interest rate cuts by the Federal Reserve.
Investors are worried because higher inflation can lead to increased costs for businesses, which can squeeze profit margins and slow down economic growth. Additionally, persistent inflation may prompt the Federal Reserve to keep interest rates higher for longer, making borrowing more expensive for companies and consumers. This can reduce spending and investment, negatively impacting stock prices.