

What Is an Index?
A market index tracks the performance of a certain group of stocks, bonds or other trading assets. These are often grouped around a particular industry, like tech stocks, or even the stock market overall. As is the case with the S&P 500, Dow Jones index or Nasdaq.
A stock index, also called a share index or stock market index, consists of constituent stocks used to provide an indication of an economy, market, or sector. A stock index is commonly used by traders as a benchmark to gauge the performance of their portfolio.
There’s no set size when it comes to market indexes. The Dow Jones Industrial Average (DJIA) contains just 30 stocks while the S&P 500 index is tracking the stock performance of 500 of the largest companies. What’s important is that each contains a large enough sample size to represent the overall behavior of the economic sliver they aim to represent.
History of Market Index
Dow unveiled what is probably still the best known of all market indices, the Dow Jones Industrial Average (DJIA). The DJIA was created on May 26, 1896, by two financial reporters, Charles Dow and Edward Jones. They established the index to track the performance of 12 large companies in each sector of the U.S. stock market. The first published value of the DJIA was 40.94, calculated by taking the average market price for the 12 companies. The creation of the DJIA was a significant step in providing traders with a reliable indicator of the overall health of the stock market, especially at a time when access to truthful and unbiased information about company financials was limited. The DJIA has since become one of the most commonly followed equity indexes in the world. Nowadays, the DJIA is tracking 30 large U.S. companies.
As the stock market grew and became more complex, the need for additional indexes arose. In 1957, Standard & Poor’s (S&P) introduced the S&P 500, which tracks the performance of 500 large-cap U.S. companies. This index quickly became one of the most widely followed benchmarks in the world.
Over time, stock indexes have evolved to include not only domestic companies but also international ones. Global indexes, such as the MSCI World Index and the FTSE All-World Index, provide traders a broader view of the global stock market. These indexes include companies from various countries and regions, allowing traders to gauge the performance of the global economy as a whole.
In recent years, there has been a rise in the popularity of sector-specific indexes. These indexes focus on specific industries or sectors, such as technology, healthcare, or energy. Also, they allow traders to track the performance of a particular sector.
How Stock Market Indexes Are Constructed
Each stock market index uses its own proprietary formula when determining which companies to include.
Indexes that measure the performance of broad swathes of the market. However, they include companies that rank highly in terms of market capitalization (total value of all of their outstanding shares). Alternatively, they may be selected by an expert committee or simply represent all of the shares that trade on a certain stock exchange.
Once an index manager has determined which companies to include, they then need to determine how those companies are represented in the index, a factor called index weighting. Depending on weighting, all companies included in an index can have an equal impact on index performance or a different impact based on market capitalization or share value.
Index Weighting Models
Market-Cap Weighted: In a market cap-weighted index, the index more heavily represents stocks with higher market capitalization. With this structure, large companies have a bigger impact on the index’s performance.
Equal Weighted: With an equal-weighted index, the index treats all components the same. This means each company’s performance affects the index the same amount, whether they’re incredibly large companies or incredibly small.
Price Weighted: A price-weighted index grants each company a different weight based on its current share price. Companies with larger share prices have more clout in these indexes, regardless of how big or small the companies actually are. For example, Dow Jones is a price weighted index.

Major Stock Market Indexes
A stock market index shows how traders feel an economy is faring. An index collects data from a variety of companies across industries. Together, that data forms a picture that helps traders compare current price levels with past prices to calculate market performance.
Some indices focus on a smaller subset of the market. For example, the Nasdaq stock index closely tracks the technology sector. So, if you want to know how technology companies are performing, you’d want to look at the Nasdaq index.
Indexes also vary in size, with some tracking just a handful of stocks and others looking at thousands. Each index serves a unique purpose because different traders are interested in different sectors.
There are thousands of indexes in the trading universe. To help you get your bearing, here are the most common indexes you’ll probably encounter:
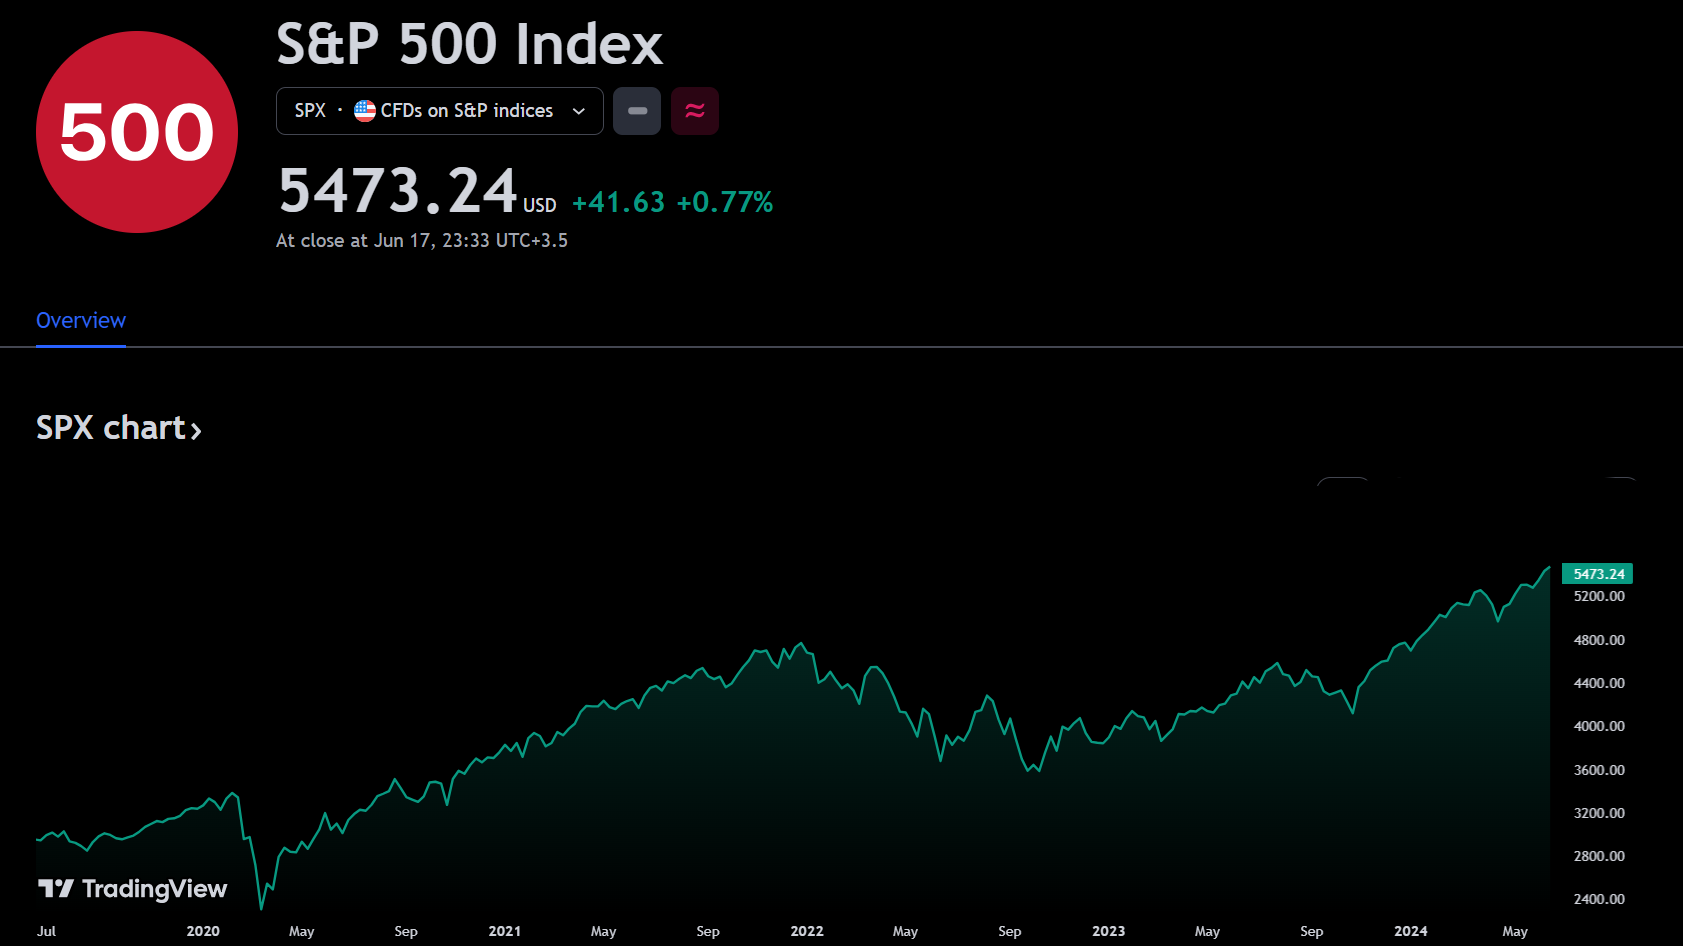
1- The S&P 500 Index
Standard and Poor’s 500 Index is a capitalization-weighted stock market index. They are measuring the performance of 500 large publicly traded companies in the United States. This index covers a wide range of industries, including technology, healthcare, energy, and finance. It shows the overall health of the U.S. stock market and reflection of the country’s economic strength.
Gains in the S&P 500 are often positive signals for the economy, while losses can be indicators of potential trouble. Traders use this index as a barometer for their own portfolios and to assess the performance of individual stocks. The S&P 500 index plays a vital role in the financial world, and it is closely watched by analysts and policymakers.
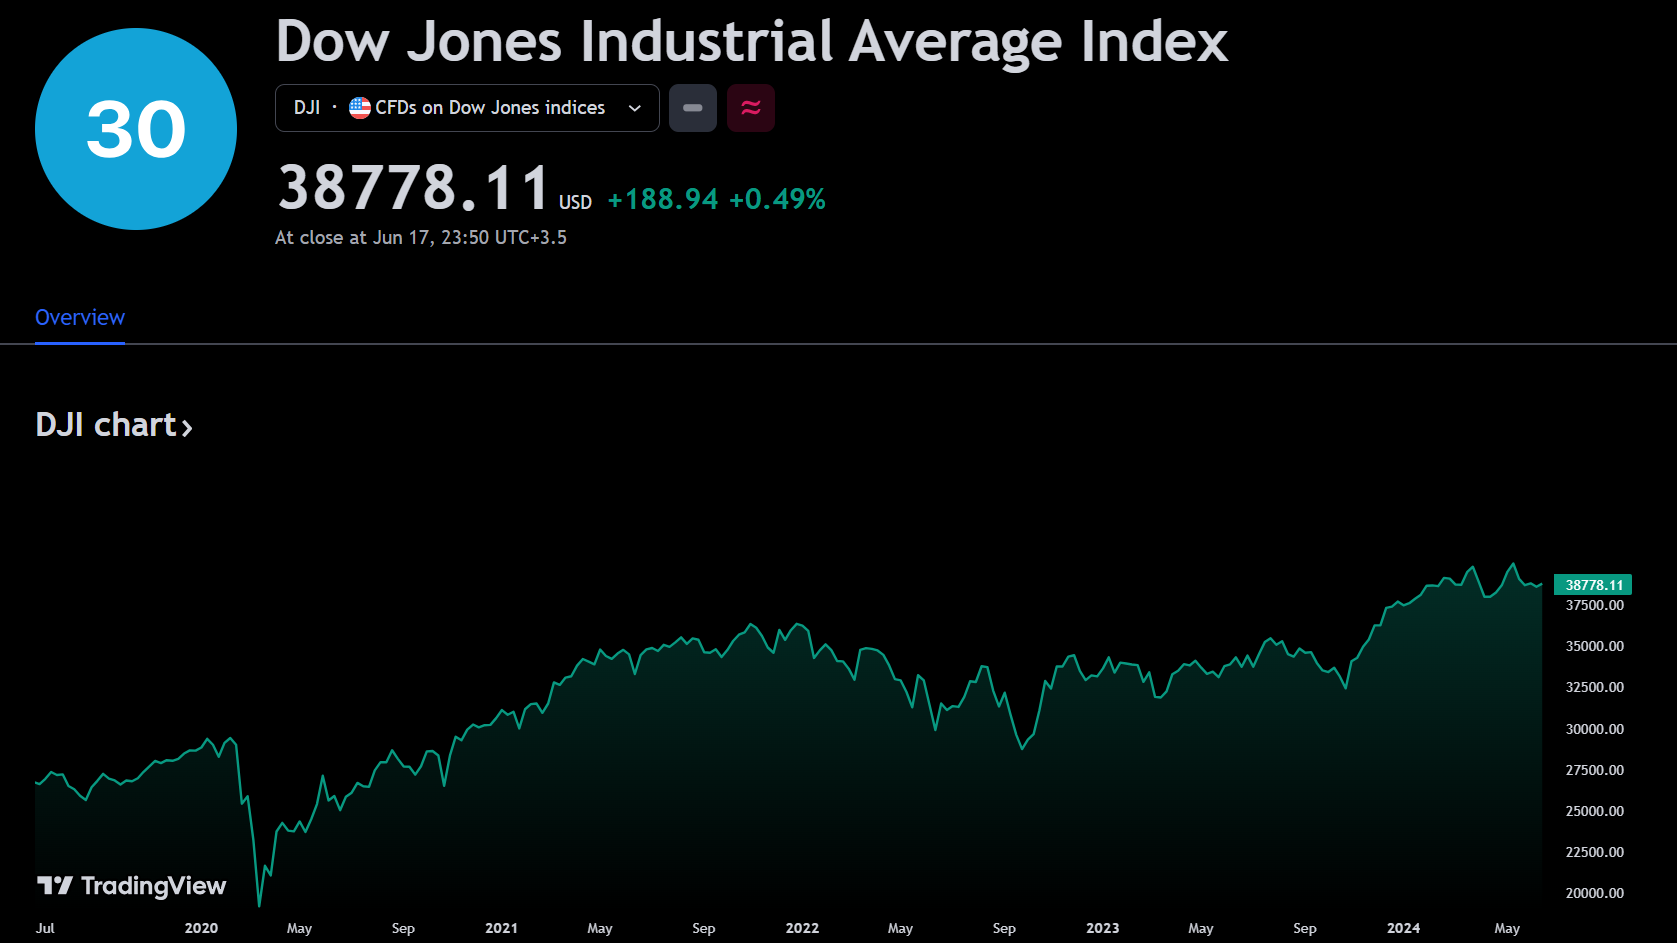
2- The Dow Jones Industrial Average
Dow Jones index often refers to the Dow Jones Industrial Average. It was one of the first stock indices and it is one of the most commonly referred to barometers of equity performance in the United States. The Dow Jones index is relatively tracking the performance of just 30 U.S. companies as selected by S&P Dow Jones Indices. The stocks within the DJIA come from a range of industries, from healthcare to technology, but are united by all being blue chip stocks. This means they have a history of strong financial performance. The DJIA is one of the few price-weighted market indexes.
Also, Dow Jones index consists of thirty stocks which traditionally were industrial based. But in recent years as the US economy has become more consumer-oriented, the index has seen a change in composition that no longer has much to do with direct industrial investment.
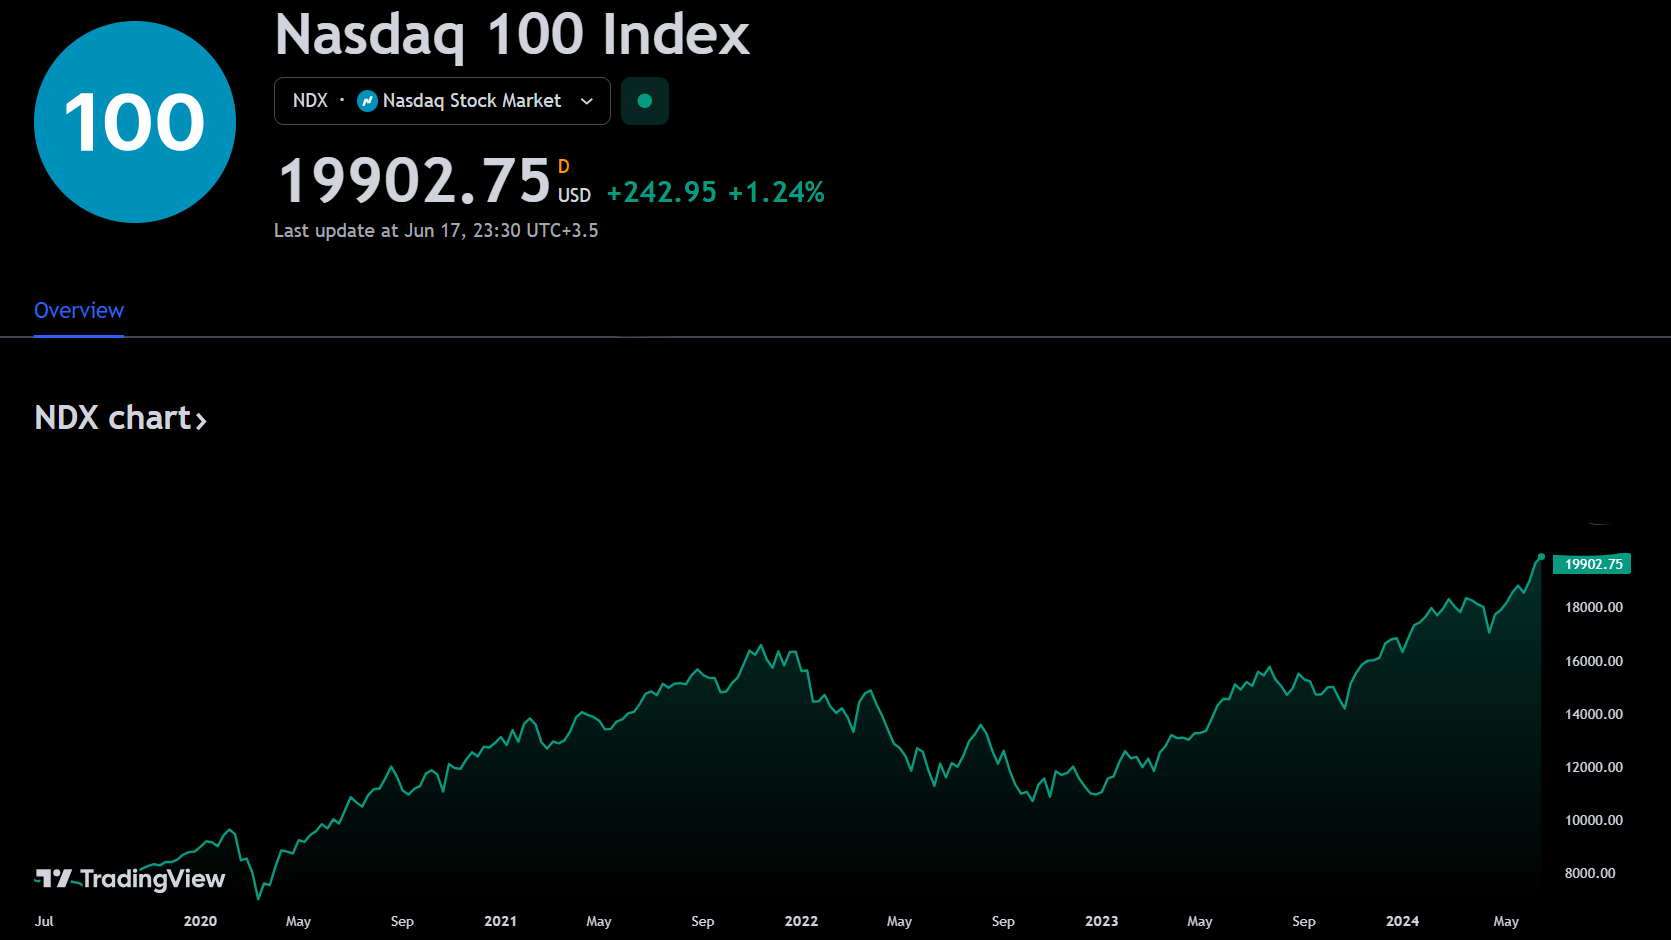
3- The Nasdaq 100
The Nasdaq 100 tracks the performance of 100 of the largest and most actively traded stocks listed on the Nasdaq stock exchange. Companies within the Nasdaq can be in many different industries. They generally veer toward tech and don’t include any members of the financial sector. The Nasdaq 100 uses a market-cap weighting.
The companies that are listed in this index range from a variety of industries like Technology, Telecommunications, Biotechnology, Media, and Services. The NASDAQ-100 was first calculated on January 31 of 1985 by NASDAQ and it is a modified capitalization-weighted index. This index has been of good reference traders that want to know how the stock market is performing without financial services companies, this given that the index excludes financial companies.
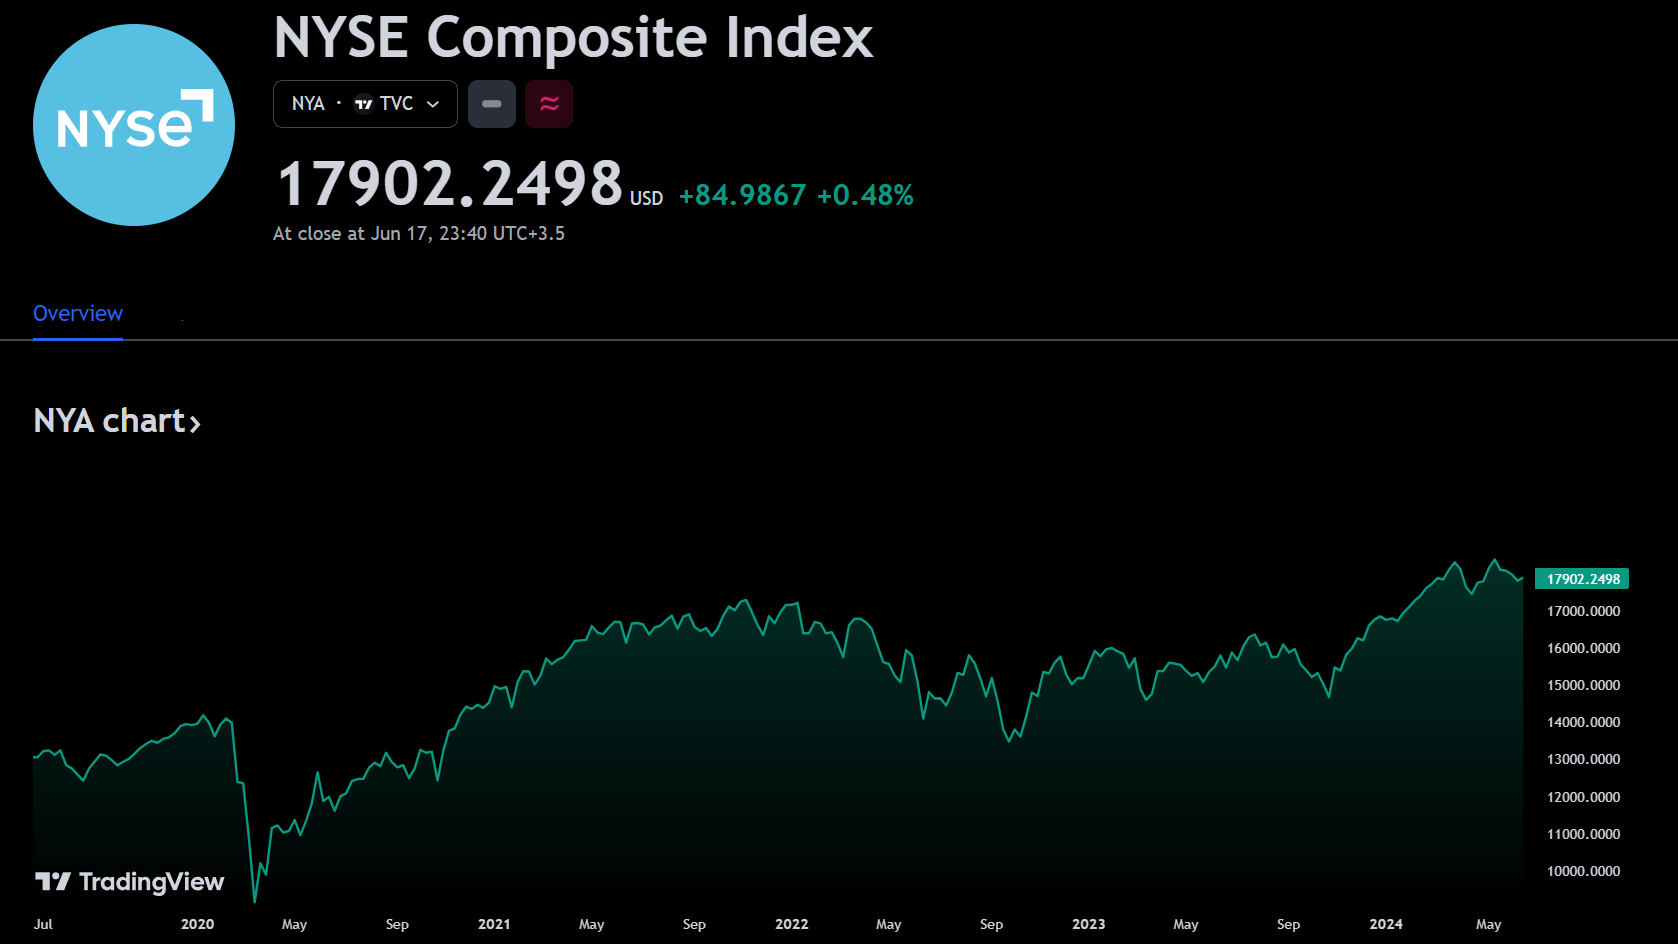
4- The NYSE Composite Index
The NYSE Composite Index is a comprehensive index. This index tracks the performance of all stocks traded on the New York Stock Exchange (NYSE). Also, this index is modified by market capitalization weighting.
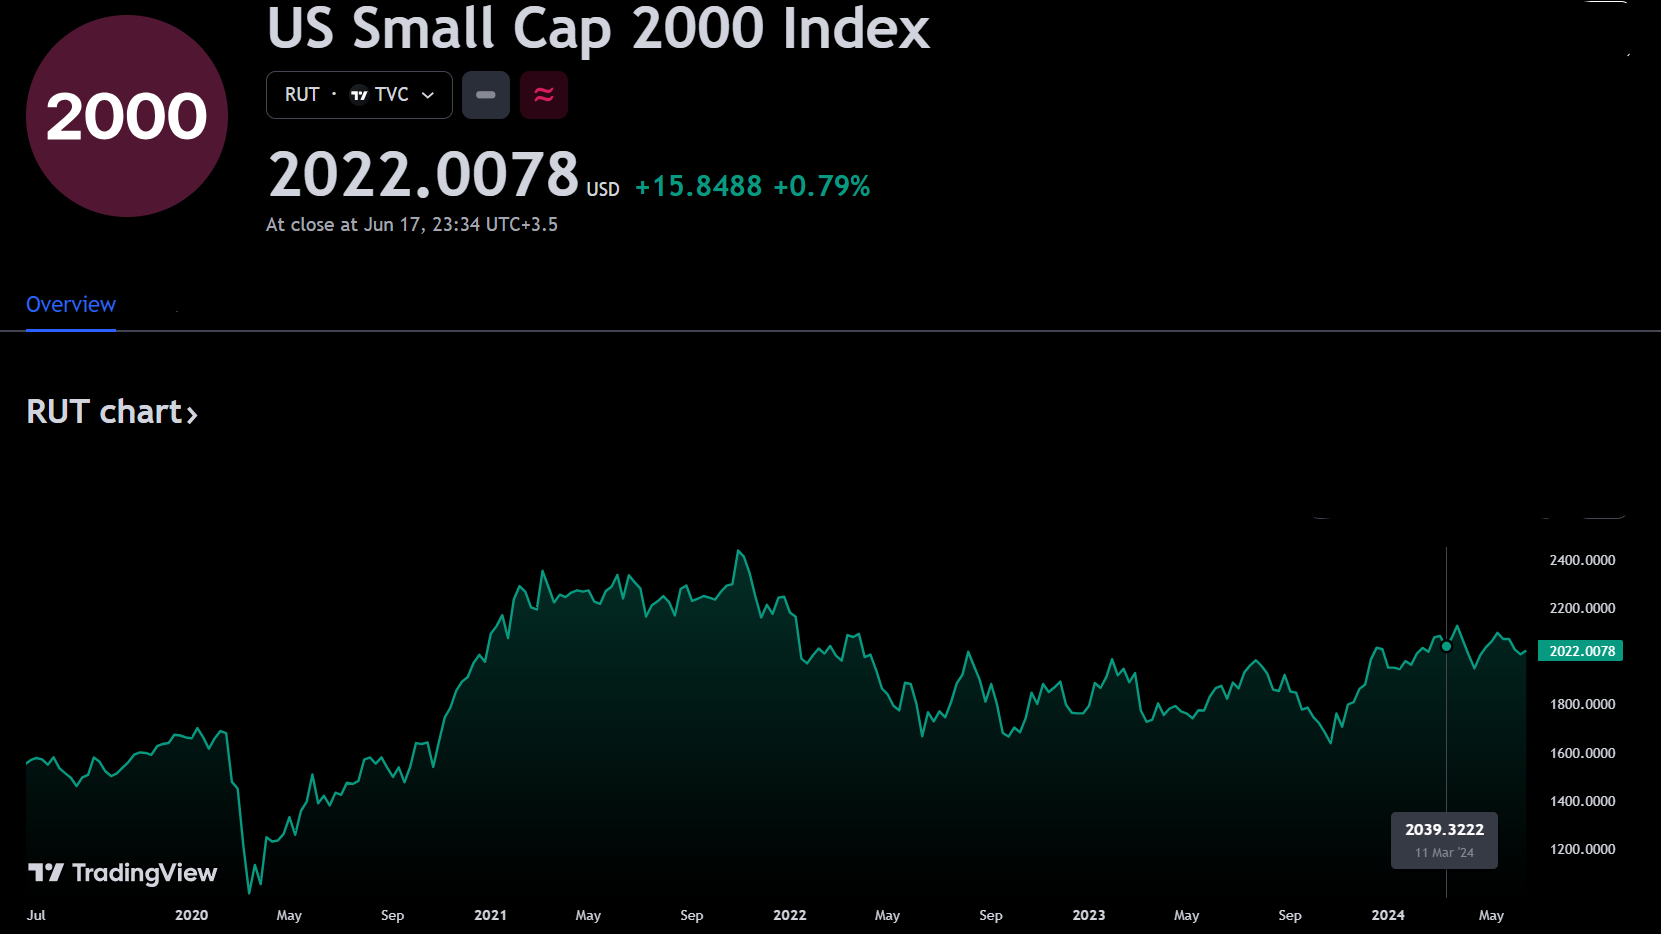
5- The Russell 2000 Index
While other stock market indices focus on the largest companies in a particular segment, the Russell 2000 measures the performance of 2,000 of the smallest publicly traded domestic companies. It measures the performance of the 2,000 smaller companies included in the Russell 3000 Index. The Russell 2000 is managed by London’s FTSE Russell Group. Also, the Russell 2000 is a market-capitalization-weighted index.
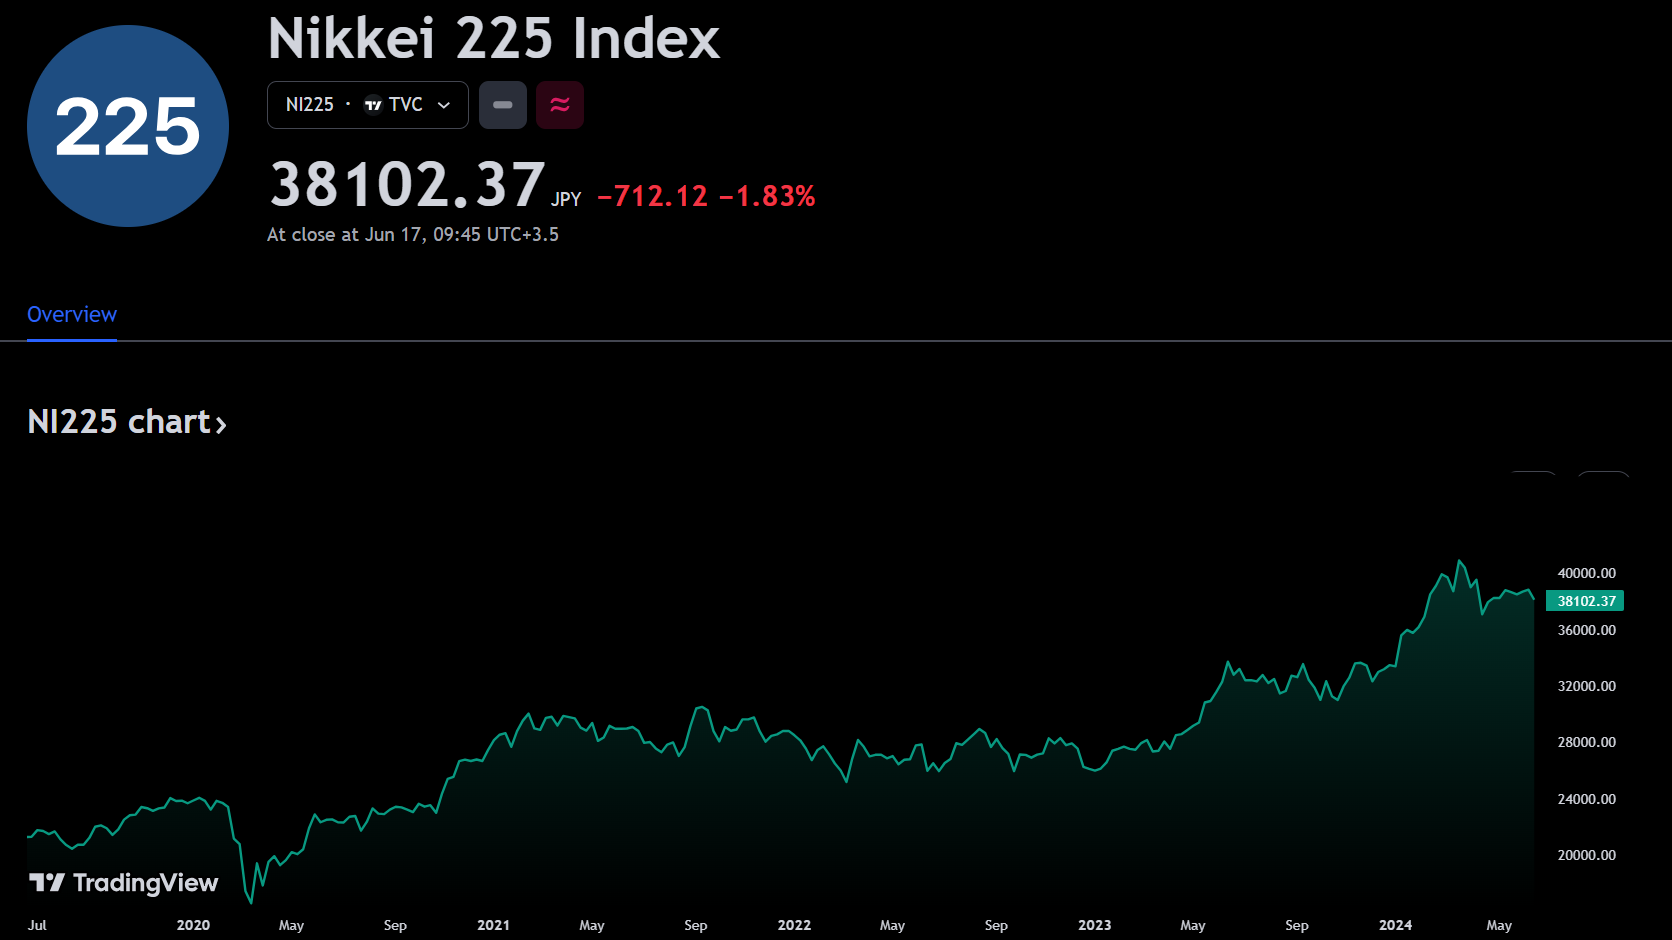
Nikkei 225 Index
The Nikkei 225, commonly referred to as “The Nikkei” is a Japanese stock market index based on the market capitalization of the top 225 companies traded on the Tokyo Stock Exchange (TSE). This is a price-weighted index based on the Yen, and the value has been calculated daily by the Nihon Keizai Shimbun (Nikkei) newspaper since the Index’s inception in 1950. The Nikkei 225 index got its start on September 7, 1950, and was retroactively calculated back to May 16, 1949. Nikkei 225 Futures Contracts got their start on the Singapore Exchange (SGX) in 1986 and then began trading in the United States when they debuted on the Chicago Mercantile Exchange (CME) in 1990. The Nikkei is the most widely quoted index when referring to Japanese equities, followed by the Topix which seeks to track all 1,669 companies listed on the first section of the Tokyo Stock Exchange (TSE).
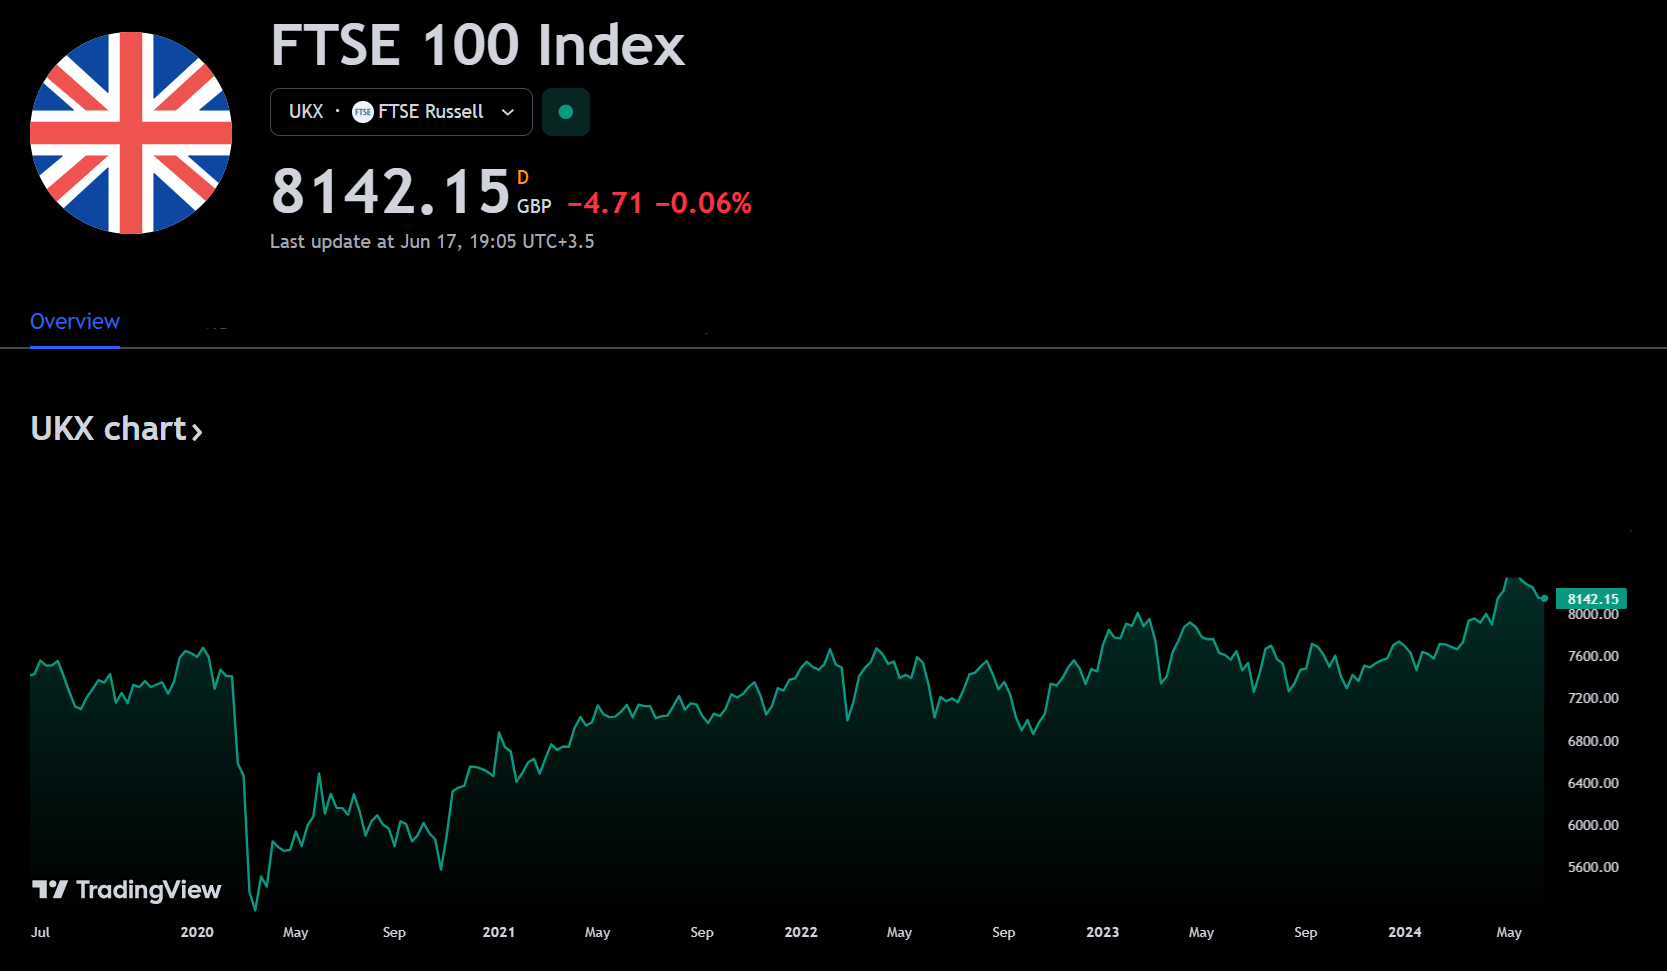
FTSE 100 Index
The UK Financial Times Stock Exchange 100 is an index of share prices of the largest 100 companies listed on the London Stock Exchange (LSE) by market capitalization. The index was launched on January 3, 1984, at a base value of 1000, and the index level is calculated in real-time.
How do you read a stock market index?
Reading an index correctly requires that you look at how the index value changes over time. New stock market indexes always begin with a certain fixed value based on the stock prices on its starting date. Therefore, future index values measure rising and falling prices for those component stocks.
Not all stock market indexes use the same starting value, however, so just measuring index changes by using points can be misleading. For instance, if one index rises 250 points in a day while another rises just 10 points, it might seem as though the first index performed far better. However, if the first index started the day at 25,000 while the second index was at 250, then you can see that in percentage terms, the gains for the second index were far greater. A higher percentage gain means a bigger profit for you if you invest in funds that track the index. So, it’s better to focus on percentages than on point movements.
Moreover, even the most popular stock market indexes don’t generally measure the performance of the entire market. Knowing which stocks are in an index can tell you which parts of the stock market are contributing to that index’s performance and can explain why other indexes might not be performing the same way.
What are the uses of stock market indexes?
Stock market indexes can be useful to follow for a few key reasons:
Tracking the most-followed stock market indexes can give you a general sense of the health of the overall stock market.
Tracking lesser-known indexes can help you see how a particular segment of the market is performing compared to the market as a whole.
If you don’t want to invest in individual stocks but rather simply want to match the performance of the overall market, then a cost-effective way to earn solid returns over time is by investing in index funds that track the stock market indexes you’re most interested in.
Stock market indexes make it easier to know how the market is performing without having to follow the ups and downs of every individual stock. They also open up simple trading opportunities that even novice traders can use to participate in the success of the stock market.
Different Types of Market Indexes
The indexes covered above generally are used as proxies for the overall stock market, there are countless more indexes out there, many of which are tailored to represent very specific segments of the market.
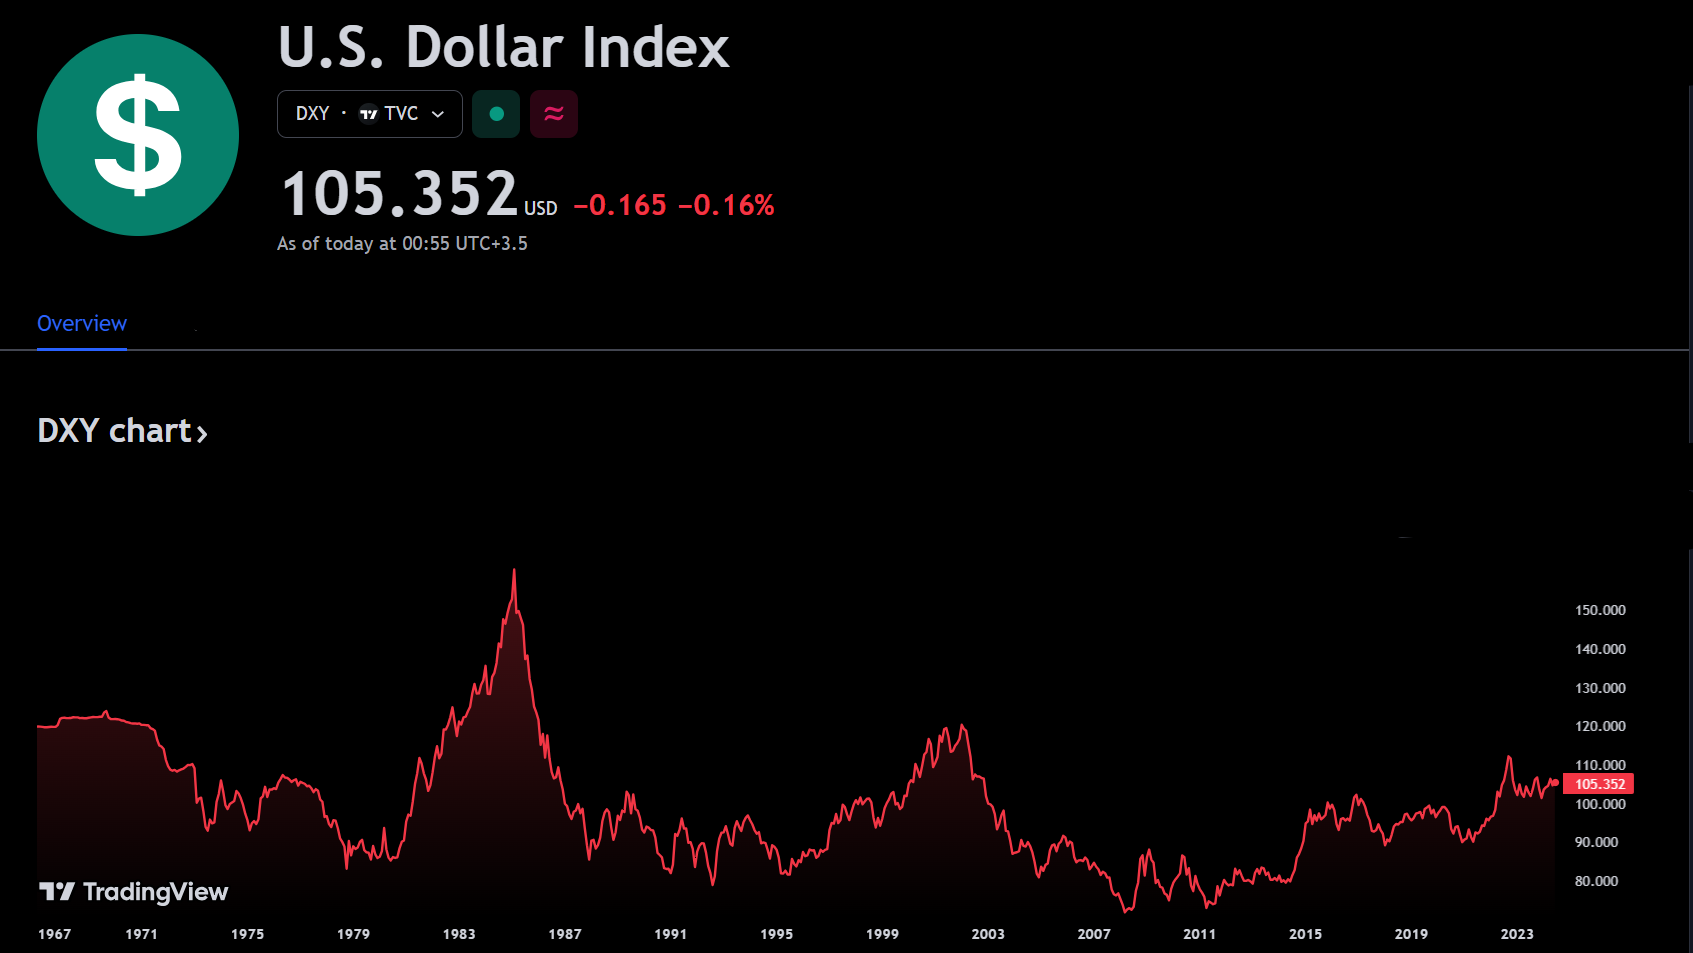
Currency Indexes
The U.S. Dollar Index (DXY) is a currency index that measures the strength of the U.S. dollar relative to a basket of other leading global currencies.
The U.S. Dollar Index tracks the strength of the dollar against a basket of major currencies. DXY was originally developed by the U.S. Federal Reserve in 1973 to provide an external bilateral trade-weighted average value of the U.S. dollar against global currencies. U.S. Dollar Index goes up when the U.S. dollar gains “strength” (value), compared to other currencies. The following six currencies are used to calculate the index:
- Euro (EUR) 57.6% weight
- Japanese yen (JPY) 13.6% weight
- Pound sterling (GBP) 11.9% weight
- Canadian dollar (CAD) 9.1% weight
- Swedish krona (SEK) 4.2% weight
- Swiss franc (CHF) 3.6% weight
Environmental, Social, and Governance (ESG)
ESG indexes focus on companies that score well on measures of how they treat the environment, their employees, their management and society at large.
Global Indexes
As their name implies, global indexes allow you to track the collective performance of all of the companies in the world.
National Indexes
Just as the major stock market indexes above track the performance of the U.S. market, there are indexes following the highs and lows of companies in almost every country.
Growth Indexes.
Growth indexes track the performance of leading growth stocks, or those stocks of companies that are targeting faster growth than the overall market.
Value Indexes.
Value indexes, on the other hand, group together companies that are thought to be undervalued by investors based on their finances.
Sector Indexes.
Sector indexes are built to track the performance of specific industries, like technology, finance, healthcare, consumer goods and transportation.
Advantages of Indices
Indices offer several advantages, particularly in the context of trading:
- Useful tool for gauging a particular market’s performance: Market indexes provide a fairly accurate assessment of how that particular sector is currently moving.
- Provides a good baseline for investment comparisons: You can assess your portfolio against an index to see if it is performing up to your expectations.
- Helpful for market forecasting: Economists and investors can look at how different indexes responded to particular market forces in the past to predict how they might respond in the future.
- A less expensive investing option: Because index funds passively follow their market index, they come with fewer fees.
Final Words
Stock indexes serve as vital benchmarks in the financial markets. They reflect the performance of a basket of securities and providing insights into market trends. Also, they are constructed using various methodologies, such as price-weighting or market-cap weighting, to represent different segments of the market. Popular indexes like the Dow Jones index, S&P 500, and Nasdaq Composite are widely followed for their comprehensive coverage of the U.S. stock market.
Traders use these indexes to gauge market movements, compare investment performance, and develop passive index funds. The recent analysis suggests that while indexes are influenced by macroeconomic factors and traders sentiment, they remain a reliable indicator of overall market health. As such, they continue to be an essential tool for both individual and institutional traders in making informed decisions.
Index performance can vary based on numerous factors. For detailed insights, it’s advisable to participate in our practical program to provide a comprehensive education in trading, with access to our private community. Inside, you’ll have access to live mentorships, Q&A, and expert talks. So, get the knowledge and skills you need to make profitable trades with MTC Incubator.
FAQs
- What do you mean by stock index?
Indexes are constructed using a standardized methodology and are used to track the performance of a basket of securities. (like the S&P 500 or Dow Jones index) - What is a stock index example?
A stock index is a collection of stocks that represents a particular market or sector. For example, Dow Jones Index, S&P 500 and Nasdaq 100. - What is the difference between a stock and a stock index?
A stock represents ownership in a single company, while a stock index is a collection of stocks that represents a segment of the market or the entire market. For example, if you own shares of Apple Inc., you own a part of that company. But if you invest in an index fund that tracks the S&P 500, you own a small part of all 500 companies in the index, which gives you exposure to a broader market segment - Is a stock index the same as an ETF?
No, a stock index and an ETF (Exchange-Traded Fund) are not the same, although they are related. Stock index represents the performance of a specific market or sector and is used as a benchmark to gauge the overall market trends. Although An ETF is a type of investment fund that holds assets such as stocks, commodities, or bonds and is traded on stock exchanges, much like individual stocks. - Is the S&P 500 an index fund?
No, the S&P 500 itself is not an index fund; it is a stock market index that measures the stock performance of 500 large companies listed on stock exchanges in the United States. However, there are index funds that track the S&P 500, such as the Vanguard 500 Index Admiral Fund (VFIAX).