
The cup and handle pattern is one of the most promising chart formations out there, especially for traders looking for a solid continuation signal. It’s known for its ability to predict those “green days” in the market—who doesn’t love that? And let’s face it, it’s also one of the most uniquely shaped patterns, because how many chart formations resemble something you drink from during your trading sessions? Not many, right?
But how exactly does this pattern form? What confirms its validity, and what factors make it a more reliable continuation signal? These are the key questions we’ll dive into in this article. We’ll also take a look at how to trade the cup and handle pattern with optimal entry and exit points to maximize your gains.
Stick with us till the end—this read’s definitely going to be worth it.
Table of Contents
Cup and Handle Anatomy
Before we dive into the advanced details, let’s start by building from the ground up—because, honestly, what better place to start than by understanding the anatomy of the pattern? I mean, it’s literally the foundation of everything we’ll discuss.
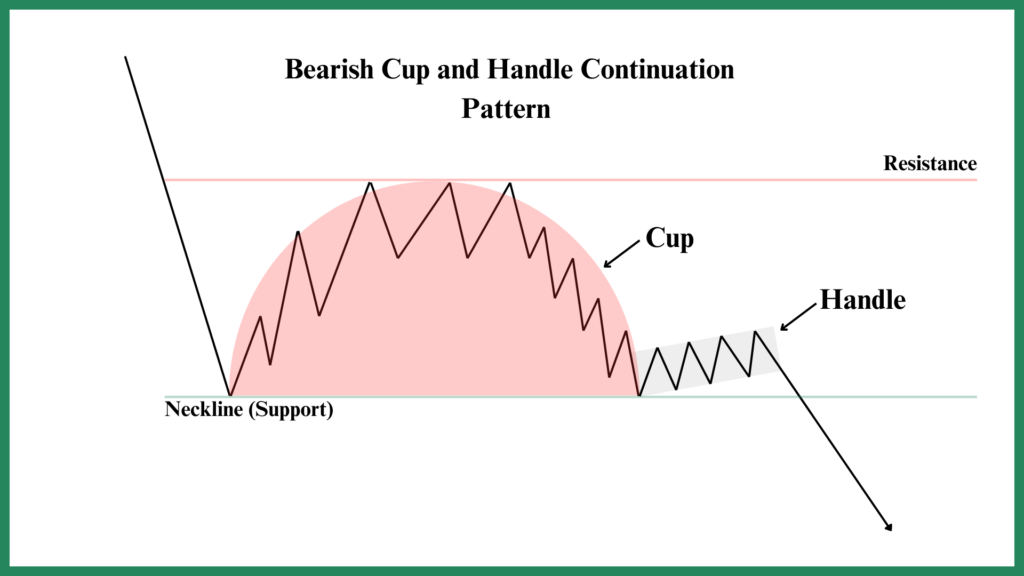
Now, it’s important to note that the cup and handle pattern has both bullish and bearish variants. We’ll start with the basics, though. The standard anatomy of the pattern consists of, you guessed it, a cup part and a handle. (Shocking, right? A pattern with a cup and handle—who saw that coming?)
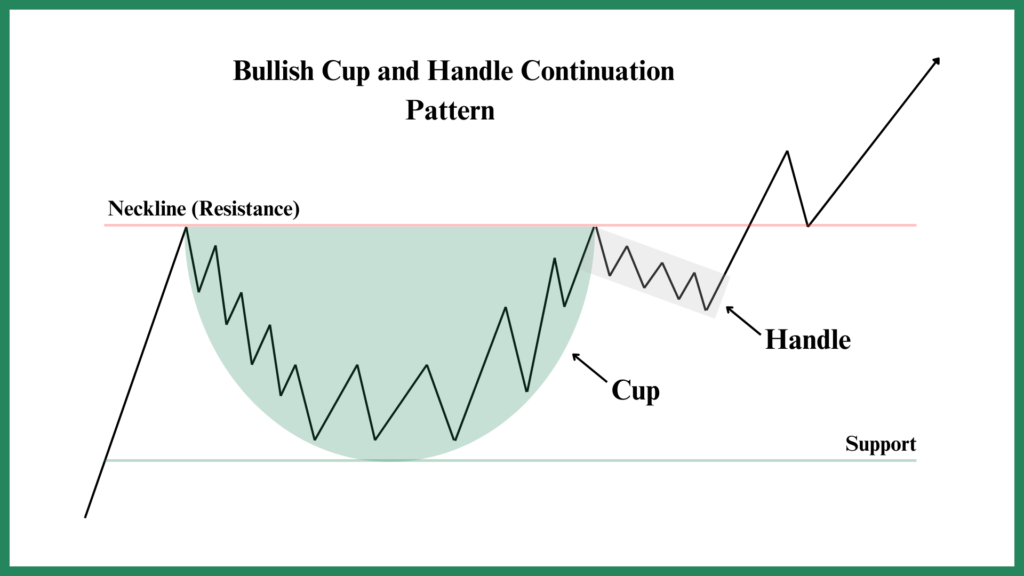
At the top of the pattern, you’ll find the neckline, which plays a key role in confirming the pattern. Think of it as the “checkmark” for the pattern’s legitimacy.
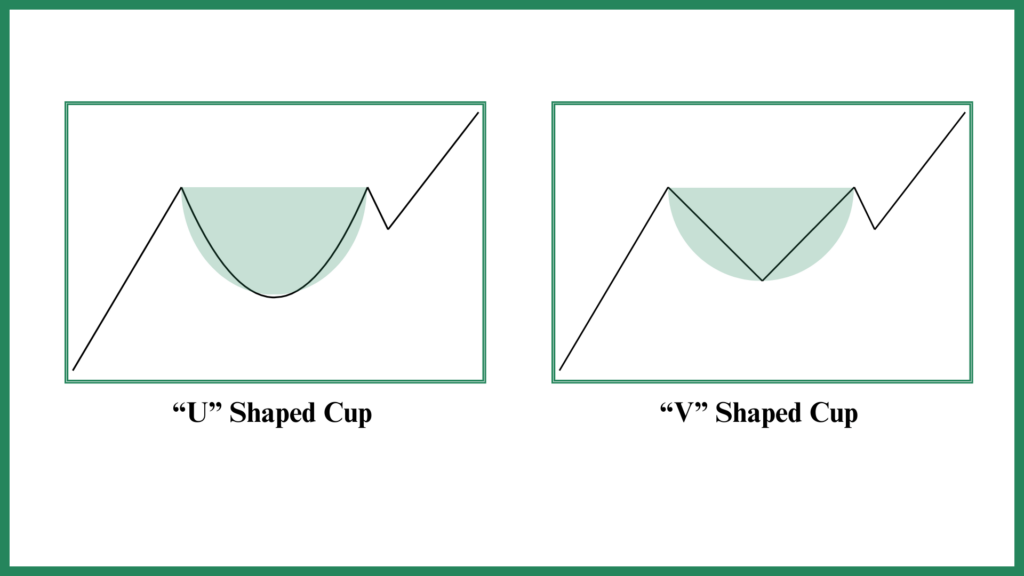
Now, let’s talk specifics. The cup itself can either be a “U” shape or a “V” shape. Both are valid; it’s just a matter of how the market decides to shape up. Though generally, the “U” shaped cups are considered more valid.
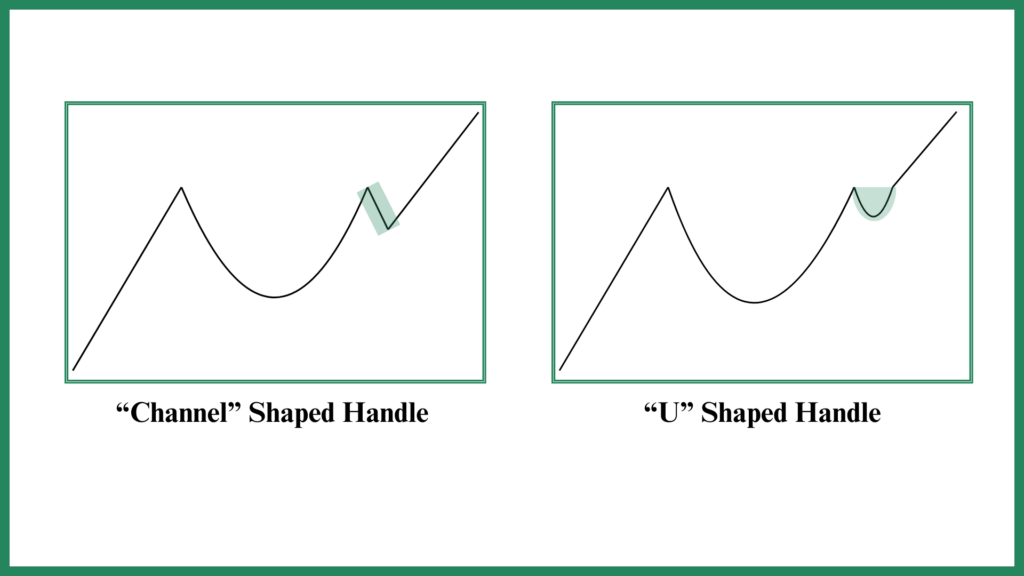
The handle, on the other hand, can look a little different depending on the scenario. It could be “U” shaped, like the cup, or it could resemble a channel moving in the opposite direction of the trend.
But here’s the thing: the shape of the handle doesn’t really impact the pattern’s reliability. What does matter, though, is the handle’s size. A rule of thumb: the handle shouldn’t cover more than 50% of the cup’s width. Ideally, you want the handle to be somewhere between 25% to 33% of the cup’s width. Keep that ratio in mind, and you’ll be on the right track.
Of course, all of this applies to the bearish variant (Inverted Cup and Handle) as well, only it’s flipped upside down.
How Does the Cup and Handle Pattern Form?
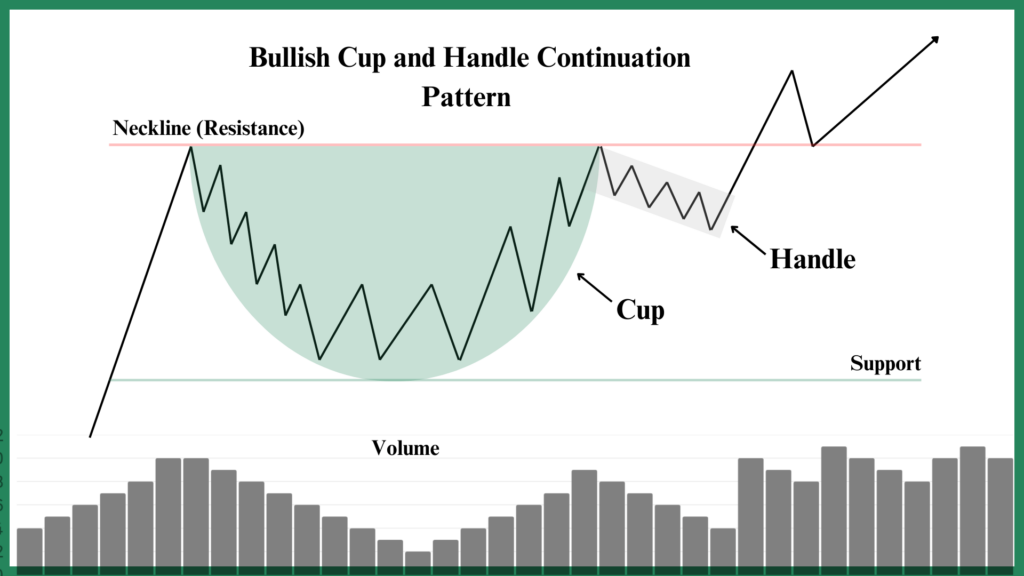
The cup and handle pattern tends to form in the middle of an uptrend. Think of it as a quick “breather” for the bulls before they take off again. It’s almost like the market is catching its breath before charging ahead. But what makes this pattern even more intriguing is the role of trading volume—and trust me, it’s not just background noise.
When the price reaches the left side peak of the cup, you’ll notice that trading volume is relatively high. But as the price starts forming the cup, volume dips. It keeps decreasing all the way to the midsection of the cup. Then, as the price begins to rise again, the volume picks up, signaling that the bulls are getting back into action.
So, in simple terms, the “U” shape of the cup should ideally be visible both on the price chart and in the volume chart. When the price hits the right side peak of the cup, volume should also peak. As the price drops to form the handle, volume dips again. Pretty predictable, huh?
You’re starting to see a pattern, right? Every time the price rises, volume rises. Every time the price falls, volume falls.
As you can see in the image, the cup and handle pattern typically forms between two key support and resistance zones. The pattern becomes valid when the price breaks through the resistance zone after completing the handle.
Inverted Cup and Handle
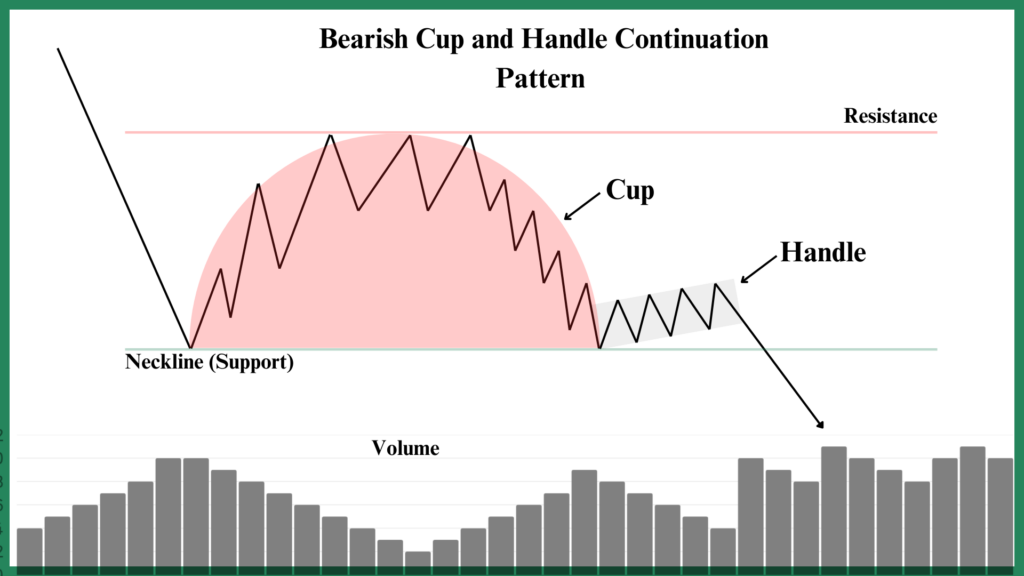
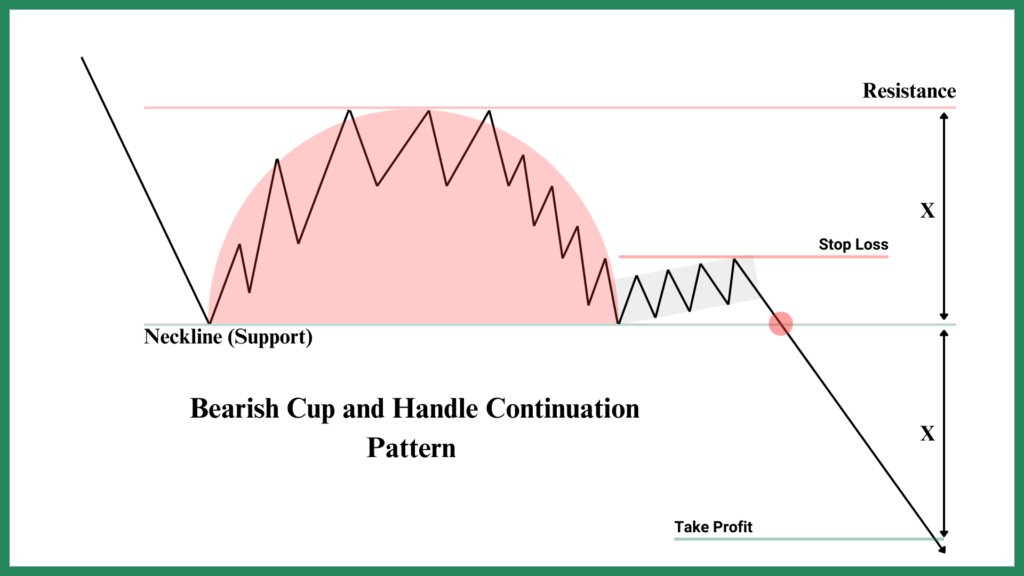
The inverted cup and handle pattern, while similar to its bullish counterpart, signals a continuation of a downtrend. Essentially, it’s the bearish version of the bullish cup and handle—just flipped upside down. Once you’re familiar with the bullish pattern, the inverted version is much easier to grasp. It’s the same concept, just in reverse, with the price moving down rather than up.
In the inverted pattern, trading volume follows a similar path to the bullish version. When the price reaches the left valley of the inverted cup, trading volume spikes. This signals that bears are becoming more active, selling off and driving the price lower. As the price starts to form the Dome shape of the inverted cup—marking a temporary rally against the trend—volume dips. During this time, the market is taking a pause, and fewer traders are interested in jumping in, especially as the price rises in the wrong direction.
As the price begins to go up again and forms the handle, volume stays low. This is a crucial moment because the lower volume suggests that although the price might temporarily rise, there isn’t enough buying interest to sustain the move. The real action happens when the price finally breaks downward through the support zone after completing the handle. At this point, volume picks up once again, confirming the bearish breakout and signaling that the downtrend is set to continue with more strength.
So, just like the bullish cup and handle, volume in the inverted version behaves in a way that supports the pattern’s direction. When the price trends in the direction of the pattern—down in this case—volume rises. When the price moves against the trend, forming the cup and handle, volume drops. The critical point is when the price breaks through the support zone, accompanied by a volume surge, confirming that the pattern is valid and the downtrend is likely to continue.
Trading the Cup and Handle
Trading the cup and handle pattern isn’t anything too out of the ordinary, especially if you’re already familiar with trading other chart patterns. Once you understand the key elements of this formation, you’ll find that trading it becomes second nature. So, how exactly do you trade the cup and handle pattern?
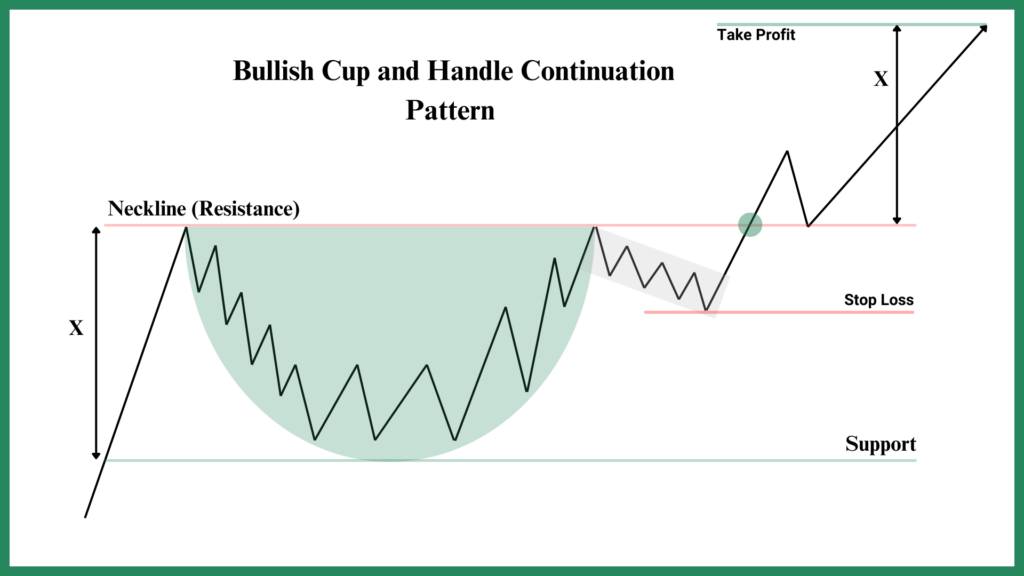
First things first, the pattern needs to be confirmed. That means the neckline resistance must be broken with high volume and sufficient momentum. The breakout is the moment you’re looking for—it’s when the price moves above the neckline, signaling that the pattern is valid. Now, if you see that volume and momentum are significantly high, this is your green light to enter a long position right away.
However, if the volume is lackluster or if you suspect a bull trap, you might want to wait for the “last kiss.” This is when the price breaks through the resistance and then briefly pulls back to retest the broken level. If the price holds up at the neckline, this retest strengthens the breakout, and it’s often a safer entry point for your trade.
Once you’ve entered the trade, the take profit point is simple and follows the same principle used in other classic patterns. Measure the cup depth—or the width of the pattern—and expect the price to rise by roughly that same amount once you’re in the position. For example, if the cup depth is $5, you can expect a target price of $5 above your entry point.
As for the stop loss, it largely depends on your own risk tolerance and trading strategy, but a common recommendation is to place the stop just below the handle. This way, you’re protecting yourself in case the market doesn’t follow through with the breakout, but still giving the trade enough room to develop.
When it comes to the inverted cup and handle pattern, the trading techniques for the bullish version apply just the same—just flipped. You’ll be looking for the same confirmation of a breakout below the neckline with high volume and momentum, and the same entry, take profit, and stop loss strategies. The only difference is that, instead of entering a long position, you’ll be entering a short position to profit from the downward movement.
Final Thoughts
The cup and handle pattern is undeniably one of the most unique and easy-to-spot formations in technical analysis. With its distinct shape and clear structure, it’s a pattern that can quickly become one of your favorites. While it’s certainly effective and often reliable, no pattern is perfect—markets have a mind of their own, and sometimes, they don’t quite follow the script. As always, there’s a chance of failure, and it’s essential to manage your risk appropriately.
If you feel confident in your understanding of the cup and handle pattern, why not start spotting it on real charts? And who knows, if the stars align, you might even get a few successful trades out of it. Remember, trading is as much about patience and practice as it is about knowledge. So, go ahead, put what you’ve learned into action, and as always, happy trading!
FAQ
The cup and handle pattern is a continuation chart pattern that signals a bullish breakout. It resembles a “cup” followed by a “handle,” indicating a pause before the trend continues upward.
Trade by confirming the breakout above the neckline with high volume. Enter a long position if momentum is strong. Place your stop loss below the handle, and set your take profit based on the cup’s depth.
The handle represents a brief consolidation or pullback, where price corrects after the cup formation before breaking out to continue the trend. It typically forms on lower volume and should not exceed 50% of the cup’s width.
Yes, the inverted cup and handle pattern is the bearish version. It forms in a downtrend and signals a continuation of the bearish market once the neckline is broken to the downside.
While the cup and handle pattern is effective, no pattern is foolproof. It relies on volume and momentum, but market conditions can still cause failure. Proper risk management is crucial when trading this pattern.