

The breakout and retest strategy is one of the most widely used and reliable trading techniques. If you’ve been following along, we’ve already covered the basics of breakout trading in our last post: how to identify breakouts, confirm them, and eventually trade them for profits. But if you’re looking for a strategy with an added layer of safety, the breakout and retest approach is exactly what you need.
Think of it as the breakout strategy’s more cautious counterpart. one that takes a step back to ensure the market has truly committed before you jump in. It’s designed for those who prefer to wait for further confirmation after the initial breakout, ensuring a stronger setup before entering a trade. In other words, it’s like making sure the door is securely closed and locked before you walk away.
In this post, we’ll explore the breakout and retest strategy in detail, discuss its different variations, and explain how you can incorporate it into your trading for improved accuracy, a higher win rate, and greater profitability.
Table of Contents

What is Breakout and Retest Strategy?
By now, you’re likely familiar with the concept of a breakout. Breakout is the moment when the price finally breaks through a major support or resistance level, signaling potential momentum in a new direction. In our previous post, we covered how to trade breakouts and capitalize on these moves. But while breakout trading can be highly profitable, there’s an even safer way to approach it: adding a retest to your strategy. This simple addition can significantly increase your chances of winning trades.
So, what exactly is a “retest”? A retest occurs when the price returns to “test” a critical level that it has previously broken. To put it into context, a test happens when the price repeatedly hits a major support or resistance level, trying to break through but getting rejected each time. The price tests these levels without success, and the market stays within a range. Until, eventually, a breakout happens.

Let’s break this down with an example of an upward breakout at a major resistance level. Imagine the price is rising steadily until it meets a resistance ceiling. The resistance level pushes back against the price, causing several rejections or “tests.” But once the price finally breaks through this resistance, that same level is no longer resistance. It now becomes support for the price above it.
Now, here’s where the retest comes into play. After breaking out, the price may continue upward for a short while, only to come back down and test this newly created support level (which was the previous resistance). If the price “retests” this level and successfully bounces back up, you’ve got a clean and healthy breakout and retest pattern. This gives you a much more reliable signal to enter your long position, as it confirms that the market has truly broken past the old resistance.
Now that we’ve covered the basics, we’ll go through two distinct scenarios: a bullish breakout and retest, and a bearish breakout and retest.
Bullish Breakout & Retest
There’s nothing quite like a real example of a bullish breakout and retest to reinforce those learnings. Theory is great, but seeing it play out on a chart is where the pieces really come together.
In the provided image, you’re looking at Tesla’s 1-hour price chart, where the price has been moving within a defined range, bouncing between a resistance level of $177 and a support level of $152.
Initially, the price successfully tests the support at $152, holding firm before climbing back up to $177 to test the resistance. Again, the resistance holds strong.
However, the next time the price approaches the $177 mark, a breakout occurs. The price pushes beyond resistance, soaring up to around $192 before retracing back down to retest the newly established support at $177.
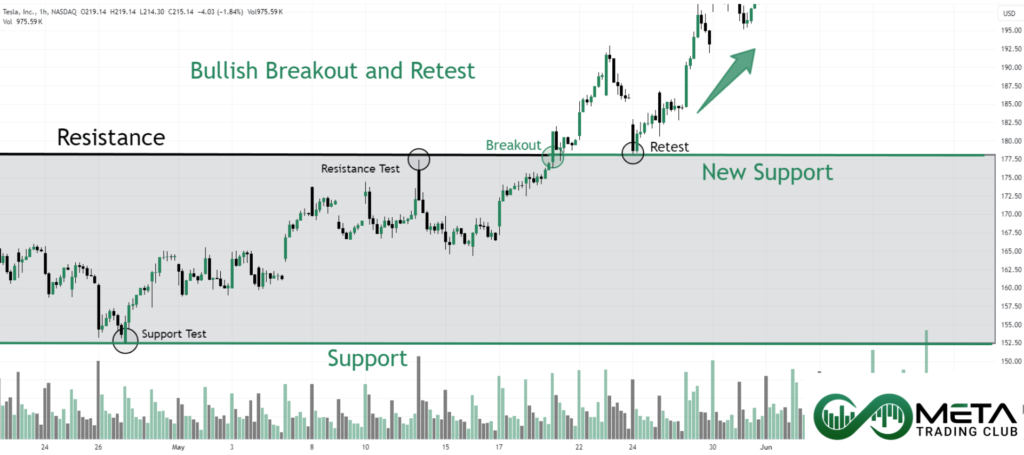
This retest is successful, confirming the breakout, and the $177 level now holds as support. Following this confirmation, the price resumes its upward momentum as bullish traders rally, marking a successful breakout and retest pattern.
Bearish Breakout & Retest
Now that you’re familiar with the bullish breakout and retest, learning the bearish variation is much easier, it’s essentially the same concept, just flipped on its head. If you can understand one, you can definitely grasp the other.
In the image provided, you’ll see a bearish breakout and retest formation on Bitcoin’s 4-hour chart. Here, Bitcoin’s price has been trading within a range, bouncing between a resistance level at $74,000 and a support level at $68,000.
Initially, the price tests the $74,000 resistance, but it doesn’t break through. It then moves down towards the $68,000 support level. At first, there’s a fakeout, where the price briefly dips below $68,000, only to rebound slightly. But shortly after, the real downward breakout occurs, and the support at $68,000 is decisively broken.
This previous support now flips into a newly established resistance level. After some time, the price retests this new resistance at $68,000, and the level holds firm, rejecting the price, which then drops further to the $60,000 mark.
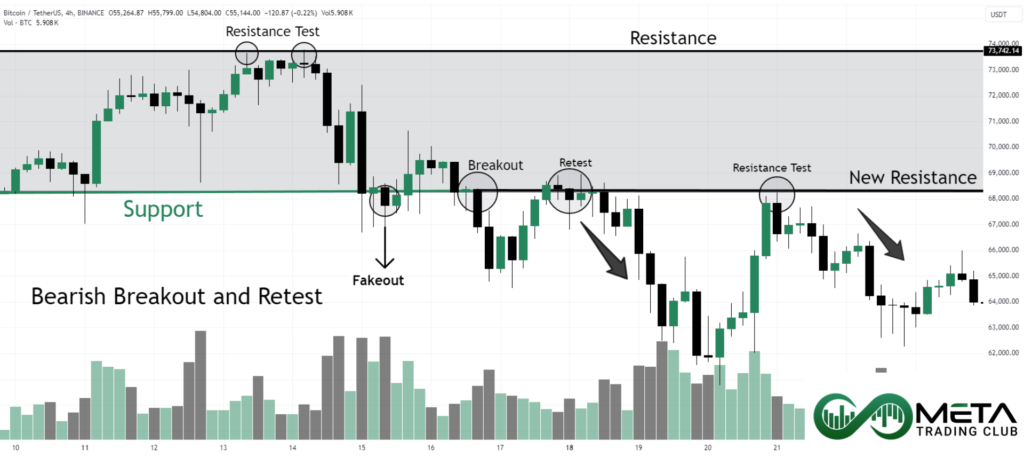
But that’s not the end of the story. As you can see, the price doesn’t break below $60,000. Instead, it climbs back up for a second test of the $68,000 resistance. Once again, the resistance stands strong, and the price is rejected, moving downwards once more.
How to Trade Breakout & Retest?
In our last post on breakout trading strategy, we dug into the nitty gritty of breakouts and mentioned retests as a key way to confirm that the market is ready to let go of the past trend and embrace a new move. Basically, a retest is like the market sending you a reassuring text saying, “Yep, we’re moving on.” It’s a massive confirmation that gives you more confidence to hop into a trade, making it safer and less prone to falling into a trap.
Now that we’ve covered the basics, let’s tackle the real question: how do you actually trade a breakout and retest?
Let’s go with a bullish scenario since it’s easier to wrap your head around. Once you’ve got the hang of that, flipping it to a bearish scenario won’t be too hard. The first step is to spot a valid upward breakout. And when I say valid, I mean an actual breakout, not a fakeout trying to trick you. Fakeouts are like those “too good to be true” ads, you think you’re getting a deal, but nope, it’s just fluff. To avoid falling for fakeouts, look for a strong upward breakout backed by high trading volume and solid momentum. If you’re unsure what qualifies, check out our post on breakouts for more clarity.

Once you’ve identified a legit breakout, don’t rush in right away. The next step is to wait for the price to reverse and retest the broken resistance level (which now becomes the new support). The idea here is to see if the market respects this new level, kind of like making sure the new table you’re about to lean on isn’t wobbly. If the price holds and respects this new support level, the coast is clear. That’s your signal to enter a long position.
But let’s not get too excited, safety comes first. Proper risk management is essential. You wouldn’t jump out of a plane without a parachute, right? The same goes for trading. Make sure you’re using a tight stop loss, proper position sizing, and always stick to your loss limit. For the stop loss placement in this setup, we recommend setting it around 5% below the broken resistance (now support). If your personal loss limit doesn’t allow for that much wiggle room, don’t break your rules. Adjust the stop loss accordingly, but always keep it aligned with your risk tolerance.
Now, for your exit strategy. When should you take profits? One easy approach is to target the next resistance level in line. But if you’re feeling more adventurous, you can use the Fibonacci tool to anticipate future resistance points or simply measure the width of the previous channel and add it to the breakout price. Both methods give you an idea of where the market might be heading next.

If you prefer to keep a close watch on your trades, you can set your stop loss and take smaller profits along the way. As the price moves in your favor, you might also want to move your stop loss up to your entry point, which essentially makes your position risk free. This way, you can ride the trade without the fear of losing any of your initial capital.
And there you have it, that’s how you trade breakouts with a retest. Stick to the strategy, manage your risk carefully, and you’ll be better positioned to succeed!
Final Words
To wrap things up, let’s quickly revisit the key points. We’ve talked about breakouts, which are those moments when the price moves beyond a significant support or resistance level, signaling the potential start of a new trend. But not every breakout is the real deal, which is where confirmation comes in. A retest helps confirm that the breakout is solid by checking whether the price respects the new support or resistance level. If the retest holds, it’s a great sign that the market is moving in the direction of the breakout, giving traders a safer opportunity to jump in.
By combining breakouts with retests, traders can reduce the risk of getting caught in a fakeout and improve their chances of entering a trade at the right time. It’s all about waiting for that extra confirmation and managing your risks smartly.
But here’s the thing, this strategy might not be everyone’s cup of tea. Trading isn’t a one-size-fits-all game. If you find that this approach doesn’t match your trading style or comfort level, don’t sweat it. There are plenty of other strategies out there, the key is finding what fits your style and sticking with it. So, if this isn’t the one for you, keep exploring!

FAQ
A breakout occurs when the price moves beyond a key support or resistance level, signaling the potential start of a new trend.
A retest is when the price revisits a recently broken support or resistance level to confirm its validity in the new trend.
This strategy involves entering a trade after a breakout, but only once the price has successfully retested the broken level to confirm the breakout’s strength.
The best approach is to wait for confirmation, such as a retest, use proper risk management, and ensure the breakout is backed by high trading volume.
First, identify a valid breakout with strong momentum. Then, wait for the price to retest the broken level before entering the trade, using risk management techniques like stop-loss orders.