Patterns are created through the price movements on a chart and identified through technical analysis. There are thousands of chart patterns but they all fall under two broad categories: reversal patterns and continuation patterns.
Reversal Patterns
A pattern that signals the change in the existing market trend is called Reversal pattern. The existing trend first takes a pause and then the momentum of the trend changes in opposite direction as it was before to the pause. This helps traders to take a decision to either enter or exit the trade.
Continuation pattern
A continuation pattern indicates a brief halt in the ongoing market trend, after which it suggests that the price of a stock will resume its previous direction. These patterns are significant for traders as they can indicate whether a trend is likely to persist, offering opportunities for making trade decisions.
Few examples of different type of patterns:
Double tops
This pattern looks like the letter “M”. It signifies a bearish reversal, indicating that the price is likely to fall after failing to rise past two highs. The level just below the two peaks can be seen as a support line, and if the price falls below this after the second peak, it confirms the pattern.

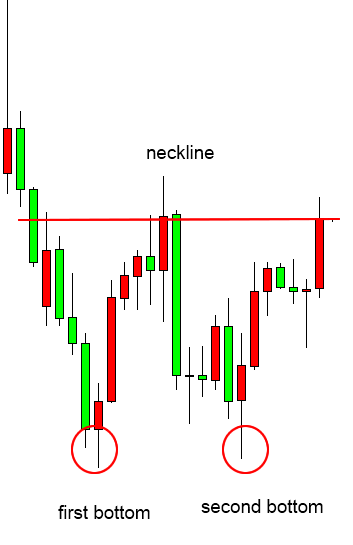
Double Bottoms
Resembling a “W”, this pattern is a bullish reversal, suggesting the price will rise after failing to fall below two lows. The level just above the two lows acts as a resistance line, and if the price rises above this after the second low, it confirms the pattern.
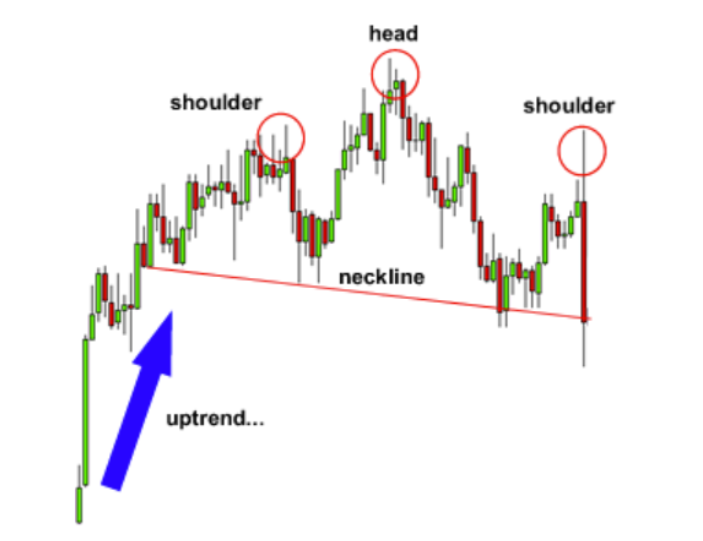
Head and Shoulders
This pattern has three peaks: the middle one (head) is the highest and the two others (shoulders) are lower. In a regular head and shoulders pattern, which is a bearish reversal signal, the trend line beneath the three peaks (the neckline) breaks and the price is expected to fall. Conversely, an inverse head and shoulders pattern is bullish.
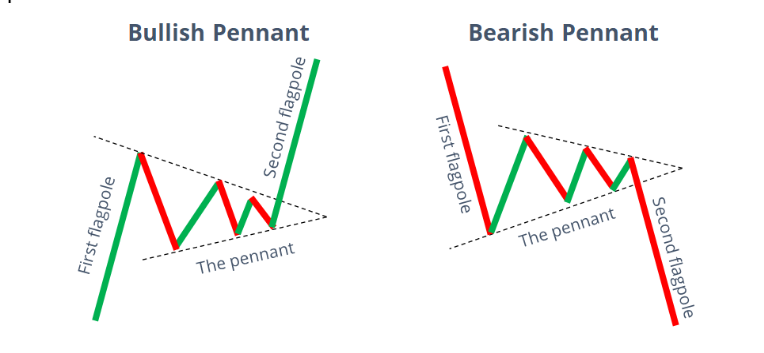
Pennants
These small, symmetrical triangles form after a sharp move in the price and suggest a continuation of the trend. A bullish pennant follows a strong price rise, and a bearish pennant follows a sharp price fall. The price breakout from the pennant will typically continue in the same direction as the trend before the pennant formed.
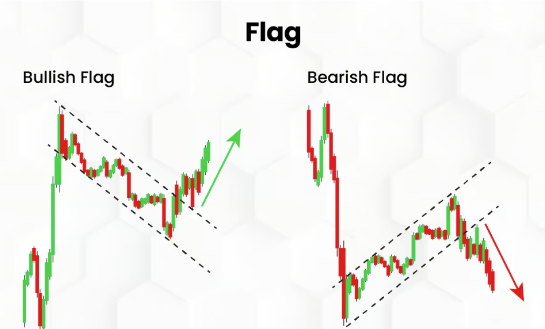
Flags
Flags are continuation patterns constructed using the two parallel trend lines usually those are slope up, down or sideways. A flag with an upward slope(bullish) indicates the downtrend, downward slope(bearish) indicates the uptrend in the market. Typically, these are formed due to declining volume.
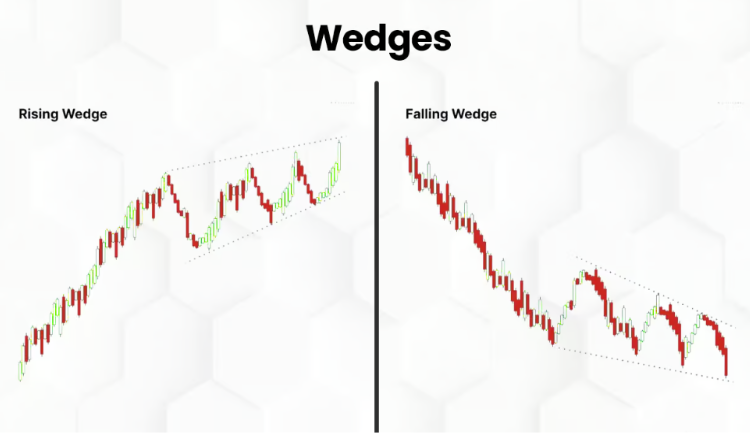
Wedges
Wedges are patterns where the price moves between converging trend lines. Rising wedges typically suggest a downward breakout in an uptrend, signaling a potential reversal, while falling wedges often anticipate an upward breakout, especially in a downtrend, hinting at trend continuation. Volume usually declines as the pattern develops and increases on a breakout, providing additional confirmation for traders.
Ascending Triangles
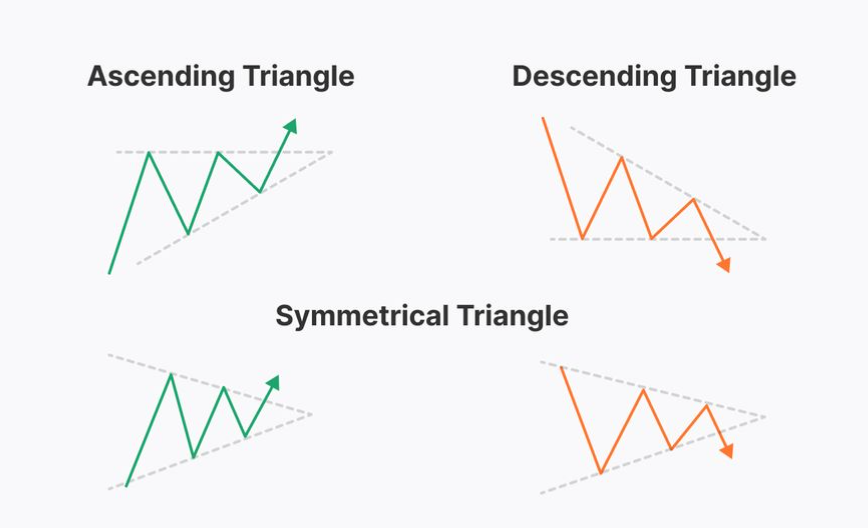
This is a bullish trading pattern. This is formed from a horizontal line connected to a series of highs. They suggest that buyers are more aggressive than sellers, as shown by the higher lows, and are attempting to push the price above a resistance level.
Descending Triangles
These are considered bearish trading patterns. This is characterized by a horizontal line connecting a series of lows and a descending trend line connecting a series of lower highs. These indicate that the sellers are more aggressive pushing the price down.
Symmetrical Triangle
These are considered as neutral patterns.Both sellers and buyers are pushing the price but neither of them have the control. The last breakout point will indicate the price movement of the market.
Bullish Rectangle
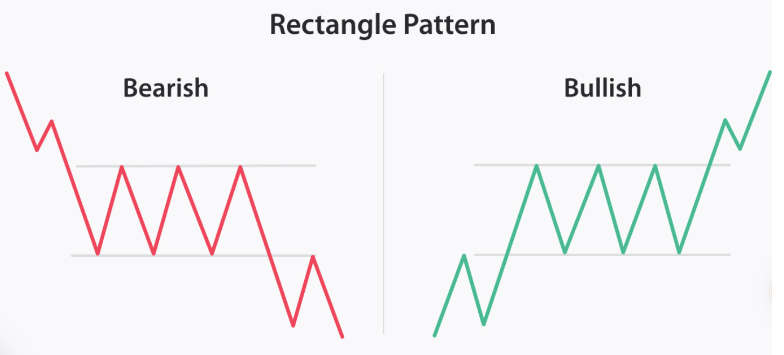
Bullish rectangle is formed during the uptrend between two parallel horizontal lines that represent the support and resistance levels, where the price fluctuates for certain period of time.The bullish rectangle is considered a continuation pattern, suggesting that the uptrend is likely to resume once the price breaks out above the resistance level.
Bearish Rectangle
Bearish is formed during the downtrend and similar to the bullish rectangle. Bearish rectangle indicates that the downtrend is expected to continue after the price breaks down below the support level.
Meta Trading Club is a leading educational platform dedicated to teaching individuals how to trade and invest independently. Through comprehensive educational programs, personalized mentorship, and a supportive community, Meta Trading Club empowers traders to navigate financial markets with confidence and expertise.


