Candlesticks visually display price movements with different colours, aiding traders in making trading decisions. The main goal of candlesticks is to predict the near-future price direction.
The Body: It represents the open and close range of the price.
The Wick: Indicates the high and low of an intra-day.
The colour: Indicates the direction of price movement. Green or white signifies an increase in price, while red or black indicates a decrease.

Price patterns are normally separated into two categories:
Bullish indicates the rise in price of the stock
Bearish indicates the fall in the price of the stock
Basic Candlestick patterns
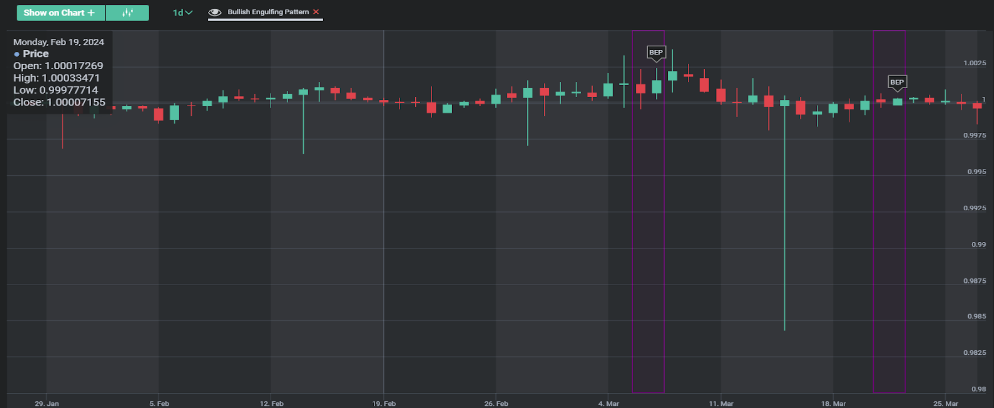
Bullish Engulfing Pattern:
This pattern occurs when buyers outnumber sellers. You can see from the picture below that a small red candle is followed by a large green candle. It usually occurs during a downtrend and suggests a potential rise. Many buyers close deals when they recognize this pattern.
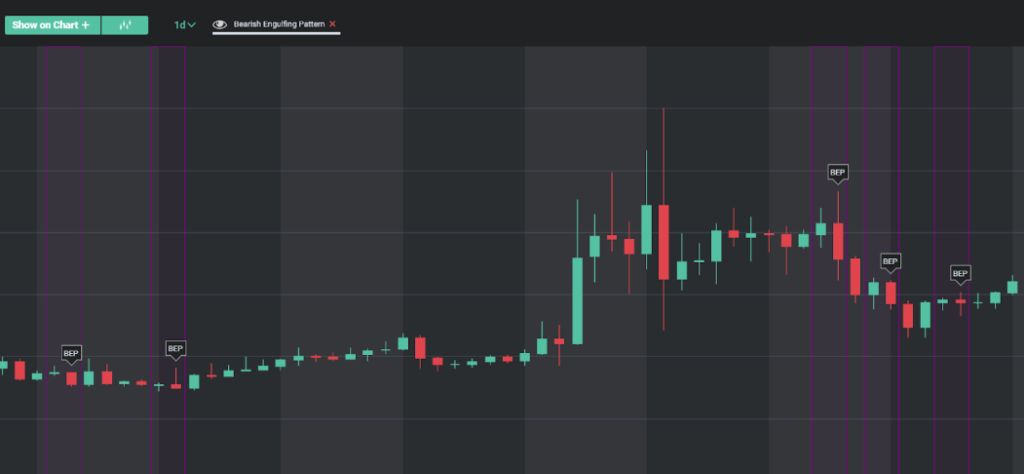
Bearish Engulfing Pattern:
This pattern develops when sellers outnumber buyers. As shown in the picture below, a large red candle completely engulfs a smaller green candle. This pattern follows an uptrend and suggests that a decline will continue.
Bearish Harami pattern:
This pattern signals that there may be a potential change in the trend from an uptrend to a downtrend. It is the opposite of the bullish version, where a small red candle occurs inside a large green candle from the previous day, as we can see below.

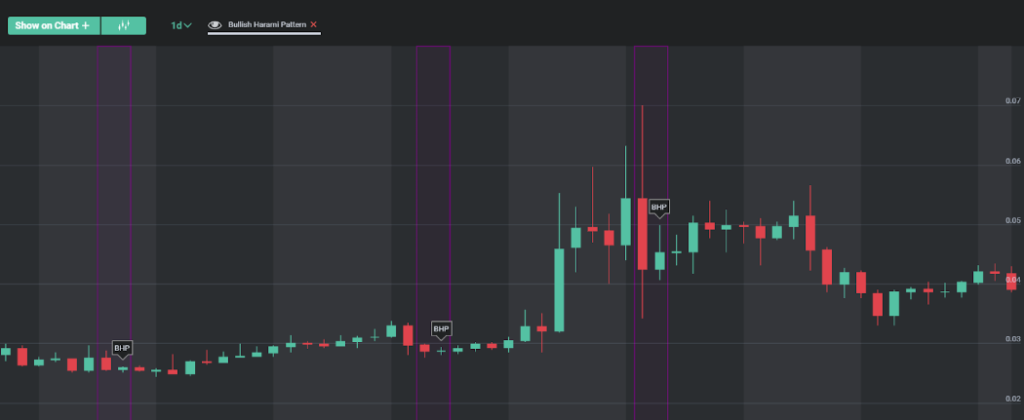
Bullish Harami Pattern:
It indicates a trend reversal in an ongoing downtrend. It is a pattern where a small green candle occurs inside a large red candle from the previous day. Following this pattern, there is usually an increase in price and an upward trend.
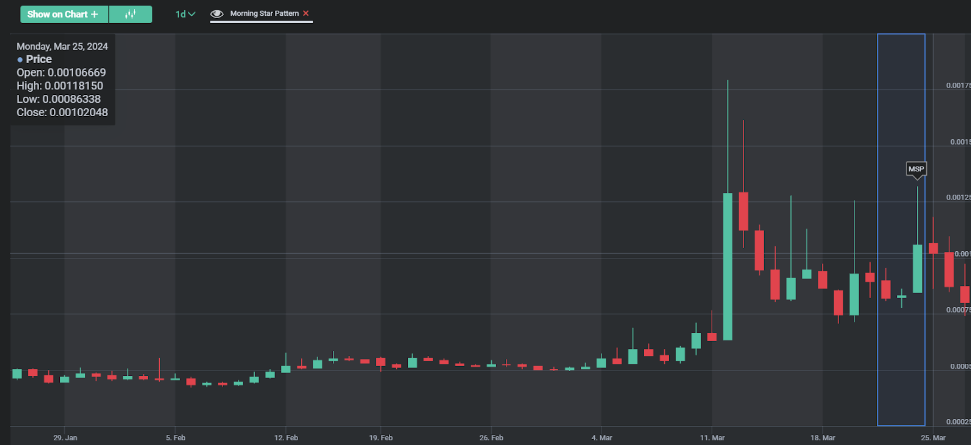
Morning star pattern:
This pattern is initially identified by a long green candle followed by three small red candles within a certain price range, concluded by another green candle closing above them, as seen in the picture below. This pattern signifies that an uptrend in the price is likely.
Evening star pattern:
This is also a continuation pattern, similar to the Bullish Rising Three, which helps identify the market’s downtrend, operating opposite to the Bullish Rising Three.

Doji:
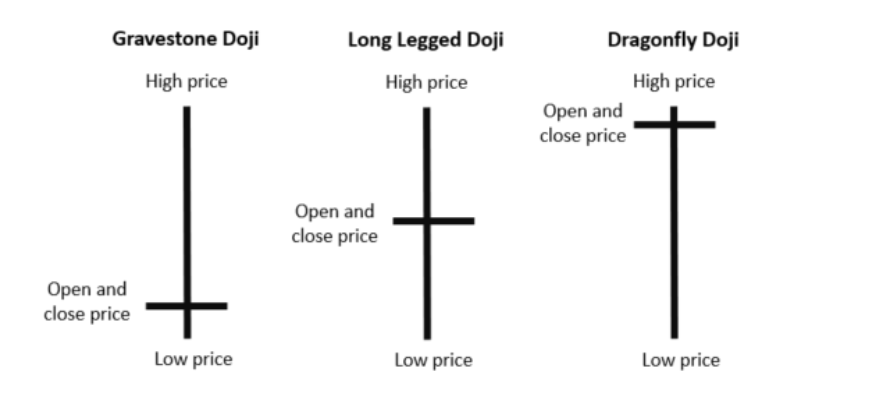
A Doji is formed when the open and close prices of the candlestick are equal or almost equal. Depending on where the open/close price falls, it is classified into:
Gravestone Doji:
This occurs when the open, low, and closing prices of a stock are nearly the same and there is a long upper shadow showing the high price of the day. This signals to investors that the chart might trend downwards.
Long-Legged Doji:
This pattern has long upper and lower shadows with opening and closing prices that are nearly the same. It indicates that traders are undecided on the price movement direction, and it might also suggest that the price will start to stabilise before potentially starting a new trend.
Dragonfly Doji:
This pattern appears when the opening, closing, and high prices are the same. It is rare and not always a clear indicator of a shift in prices.
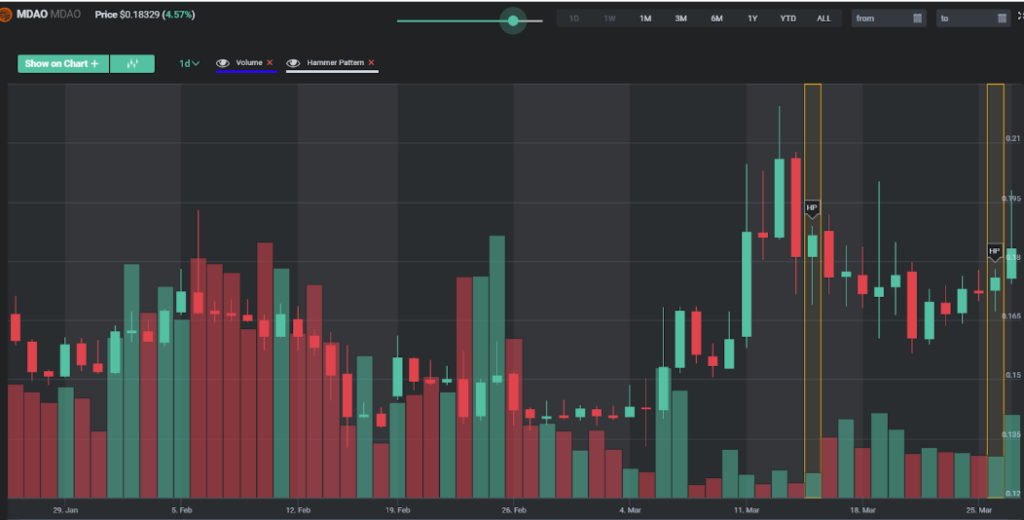
Hammer pattern:
A hammer candlestick has a small body at the upper end of the trading range, with a long lower wick (at least twice the size of the body) and little to no upper wick. It appears during a downtrend.
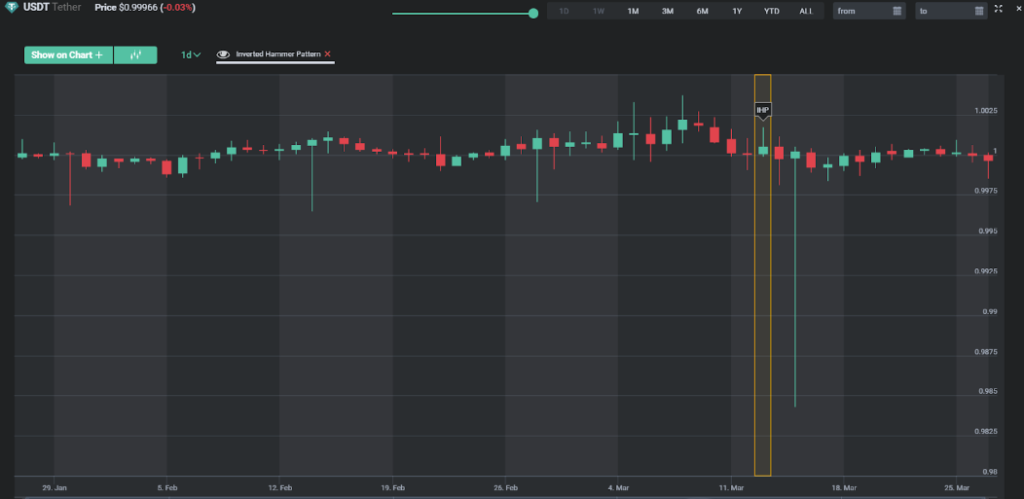
Inverted hammer pattern
This pattern indicates a bullish reversal. The inverted hammer looks like an upside-down hammer, with a small body at the lower end of the trading range, a long upper wick, and little to no lower wick.
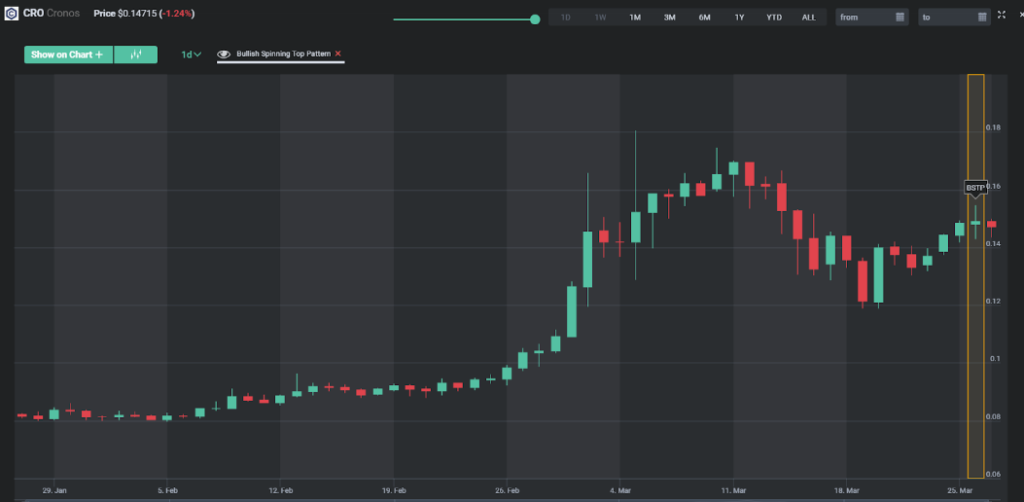
Bullish and bearish spinning tops
Bullish spinning tops is a small body with long upper and lower wicks, indicating indecision in the market. In a bullish spinning top, the candle closes slightly higher than its opening price.
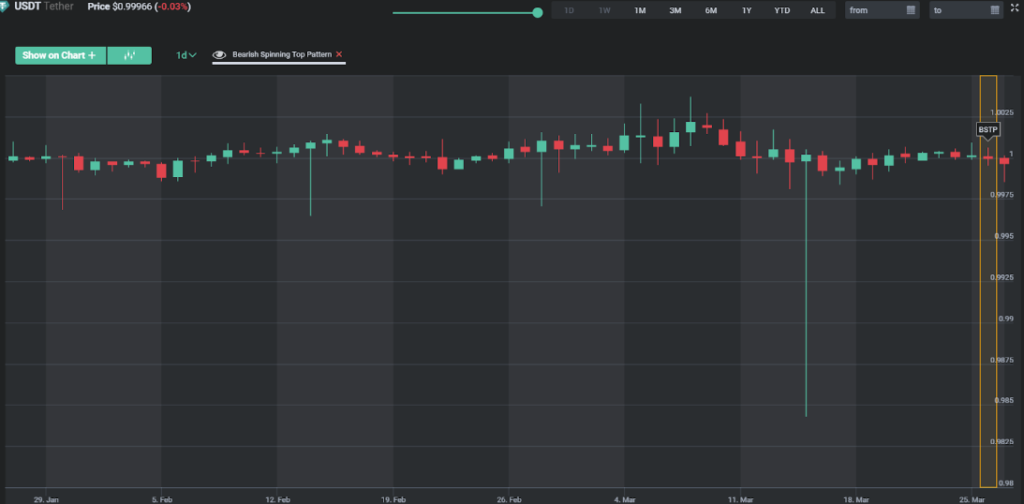
Bearish spinning tops
Similar to the bullish spinning top but closes slightly lower than its opening price.
Meta Trading Club is a leading educational platform dedicated to teaching individuals how to trade and invest independently. Through comprehensive educational programs, personalized mentorship, and a supportive community, Meta Trading Club empowers traders to navigate financial markets with confidence and expertise.

