Last week’s market and economic data key points:
- US GDP Growth Slows to 2.8% in Q3
- Fed’s preferred inflation gauge (PCE) nears target 2%
- Jobs data disappoints with weaker-than-expected numbers
- Strikes and hurricanes shake up labor market data
- Factory PMI hits a 20-month peak
- S&P 500 fell 1.37%, Nasdaq and Dow also end lower
- Nvidia to replace Intel in Dow Jones index
- Apple’s modest growth forecast triggers demand worries
- Microsoft anticipates slower Azure cloud growth
- Meta stock dips as earnings soar but costs rise
- Sherwin-Williams soars, set to join Dow Jones
- Berkshire‘s Apple stake dwindles by two thirds in 2024
- SMCI plunges 45% after EY resigns as accountant
- Canadian dollar drops to a 2-year low
- Traders lock in bets on Fed rate cuts
Table of Contents
Last Week’s Reports
Economic Reports
The Job Openings for September revealed a notable decline in job openings, which fell to 7.44 million from 7.86 million in August. This was the lowest level since January 2021. The decline in job openings suggests a cooling labor market, with significant decreases in sectors such as health care and social assistance, and state and local government.
In Q3 2024, the U.S. GDP grew by 2.8% annualized, a slight decrease from 3% in Q2. Growth was driven by increased consumer spending and federal government spending. However, the pace of GDP growth slowed due to declines in private inventory investment and residential fixed investment.
The Personal Consumption Expenditures (PCE) price index, which is the Federal Reserve’s preferred measure of inflation, dropped to 2.1% on an annual basis in September. This is very close to the Fed’s target of 2%, and it has led to expectations of further interest rate cuts in 2024. Also, the monthly PCE price index rose 0.2%.
In September 2024, U.S. personal income rose 0.3%. Disposable personal income (DPI) increased 0.3%. Also, the monthly PCE price index rose 0.2%.
The October Non-Farm Payrolls report showed that the U.S. economy added only 12,000 jobs, which was significantly below expectations. This was largely due to the impact of Hurricanes Helene and Milton, as well as the Boeing machinists strike, which together subtracted around 50,000 jobs from the payroll figures.
The unemployment rate remained unchanged at 4.1%. A reduction in jobs added can be a sign of a slowing economy, as businesses may be less confident about future growth and therefore less willing to expand their workforce.
Earning Reports
Alphabet
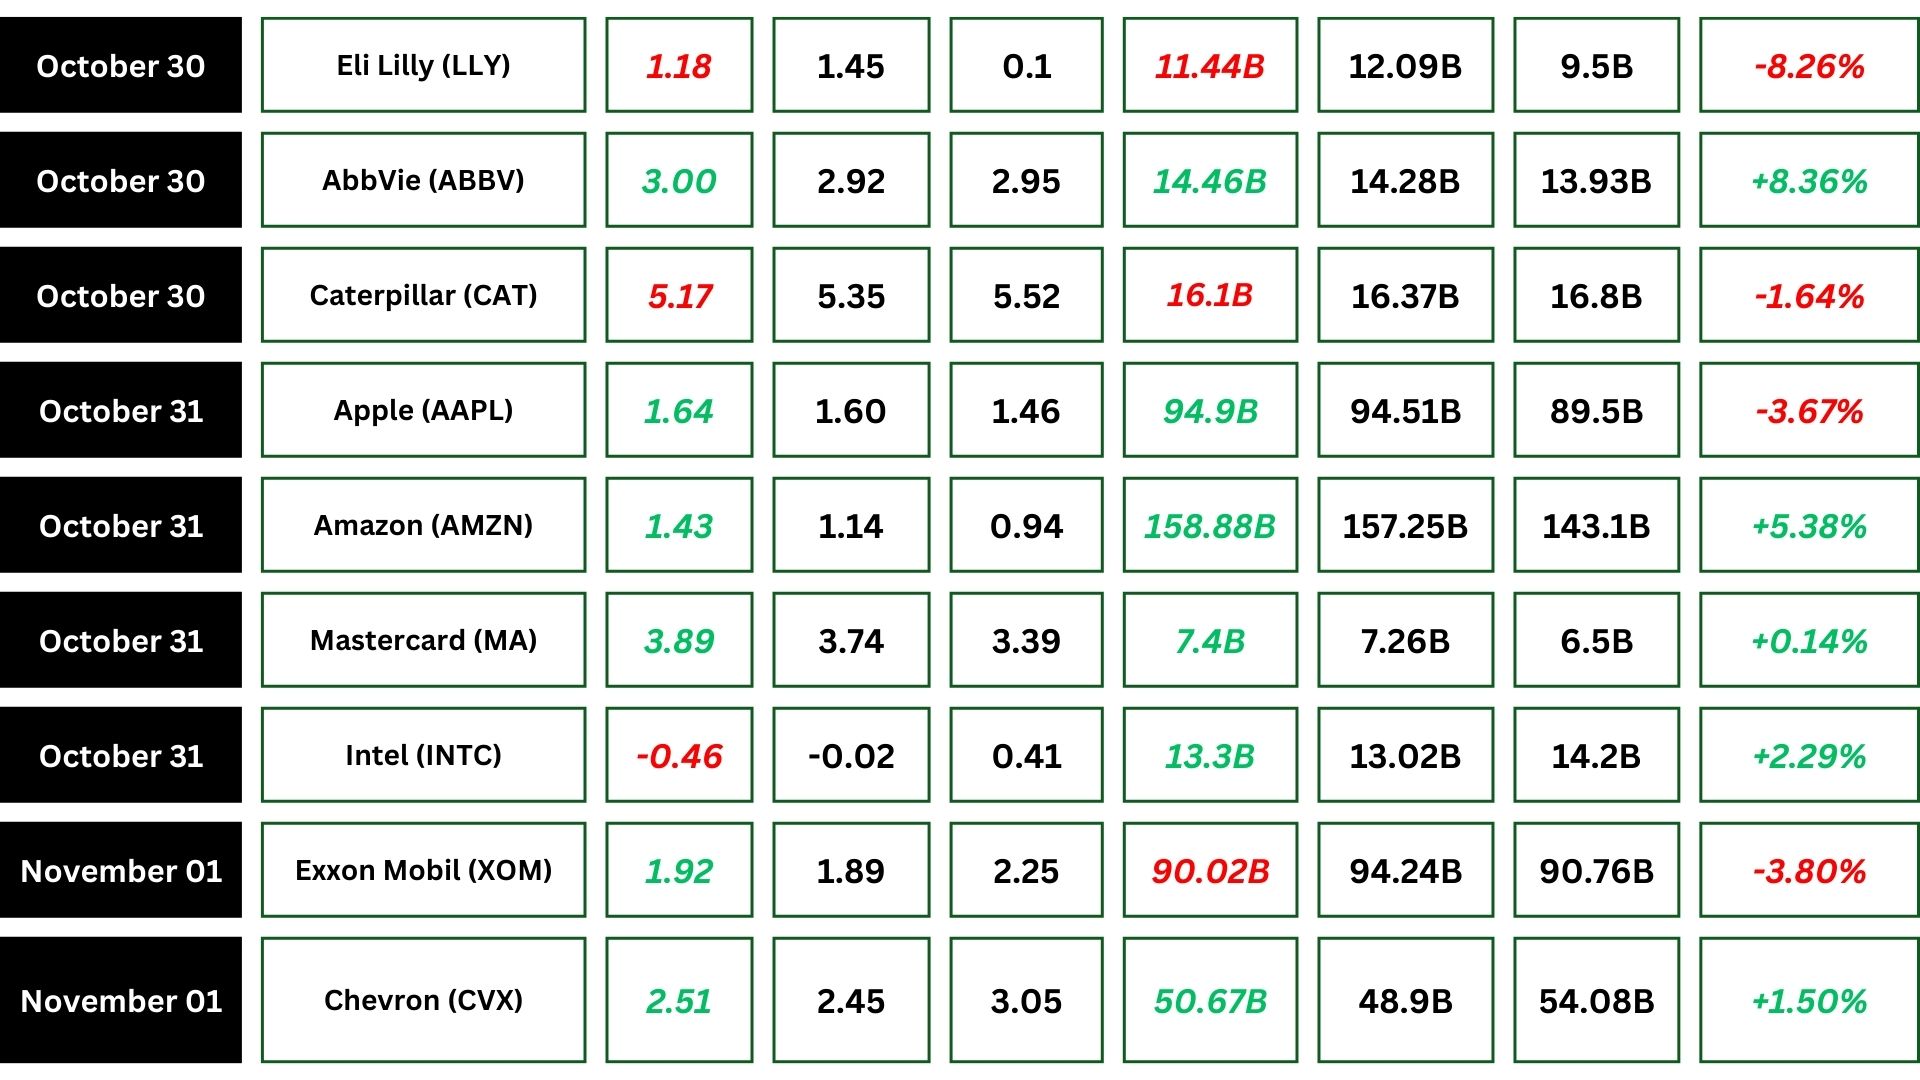
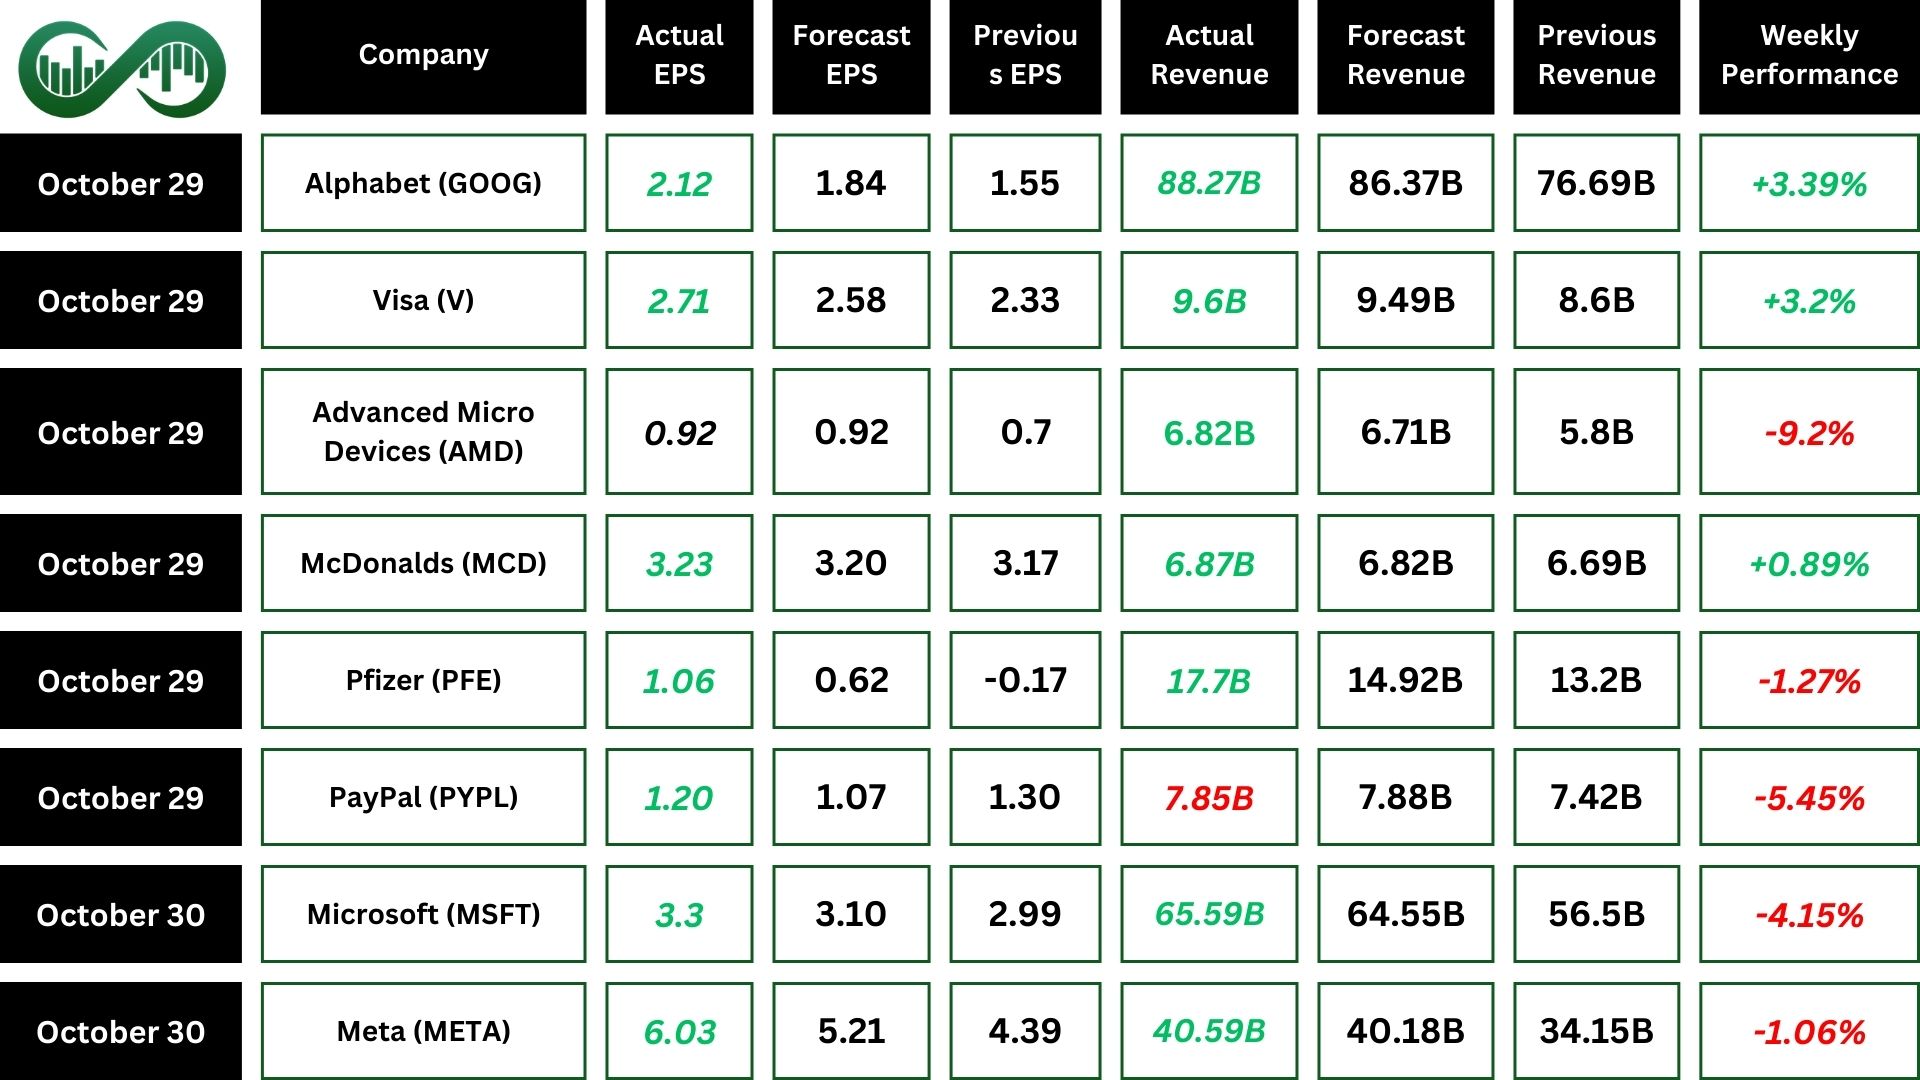
Alphabet (GooG) reported strong Q3 earnings, surpassing expectations with a notable increase in cloud revenue.
Earnings per share reached $2.12, beating estimates, while total revenue hit $88.27 billion, exceeding the forecasts.
Key highlights include a 35% year-over-year growth in Google Cloud revenue, driven by demand for AI-powered solutions, and YouTube’s ad revenue reaching $8.92 billion.
However, rising infrastructure costs were noted as a challenge.
Advanced Micro Devices
Advanced Micro Devices (AMD) reported Q3 2024 earnings. The company posted revenue of $6.8 billion, an 18% increase year-over-year, and earnings per share (EPS) of $0.92 which meet forecasts.
Key highlights include a 122% growth in data center revenue driven by strong sales of EPYC CPUs and AMD Instinct GPUs, and a 29% increase in client segment revenue due to robust demand for Ryzen processors.
However, gaming segment revenue fell by 69% year-over-year due to a decrease in semi-custom revenue. Additionally, the embedded segment revenue dropped by 25% year-over-year as customers normalized their inventory levels.
Despite the overall positive earnings results, these declines in key segments raised concerns among investors.
The AMD price has broken down the ascending black trend line by a gap, indicating a potential bearish sentiment. The support zone is between approximately $121 and $132. If this support holds, there is a possibility for the price to rise and fill the gap.
Microsoft
Microsoft (MSFT) reported Q1 2025 earnings, surpassing expectations with a revenue of $65.6 billion and earnings per share (EPS) of $3.30.
Key highlights include a 33% growth in Azure and cloud services revenue, driven by strong demand for AI services, and a 12% increase in Productivity and Business Processes revenue.
However, the company noted rising operational costs and supply chain challenges as areas of concern.
As we can see from the MSFT chart, there is a divergence between the price and the RSI, which can potentially drive the price up until the gap around $430 is filled.
If the price continues to move down and breaks the green support zone, the next support zone will be around $386.
Meta
The Q3 2024 earnings report of Meta (META), beating forecasts with a revenue of $40.59 billion and earnings per share (EPS) of $6.03, beating estimates of $5.25.
Key highlights include a 19% year-over-year revenue growth driven by strong ad impressions and an 11% increase in average ad price.
However, daily active people (DAP) came in slightly below expectations at 3.29 billion, and the company warned of significant capital expenditures growth in 2025 due to AI investments.
The META price is currently above the ascending trend line. If META’s price stays above the black ascending trend line, it has the potential to test the resistance level again. However, if the price breaks below the black trend line, it may drop to the support zone around $540.
Apple
Apple (AAPL) Q4 2024 earnings report shows that the company beat estimates, posting a revenue of $94.93 billion and adjusted earnings per share (EPS) of $1.64. The standout news includes the successful launch of the iPhone 16, which boosted iPhone sales by 6%, and the rapid adoption of Apple Intelligence, the new AI system integrated into iOS 18.
However, a $10.2 billion one-time tax charge related to an EU tax ruling significantly impacted net income. Additionally, wearables revenue fell by 3% year-over-year to $9 billion.
The AAPL price is currently below the ascending trend line. The RSI indicator shows oversold conditions, which may lead to a price rebound.
If the price moves up, it could reach the break point on the black trend line or even the resistance around $237. However, if the price continues to fall, there is a support zone around $214 to $211.
Amazon
Amazon (AMZN) reported impressive Q3 2024 earnings, surpassing expectations. The company posted a revenue of $158.9 billion, and earnings per share (EPS) of $1.43, beating the estimate.
Key highlights include a 19% year-over-year growth in AWS revenue, driven by strong demand for cloud services, and record sales during Prime Big Deal Days.
Also, operating income sets a record of $17.4 billion, which is a 56% increase year-over-year. Additionally, the company also saw strong growth in its advertising segment, generating $14.3 billion in revenue, an 18.8% increase year-over-year.
The AMZN price is currently below its all-time high of $201. The all-time high acts as a strong resistance level. If the price fails to break this resistance, it may decline to test the ascending trend line around $180. However, if the price manages to break the resistance upwardly, it could indicate higher prices in the future.
Berkshire Hathaway
Berkshire Hathaway reported a decline in Q3 operating earnings, which fell over 6% to $10.09 billion compared to $10.761 billion in the same quarter last year.
This decrease was primarily due to weakness in insurance underwriting.
Despite this, the company’s net earnings per average equivalent Class A share were $18,272, a significant improvement from a loss of $8,824 in the year-ago period.
Also, Warren Buffett also continued to reduce Berkshire Hathaway’s stake in Apple, selling a significant portion and bringing the total reduction to 67.2% since last year.
The company’s cash reserves reached a record $325.2 billion as of September-end.
Indices
Indices’ Weekly Performance:
Last week, the Nasdaq dropped by 1.5%, the S&P 500 fell by 1.4%, and the Dow declined by 0.2%.
Disappointing earnings outlooks from Microsoft (MSFT), Meta Platforms (META), and a 44.89% plunge in Super Micro Computer’s (SMCI) stock price contributed to the losses.
Ahead of the November 5, presidential election, stock indices experienced back-to-back weekly losses. This decline in stock market performance has been attributed to various factors, including rising Treasury yields, investor concerns about the election outcome and Fed interest rate decision.
The S&P 500 has recently broken down below the ascending trend line, which could be a bearish signal. If the price finds support around 5,670, it might bounce back and potentially reach new all-time highs. However, if the support zone fails to hold, the index could see further declines.
Stocks
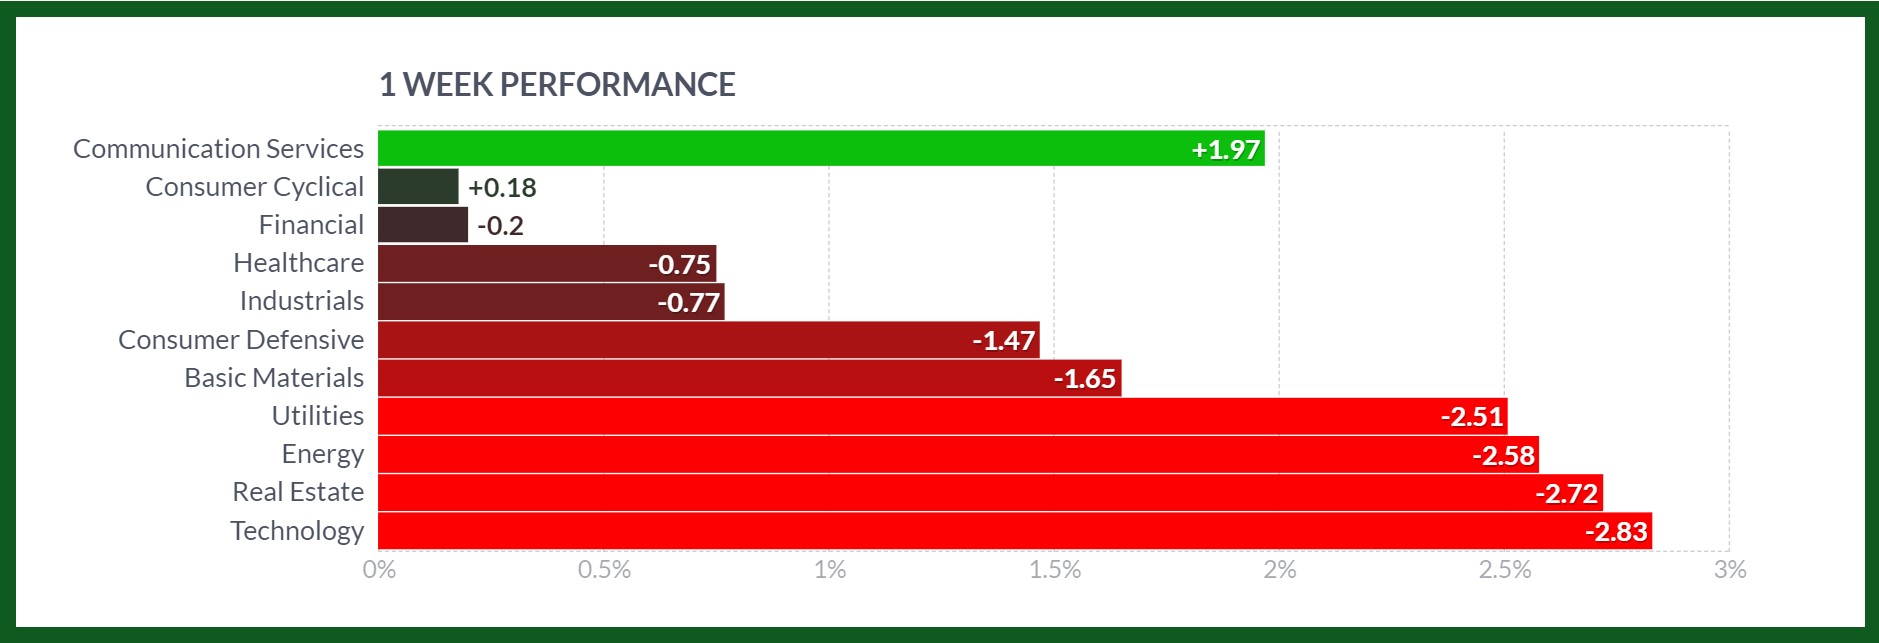
Stock Market Sector’s Weekly Performance:
Source: Finviz
Communication Services (+1.97%): The communication services sector outperformed, driven by strong earnings reports from major companies and increased demand for digital content and advertising.
Basic Materials (-1.65%): The basic materials sector faced challenges due to concerns over slowing global demand and supply chain disruptions. Prices for key commodities like metals and chemicals fell, impacting the sector’s performance.
Energy (-2.58%): The energy sector experienced a significant drop due to falling oil prices, driven by increased supply and concerns over future demand amid global economic uncertainties. Additionally, regulatory pressures and environmental concerns further impacted the sector.
Real Estate (-2.72%): The real estate sector faced significant declines, driven by rising interest rates and concerns over property valuations. Higher borrowing costs and potential regulatory changes also impacted investor sentiment towards real estate investments.
Technology (-2.83%): The technology sector saw the largest decline, primarily due to profit-taking after strong gains in previous weeks. Additionally, concerns over supply chain issues, regulatory scrutiny, and high valuations led to a sell-off in tech stocks.
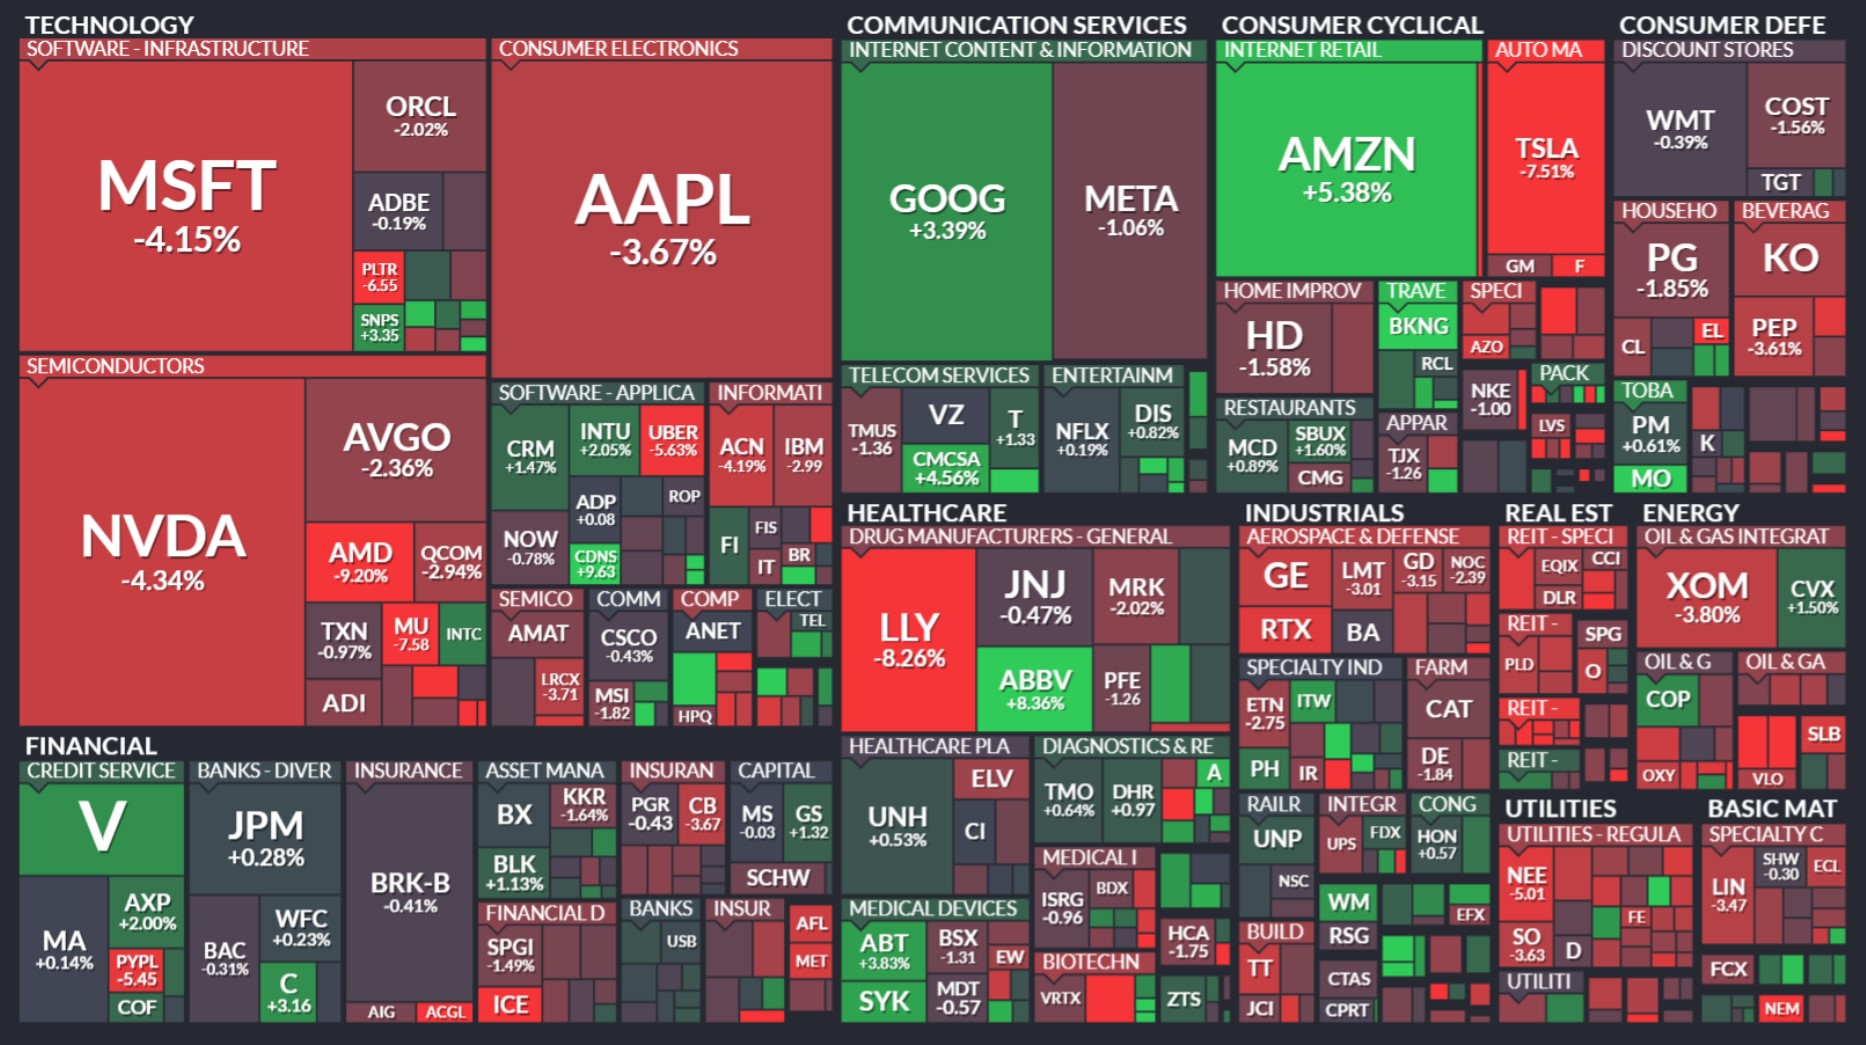
Stock Market Weekly Performance:
Source: Finviz
Large and Mega-Cap Top Gainers of the Week
- Atlassian Corporation (TEAM): Surged 18.87% following better-than-expected quarterly earnings and positive guidance for the upcoming quarters.
- Cadence Design Systems, Inc. (CDNS): Gained 9.63% due to strong revenue growth driven by increased demand for its electronic design automation tools.
- Booking Holdings Inc. (BKNG): Rose 9.23% thanks to positive travel trends and strong earnings reports.
- Charter Communications, Inc. (CHTR): Increased 9.07% on the back of increased subscriber growth and improved financial performance.
- Altria Group, Inc. (MO): Gained 8.37% following positive earnings results and strategic initiatives to diversify its product portfolio.
- AbbVie Inc. (ABBV): Rose 8.36% due to strong sales of key drugs and positive clinical trial results.
- Dell Technologies Inc. (DELL): Increased 6.79% after reporting strong quarterly earnings and positive market sentiment.
- Amazon.com, Inc. (AMZN): Gained 5.38% boosted by strong holiday sales forecasts and growth in its cloud computing division.
Commodity
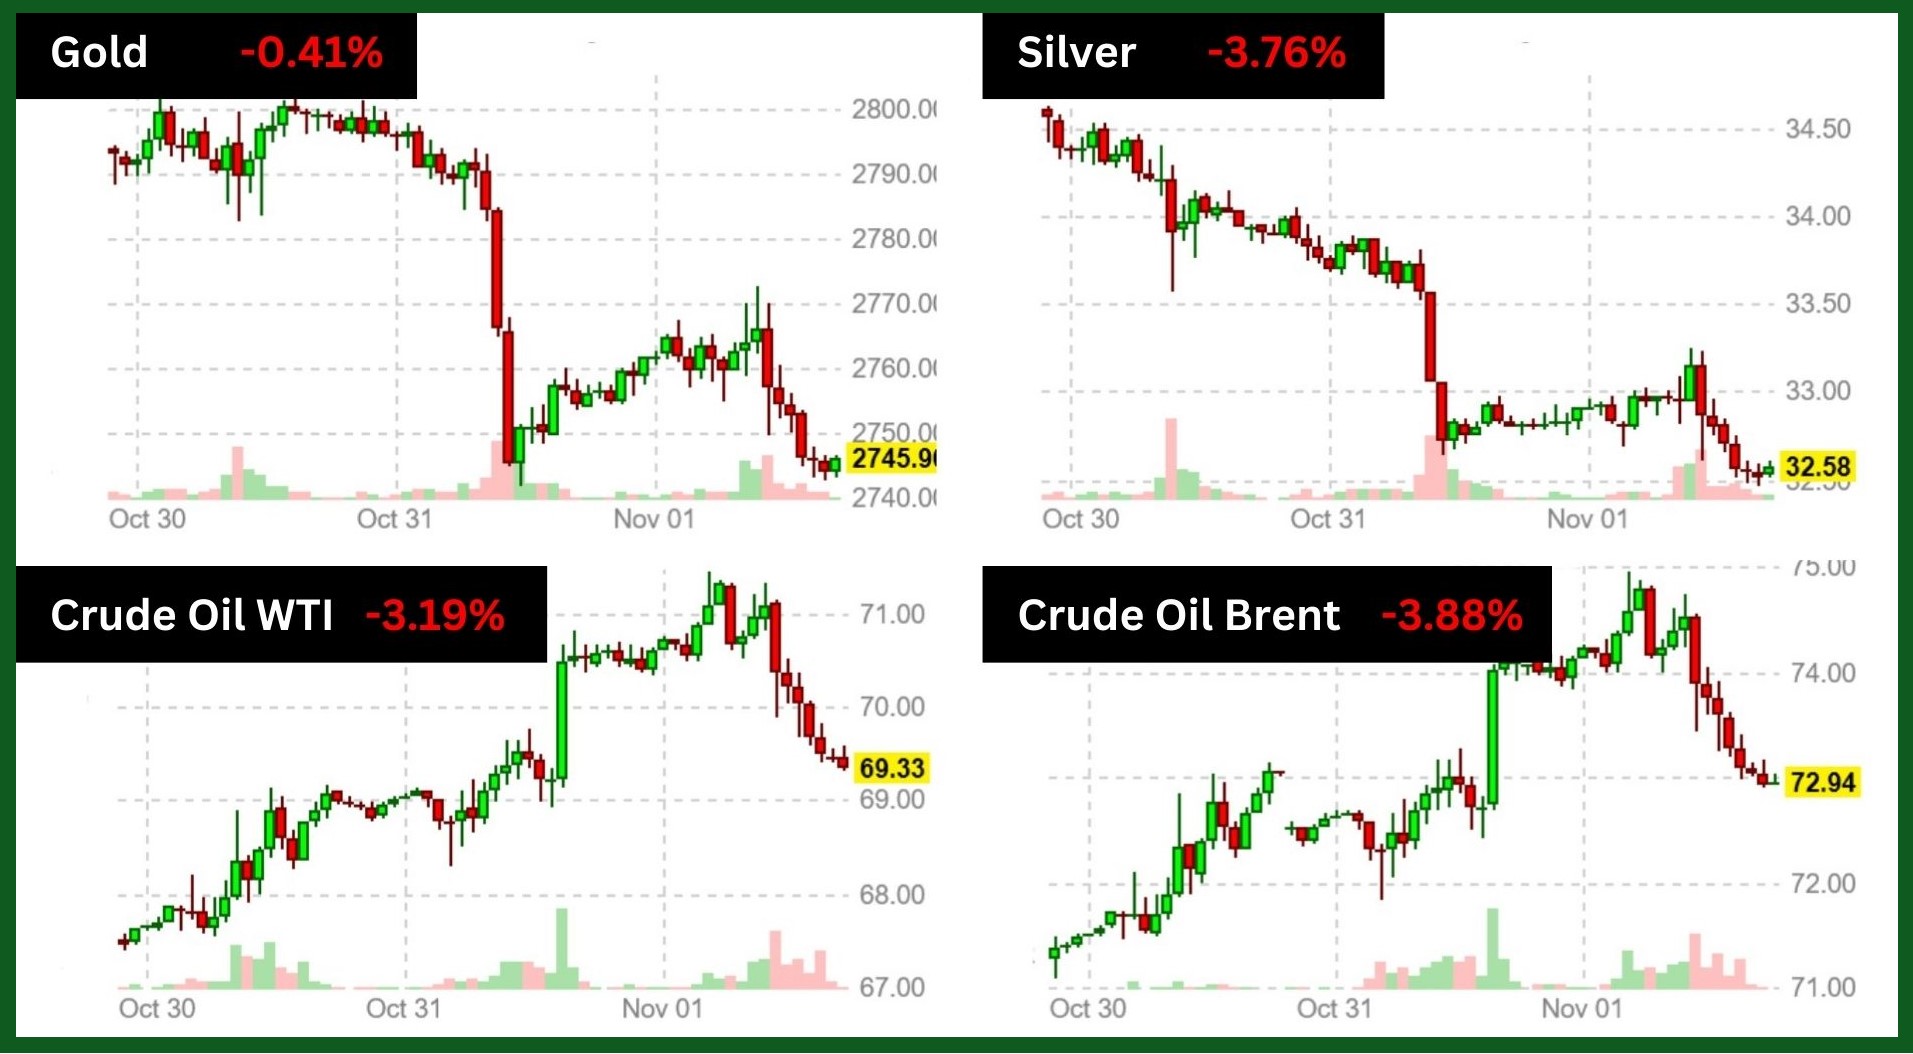
Weekly Performance of Gold, Silver, WTI and Brent Oil:
Source: Finviz
Gold prices did end the week 0.41% lower, closing at $2,734 per ounce. Despite this slight decline, gold has had an impressive year, with prices surging by about 33% since January 2024. The recent dip might be due to profit-taking after reaching record highs earlier in the week.
As we can see from the XAUUSD chart, there is a hidden divergence between the price and the RSI, which can be a bullish signal if the price stays above 2730. If the price stays above this level, it could potentially reach its all-time high or even higher. However, if the price falls below 2730, it could drop further to the bottom of the ascending channel around 2700 to 2690.
Oil futures experienced a significant drop of 3.71% last week. This decline was influenced by various factors, including strong U.S. economic data, China’s stimulus measures, and geopolitical tensions, particularly Iran’s threat of an imminent retaliatory strike against Israel.
Forex
Weekly Performance of Major Foreign Exchange Pairs:
USD/CAD: With the Bank of Canada aggressively slashing interest rates, the Canadian dollar has plummeted to a 12-week low against the US dollar. Following the central bank’s half-point rate cut, the loonie dropped sharply. This was the weakest point since early August. Also, this decline indicates a broader market sentiment that policymakers’ approach to monetary easing may be more aggressive than initially anticipated. The impact of these actions extends beyond the immediate drop, reflecting potential long-term repercussions.
USD/CHF: Swiss inflation fell to its lowest level in over three years in October 2024. This decrease was driven by lower costs for food, clothing, and household goods. Month-on-month, prices fell by 0.1%. The Swiss franc dropped to a five-week low following the data, indicating potential further interest rate cuts by the Swiss National Bank this year and into 2025.
Crypto
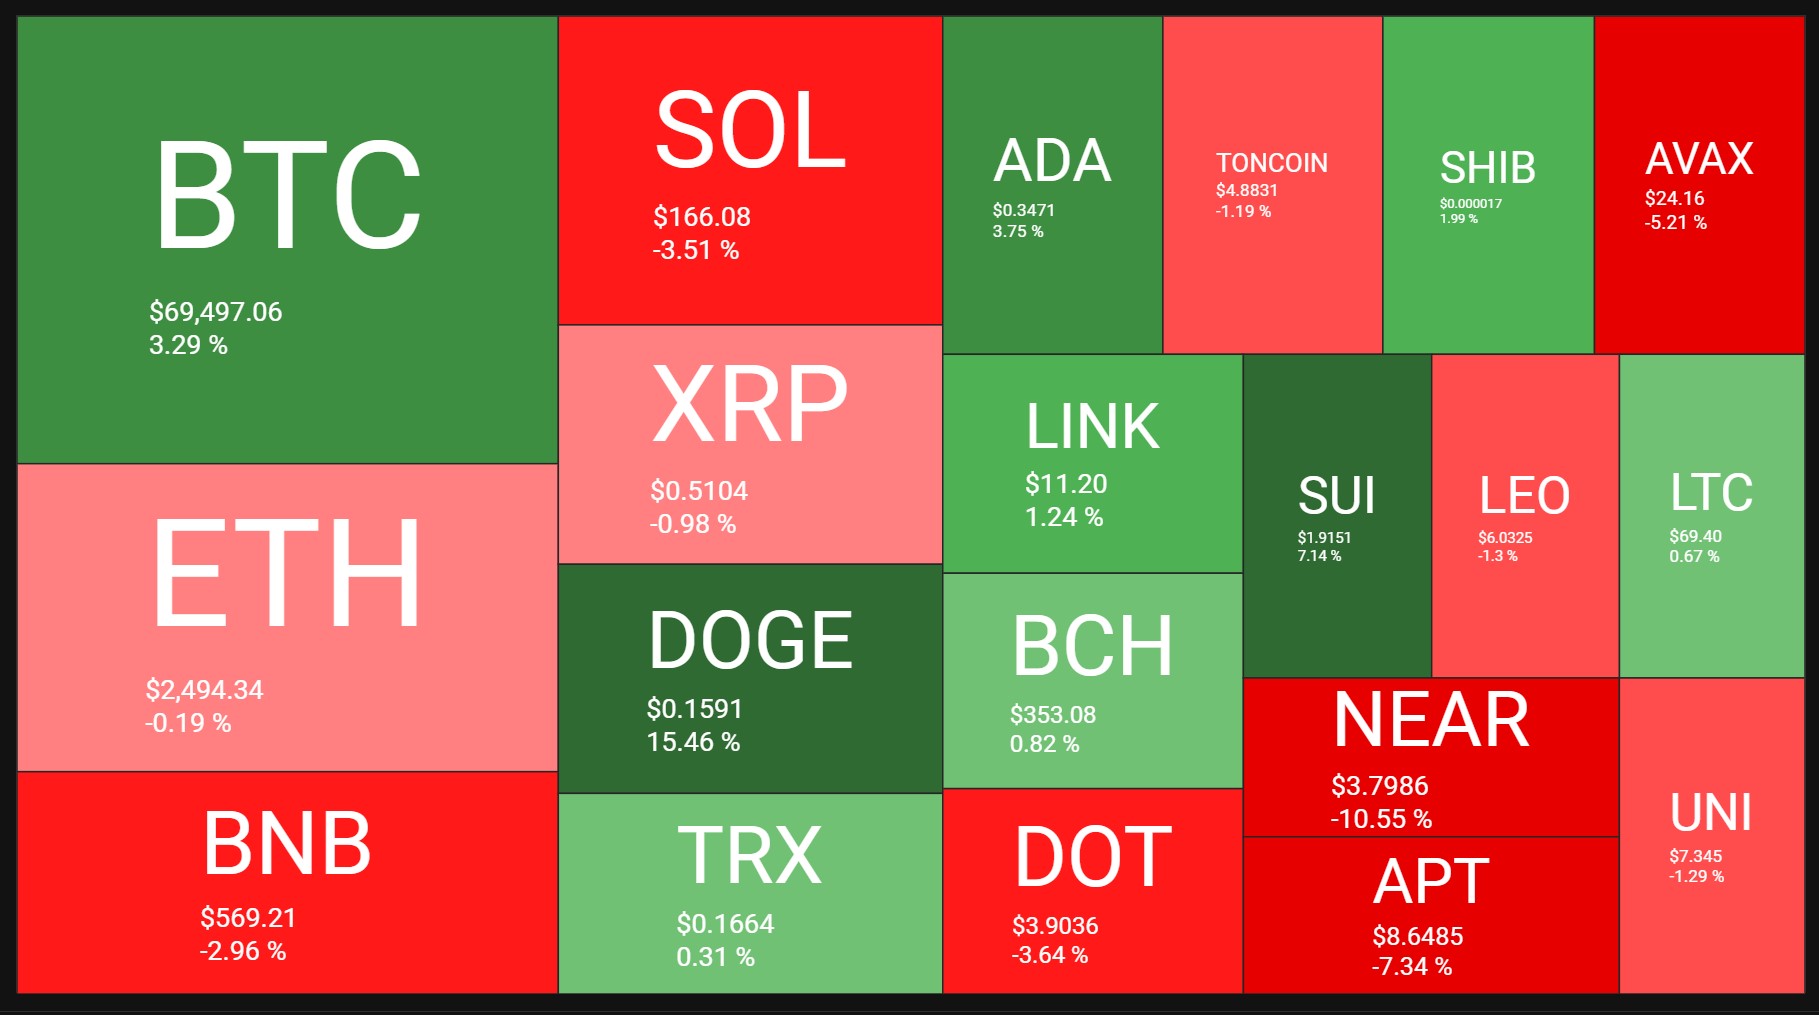
Crypto Market Weekly Performance:
Source: quantifycrypto
The BTC/USDT price is on the midline of an ascending channel. If the price breaks below the midline, it could indeed drop towards the bottom of the channel around 67,000. Conversely, if it stays above the midline, it might push up towards the top around 77,000.
Next Week’s Outlook
Economic Events
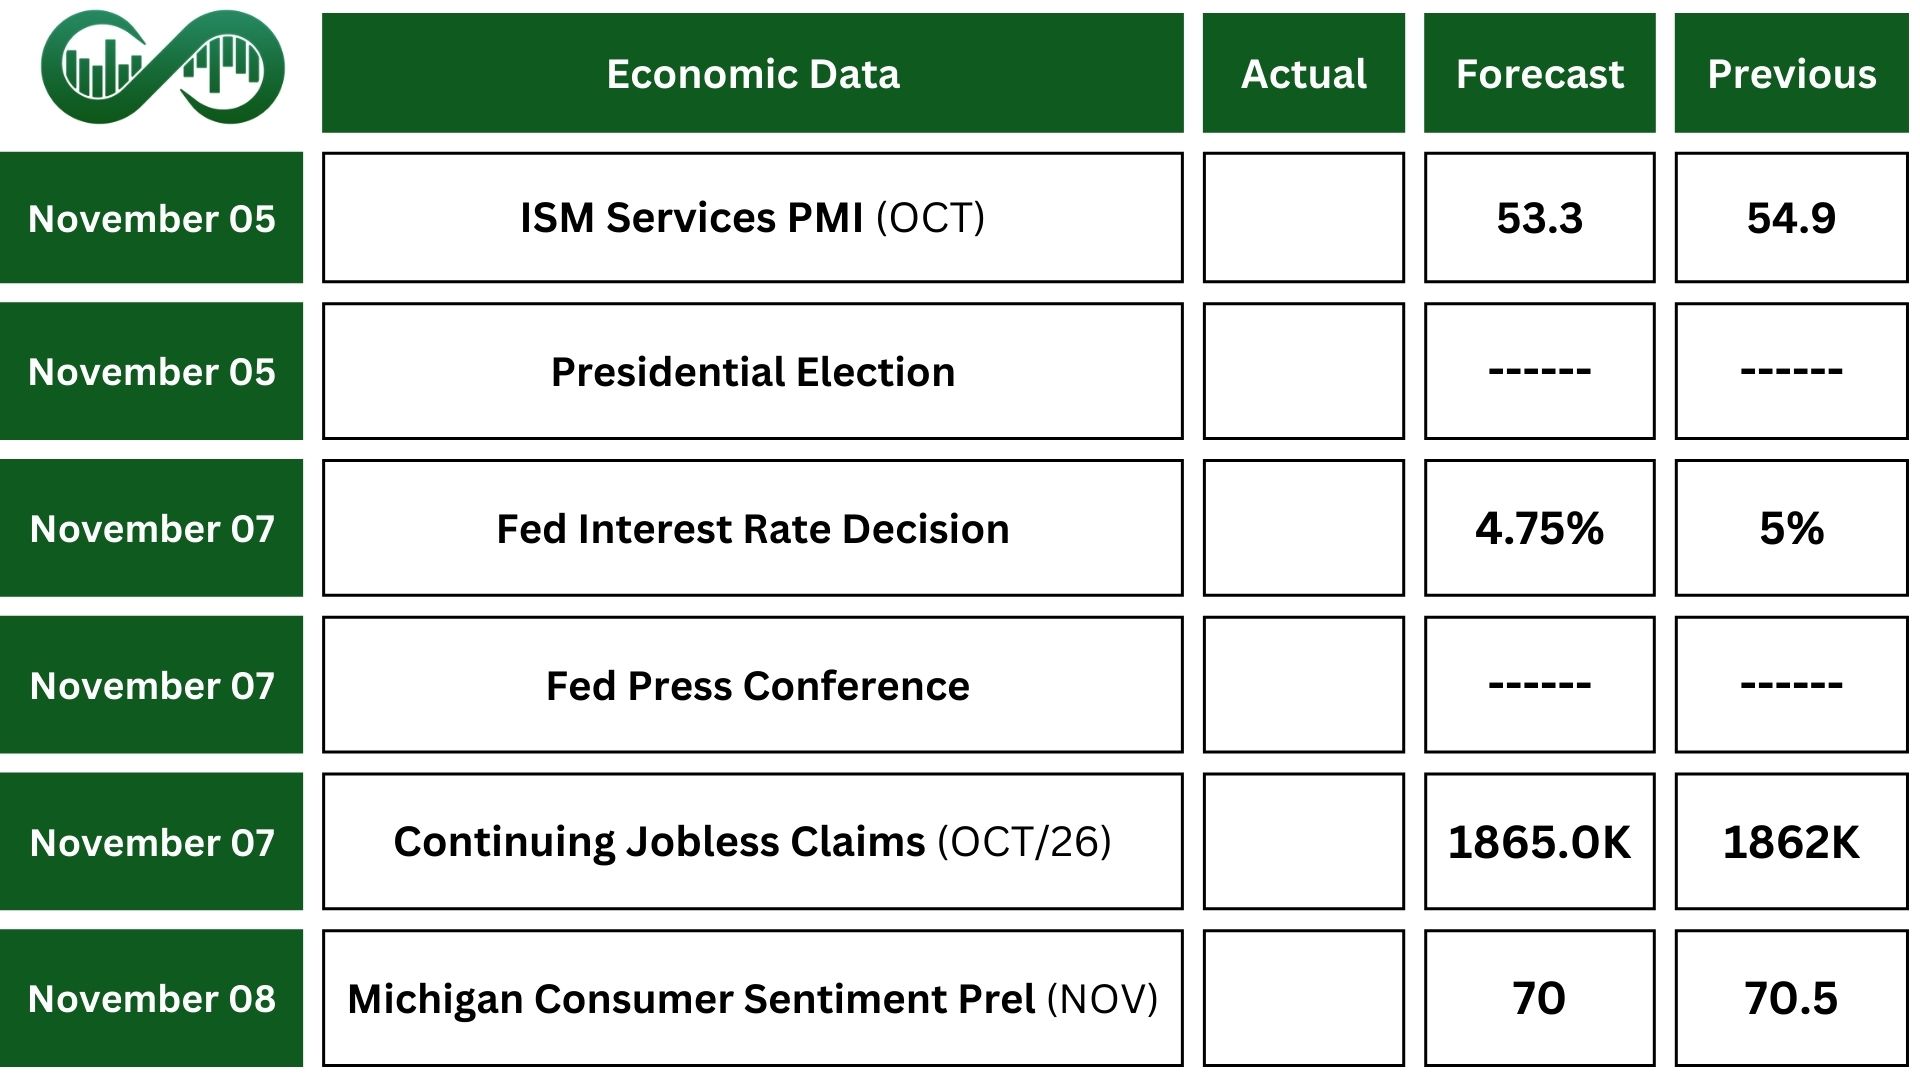
The US presidential elections on Tuesday are poised to be the most closely monitored event, drawing the attention of investors globally.
Additionally, markets will be closely watching the Federal Reserve’s interest rate decision. Fed funds futures trading indicates that the market expects the U.S. central bank to cut its benchmark policy rate by 25 basis points. This follows a previous rate cut in September, the first in four years.
However, traders are keenly awaiting guidance from Fed Chair Jerome Powell on whether the central bank might pause its rate-cutting cycle in light of strong economic data
Also, ISM Services PMI, Michigan consumer sentiment reports will be released.
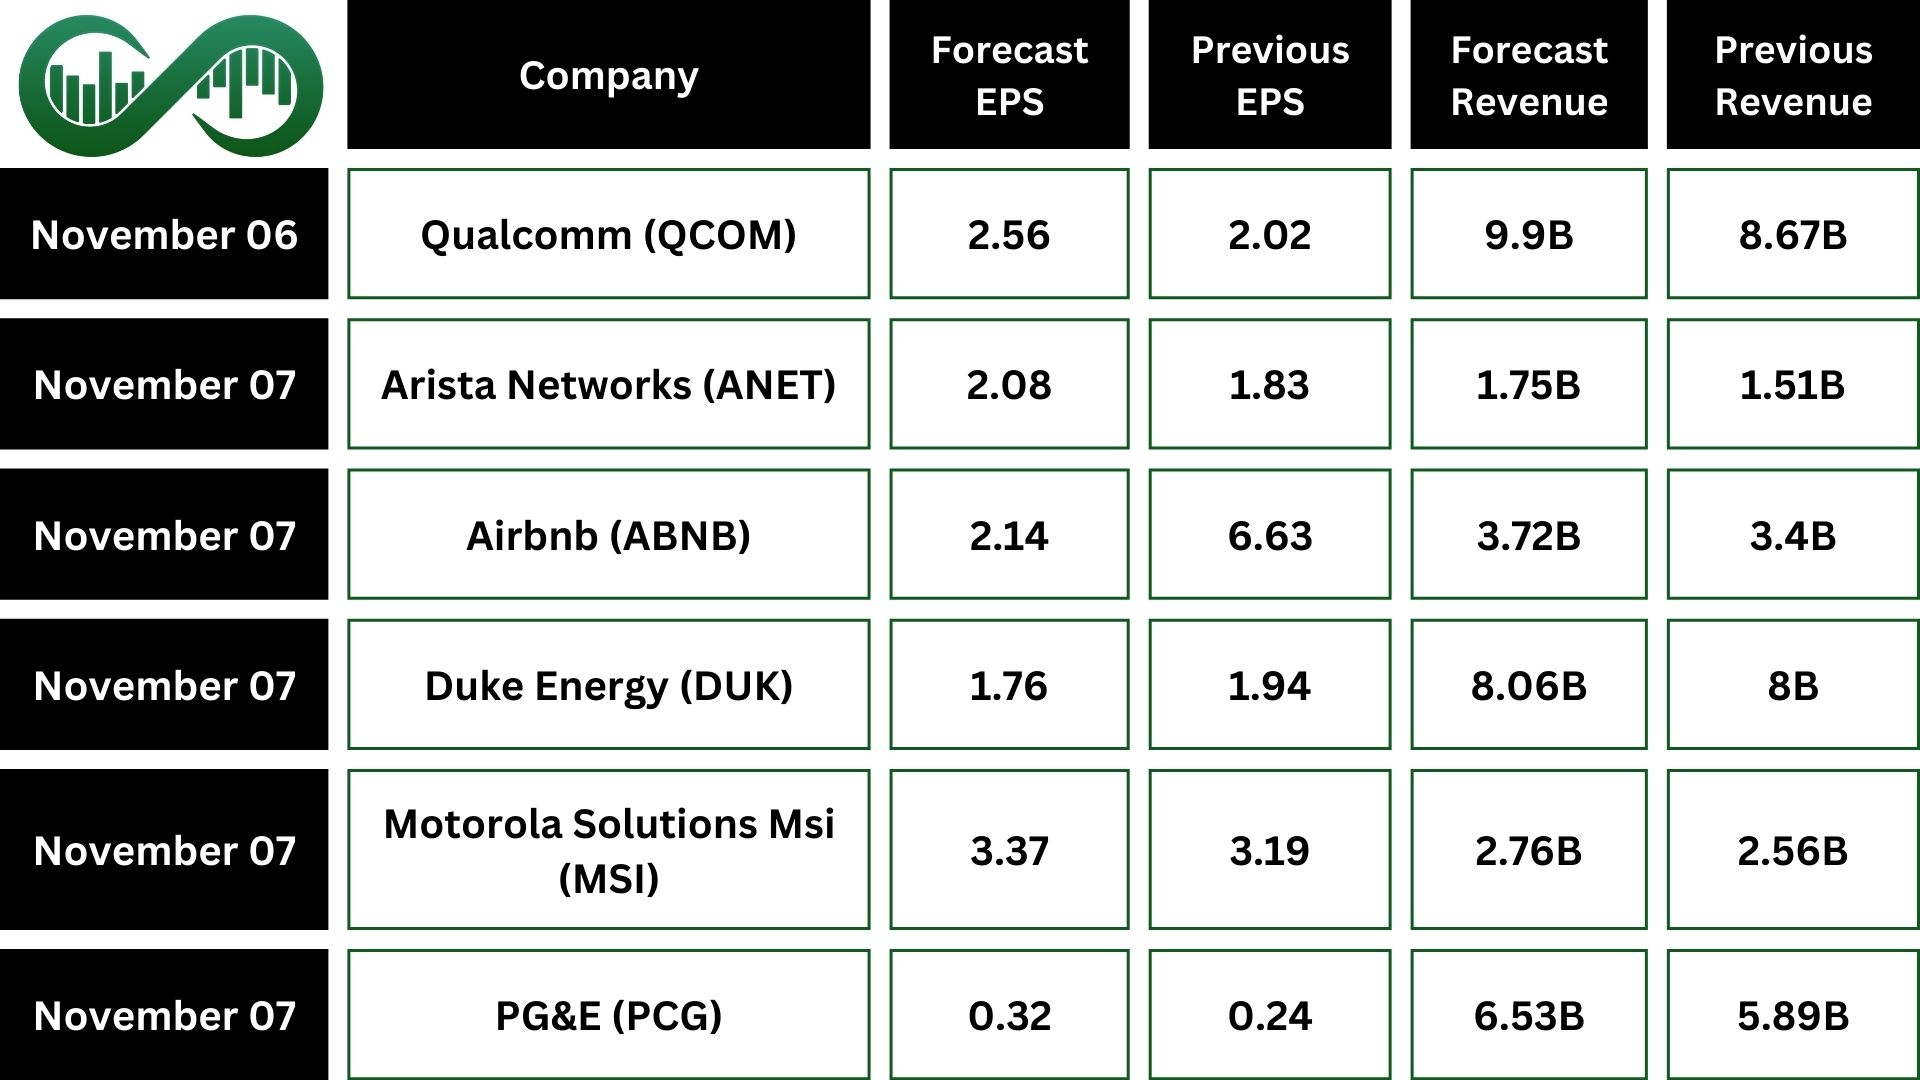
Earning Events
Earnings season will continue with shifting to large and mid-cap companies.
Disclaimer:
The views and opinions expressed in the blog posts on this website are those of the respective authors and do not necessarily reflect the official policy or position of Meta Trading Club Inc. The content provided in these blog posts is for informational purposes only and should not be considered as financial advice. Readers are encouraged to conduct their own research and consult with a qualified financial advisor before making any investment decisions. Meta Trading Club Inc shall not be held liable for any losses or damages arising from the use of information presented in the blog posts.


