Ever notice how no matter how wild your weekend gets, by Monday you’re back to the daily grind, clocking into work? Life has a way of pulling you back to the usual routine, no matter how far you stray. This is pretty much what mean reversion is all about, markets, like people, tend to wander off, but they usually find their way back home to the average.
In trading terms, mean reversion is the idea that prices might swing like a party animal on a Friday night, but they eventually cool off and return to their “normal” or average level, like a hungover version of themselves on Monday morning. Sounds simple enough, right?
Now, what if traders could use this back-to-reality vibe to their advantage and make thousands of dollars in profits? You might be thinking: “No way that’s actually a thing, right?” Spoiler alert: yes, yes they can. In fact, traders have been using this strategy for years, turning those market hiccups into serious cash.
In this post, we’ll break down what mean reversion is, get cozy with the core concepts, and then dive deeper into how traders are using this method to profit from those inevitable price snapbacks in the market. Grab your charts and get ready, it’s time to make the markets work like they’ve got a Monday deadline!
Table of Contents
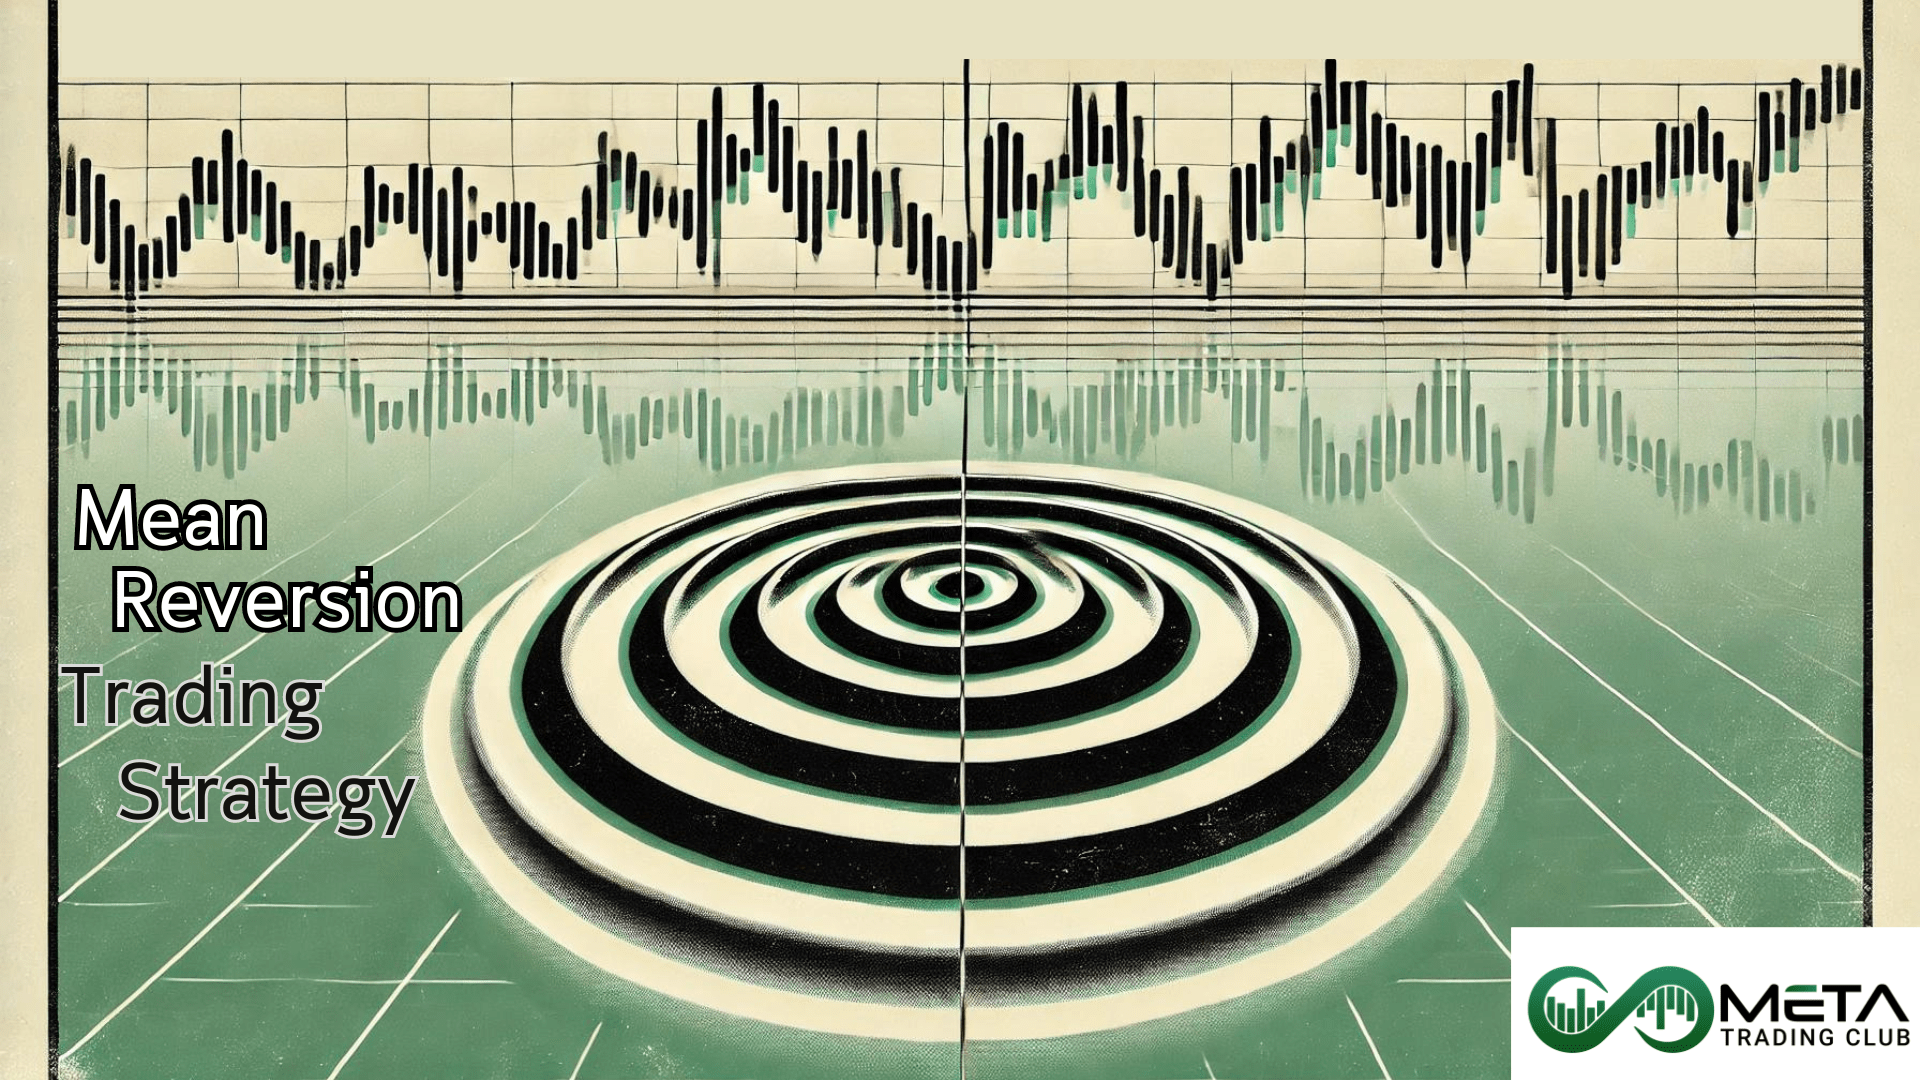
What is the Mean Reversion?
Mean reversion sounds like one of those fancy terms economists throw around to sound smart, but it’s actually a pretty simple concept. At its core, mean reversion is the idea that, over time, things tend to move back to their average, or “mean.” It’s like the universe’s way of keeping things from getting too out of hand.
To better visualize the concept, picture this: you’re stretching a rubber band. The further you pull it, the stronger it snaps back when you let go. Prices in the financial markets often behave the same way. If they swing too high (or low), they’ll eventually get tired and head back to their more “normal” levels, their average price.
Now, imagine your favorite snack. Let’s say you’ve got a stash of chocolate bars (lucky you!). Usually, you eat one bar every day. That’s your mean, your average chocolate consumption. But then one day, you go off-limits and eat five! Even though you’ve temporarily deviated from your one-a-day habit, over time, you’ll likely go back to your usual rhythm of munching on just one bar a day. The chocolate excess was an outlier, and you revert back to the mean.

In mean reversion, before you even start thinking about prices bouncing around like a kid on a sugar rush, you need to understand what this “mean” actually is. What are we snapping back to?
In most cases, the mean is just the average. It’s the center of gravity that the variable seems to be drawn toward, the calm in the storm. It’s not some mystical, hard-to-find number, it’s just the average value of whatever asset we’re looking at over a certain period of time. An example of this is your favorite team’s performance. While they may occasionally perform better or worse than expected, their average performance remains consistent over time.
Now, the “mean” isn’t a one-size-fits-all thing, if you’re on the Meta Trading Club site reading about mean reversion, then you’re probably less concerned about your favorite team’s performance and more interested in how this mean works in trading and finance, right?
Well, lucky for you, that’s exactly what we’ll dive into next!
Mean Reversion Trading Strategies
Alright, now that we know what mean reversion is, let’s talk about how it plays out in the financial markets. Mean reversion trading leans heavily on a few key ideas, like Dow Theory and the concept of reversals. If Dow Theory had a catchphrase, it would probably be something like: What goes up must come down, and what’s down too long is probably going back up. It’s all about identifying trends and understanding that prices, no matter how wild they get, often have a natural tendency to correct themselves and head back to their average.
In mean reversion trading, this is exactly what traders are looking for. The idea is simple: you find a “mean” for the price, usually calculated over a specific period of time (let’s say, a 50-day moving average). When the market decides to throw a tantrum and deviate far away from this mean, either shooting way above it or tanking far below it, that’s when a mean reversion trader starts rubbing their hands together in excitement. Why? Because they’re betting on the market eventually getting tired of its drama and crawling back to that average price level.

In other words, it’s like waiting for a stock to snap back to reality after it’s had too much coffee. The trader goes long if the price has dipped below the mean, expecting it to rise, or short if the price has zoomed way above it, anticipating it’ll drop back down. It’s a strategy built on patience, confidence, and mean reversion.
In mean reversion trading, there is no universal mean. In fact, the “mean” that traders use can vary based on different market conditions and strategies. You see, the market doesn’t just stick to one straightforward average; there are multiple ways to calculate a mean, depending on what you’re looking for.
Some traders use the extremes of a price channel as their mean, relying on the upper and lower bounds of that channel to identify when the price has gone too far. Others may look to trendlines, which act as a visual guide for where prices should be gravitating over time.
Moving averages are another popular choice. This can range from a short term 20-day moving average to a long term 200-day moving average, depending on how much of the market’s behavior a trader wants to capture.
And it doesn’t stop there! Indicators like Bollinger Bands are often used to highlight areas where prices have stretched too far from the mean, practically screaming for a reversal. Each of these “means” has its own way of telling traders that the market’s a bit off track.

Now, here’s the fun part: The mean isn’t a universal number that all traders agree on. One trader might swear by their 50-day moving average like it’s gospel, while another is busy plotting lines on their chart, convinced that their trendline is the real key to the next mean reversion. And then there’s the guy using Bollinger Bands, smiling like he’s cracked the code to the universe. But how should one trade with each one of these? That’s what we’ll cover next up.
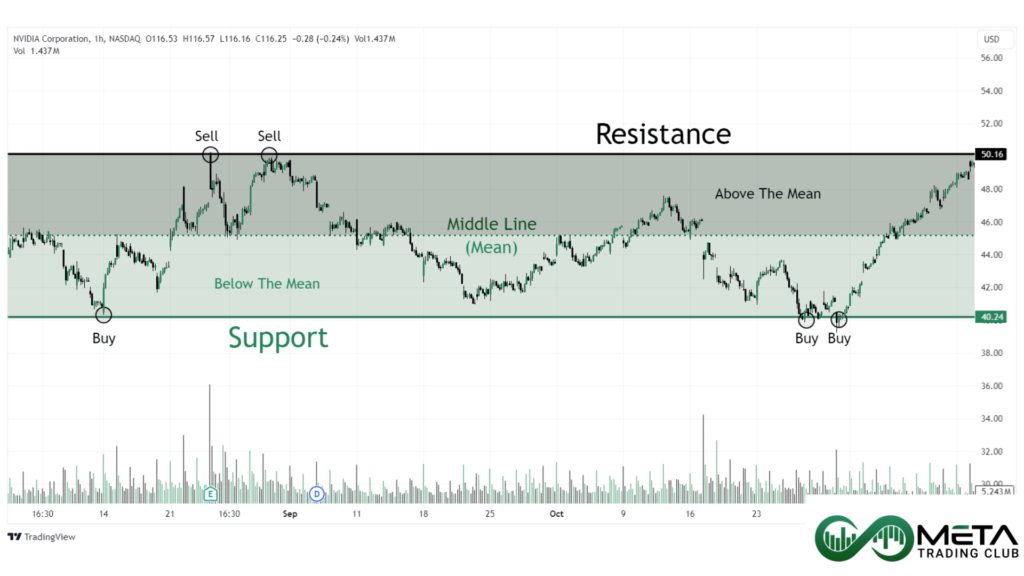
Channel Extremes Reversion
Sometimes the market isn’t trending up or down but instead gets stuck in a range-bound mode, bouncing back and forth between a strong support and resistance level. This creates what’s known as a price channel. Think of it like a bouncy ball trapped in a hallway; it’s bouncing between the floor (support) and the ceiling (resistance).
For traders, this channel presents an opportunity to profit from mean reversion. As they can see in the provided image, when the price reaches the ceiling of the channel (the resistance level), it might be a great time to open a short position, expecting the price to come back down. Conversely, when the price dips to the bottom (the support level), going long and betting on a bounce back up could be the profitable move.
But here’s the catch: What happens if the price suddenly breaks out of this neat little channel, either shooting above the resistance ceiling or crashing below the support? This is where measuring momentum and price strength becomes crucial.
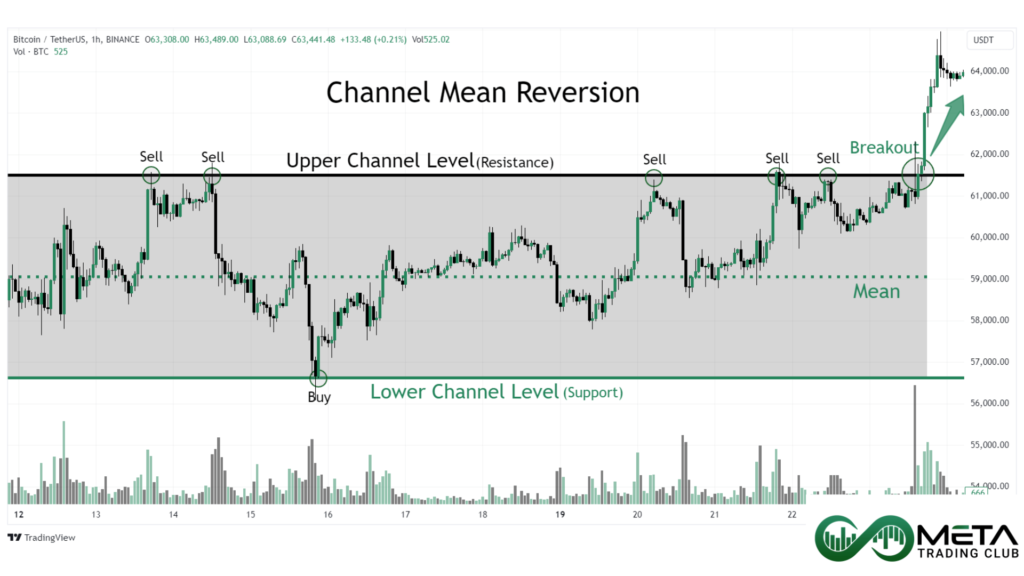
For example, let’s say the price manages to sneak above the resistance ceiling. It could seem like the market is ready for a new high. But wait, before you start betting on this breakout, you need to check the momentum and trading volume. If this breakout isn’t supported by high volume or strong momentum, it’s probably what traders lovingly refer to as a fakeout. The market might just be messing with you before snapping back into the channel, like a rebellious teenager sneaking out but coming home by curfew.
In cases like this, traders can open a short position with more confidence, betting that the price will revert back to the mean and back into the channel.
The same logic applies on the downside. If the price breaks below the support level but momentum and volume start to fizzle out, it’s a sign that the breakdown might not have enough steam. In these cases, the market often respects the support and bounces back toward its mean, making it a perfect setup to go long.
Trendlines Reversion
In a trending market, trendlines can serve as a dynamic mean for price action. Traders can draw trendlines to help identify key levels where prices may revert, offering an opportunity to profit from mean reversion.
For example, in an uptrend, a trendline is typically drawn by connecting the lows of the price movement. As this upward-sloping trendline takes shape, traders can treat it as a dynamic mean that follows the market’s upward momentum. When the price drifts too far from this trendline, traders start looking for opportunities to enter positions, expecting the price to snap back toward the trendline like it’s tethered to it.
The strategy? Open a short position when the price deviates significantly from the trendline and use the trendline itself as an exit point for positions already open. The idea is that the further the price moves away from the trendline, the stronger the pull traders expect back toward it, like a magnet (Though you must always look for further confirmations as the idea alone may fail to anticipate further market movements)
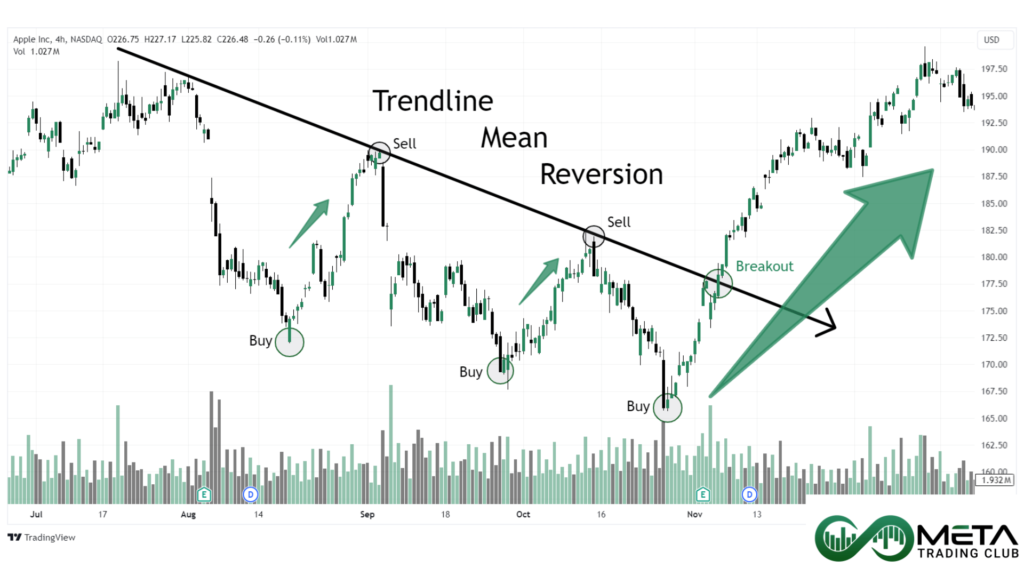
As shown in the provided images, trendline mean reversion works in both bullish and bearish markets. In a downtrend, traders connect the highs of the price action to form a downward-sloping trendline. Here, the strategy flips, traders can go long when the price pulls away from this bearish trendline, anticipating a return to the mean as the price swings back.
To boost the reliability of these setups, you may combine trendlines with other tools like indicators (RSI, moving averages), Fibonacci retracements, and candlestick patterns. Concepts like Elliott Wave Theory can also help confirm whether the price’s deviation from the trendline is part of a larger corrective move or just a temporary swing before it continues trending.
Moving Average Reversion
Unlike trendlines, which are best suited for trending markets, moving averages can be used no matter what kind of market you’re dealing with; uptrend, downtrend, or sideways range. It’s like that friend who’s always ready to hang out, no matter the plan.
So, how do moving averages tie into mean reversion trading? Well, it’s actually pretty straightforward. When the price deviates too much from the moving average, a trading opportunity pops up. The theory says the market always goes back to the mean after an unusual high or low swing. In other words, if the price goes rogue and strays too far from the moving average, it’s probably going to come back down to earth (or bounce back up, if it tanked).
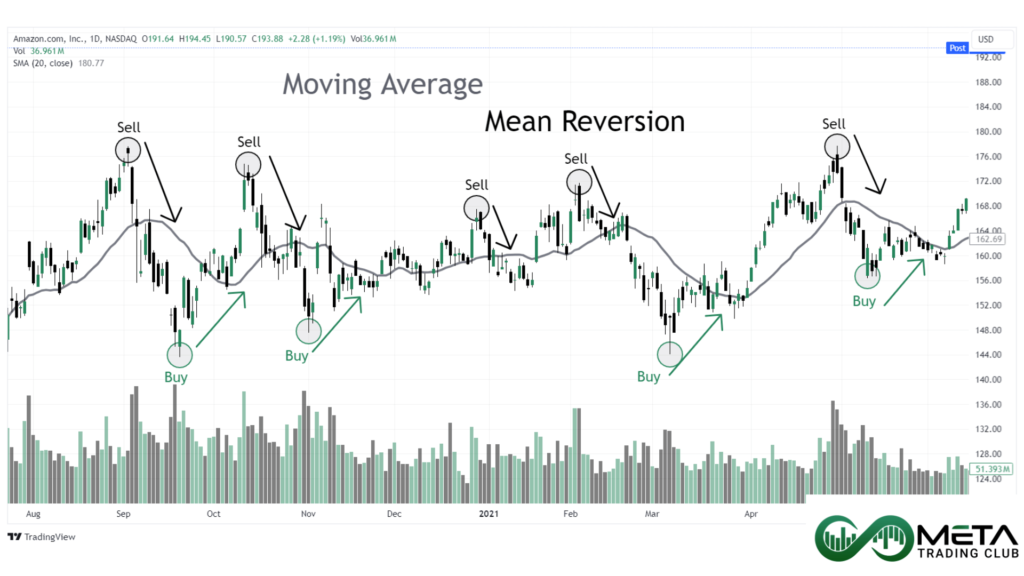
The beauty of the moving average is that it can also be used when the market is moving sideways in a range or channel. In this scenario, you can double down on your analysis by leveraging both the moving average and those key support and resistance levels that the price is bouncing between. Add in candlestick patterns, and now you’ve got yourself a safer trade setup.
But (and this is a big but), make sure you also pay attention to trading volume. Volume is like the missing piece of the puzzle. When volume is low, the price is likely just teasing a breakout, only to revert back to the mean. However, if the volume and momentum are strong, chances are that the price will break out of the channel and rally in the opposite direction of the mean, leaving your strategy in the dust (unless your stop loss saves you).
Bollinger Bands Mean Reversion
What if I told you there was an indicator that could suggest the limits of the next market move with around 75% accuracy? Interested? Oh wait, Bollinger Bands can do this with up to 90% accuracy. Impressive, right? Well, before you start popping champagne, remember that Bollinger Bands aren’t magic. They use market data to give you a solid estimate of how much prices might change next, while considering both the potential maximum gains and losses.
But here’s the good part, Bollinger Bands provide fantastic opportunities for mean reversion trading. To use them to your advantage, you’ll need to understand the anatomy of this indicator.
- The upper band: This marks the potential upper limit of price action.
- The lower band: The supposed floor the price might touch.
- Mid Line: Sandwiched in the middle is a moving average, which acts as your mean.
The bands themselves are dynamic, they widen when the market is volatile and tighten during periods of calm. This makes them a great tool for mean reversion traders who want to spot extreme price moves.
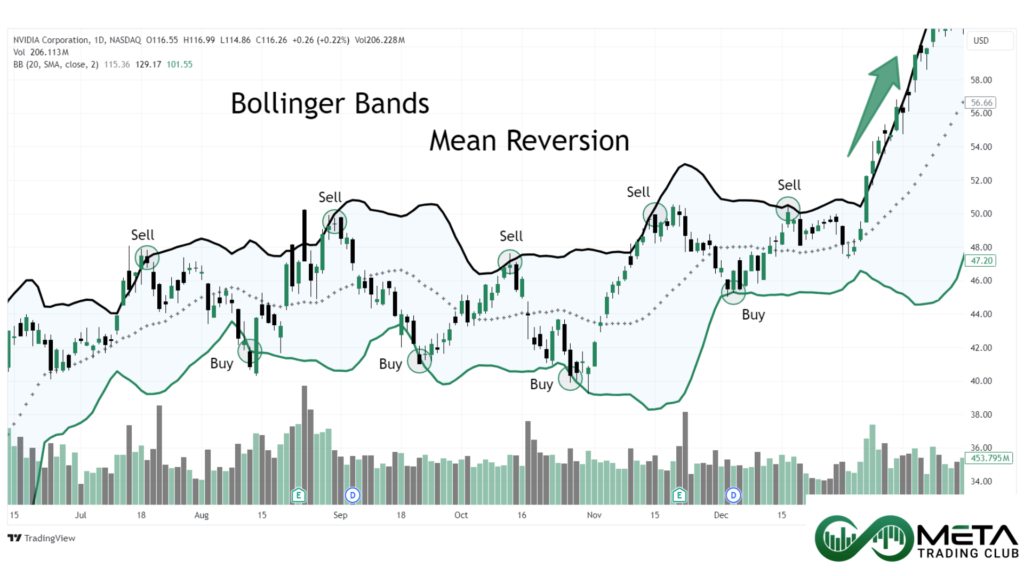
So, how does it work in practice? Let’s say the price shoots up and kisses the upper band. Should the candles breach above the upper band and then get pushed back down inside with weak momentum, a shorting opportunity presents itself! If low trading volume accompanies the breach, this is a strong signal that the price will probably start heading back toward the mean.
On the flip side, the same logic applies to the lower band. If the price dips below the lower band but quickly gets pushed back up inside the bands, it’s a signal to go long. Once the price reverts to the moving average (the middle line), you can exit your position, smiling all the way to the bank.
But wait, what about when the price doesn’t revert? What if the price just keeps climbing higher (or sinking lower) without touching the moving average? Well, that’s where the market reminds us that it’s full of surprises.
The key to managing this uncertainty is to use additional indicators like MACD or RSI to confirm your trades. And, of course, don’t forget a tight stop loss, because sometimes, the market likes to ignore the rules and keep running in one direction.
Final Words
First off, congratulations! You’ve just taken a deep dive into the basics of mean reversion trading, and now you’re equipped with the knowledge to start spotting those sweet market reversals.
In this post, we covered the core concept of mean reversion, how prices tend to snap back to the average after wandering too far. We discussed how traders use various means like channel extremes, trendlines, and moving averages to pinpoint profitable entry and exit points. We even dug into the powerful Bollinger Bands and how they can give you a dynamic range for your mean reversion strategy.
However, it’s important to remember that mean reversion is just one of many trading strategies, and it might not suit everyone. It’s a reversal strategy at heart, which means you’re betting on the market coming back to normal. Some traders are more comfortable riding trends rather than waiting for reversals. If that sounds like you, you might find greater success with strategies like momentum trading, gap and go, or breakout and retest strategies, which focus on following the trend rather than anticipating the market’s next turn.

FAQ
A mean reversion strategy involves betting that an asset’s price, after moving significantly away from its average, will revert back to that mean level. Traders use this method to profit from extreme price deviations.
Reversion to the mean refers to the idea that, after a significant price movement, the price will eventually return to its average or “normal” level over time.
Yes, mean reversion can be profitable, especially in range-bound or overextended markets. However, its success depends on timing, market conditions, and using proper risk management.
In real life, mean reversion occurs when extreme events (like abnormally high or low scores, prices, or behaviors) eventually settle back to an average, such as test scores returning to typical performance levels over time.
You can identify mean reversion by spotting price deviations from a key mean, such as a moving average, trendline, or Bollinger Band, and then confirming with momentum indicators like RSI or MACD.