
Picture this: You’re watching an asset’s price stuck between two price levels for days, maybe weeks. It’s like a compressed spring, and you know that sooner or later, something’s got to give. Then suddenly, the price surges past the ceiling. The breakout has begun, Do you know what to do next?
The reality is that trading breakouts can be a very profitable trading strategy, but have you ever asked yourself why nearly 70% of traders who chase breakouts end up on the wrong side of the trade? Well, breakout trading can be one of the most powerful strategies, only if you know the right approach.
In this post, we’ll break down the basics of breakout trading. You’ll learn what breakouts are, the key principles for understanding them, how to avoid common traps, and the best practices for managing risk.
Table of Contents
What is a Breakout?
To create a more vivid picture of a break out, let’s go with the following scenario. A river flowing along peacefully, everything in check, until, BAM! There’s a huge dam blocking its way. Water starts to pile up behind the dam. At some point, there’s just too much pressure for that dam to hold. What happens next? Yep, you guessed it; the dam bursts, and the water rushes through with all its might.
That, my friends, is essentially the breakout in trading. The “water” is the price, “Water Pressure” translates into buy/sell pressure , the “dam” is a key support or resistance level, and when that price finally “breaks through” the dam, it’s what traders call a breakout.
But before you start rushing off to place trades every time you see a trend, let’s back up a bit. To understand breakouts, we need to talk about some crucial elements of the trading landscape, things like support and resistance levels, trends, and of course, everyone’s favorite party guest, trading volume. We will cover building blocks first before getting into breakout trading strategy.
Support and Resistance Levels
Think of these as the walls of this imaginary dam. Support is like a floor, a price level where a stock keeps bouncing off and refuses to dip lower. Resistance is like a ceiling, a price level where the asset just can’t seem to break through.
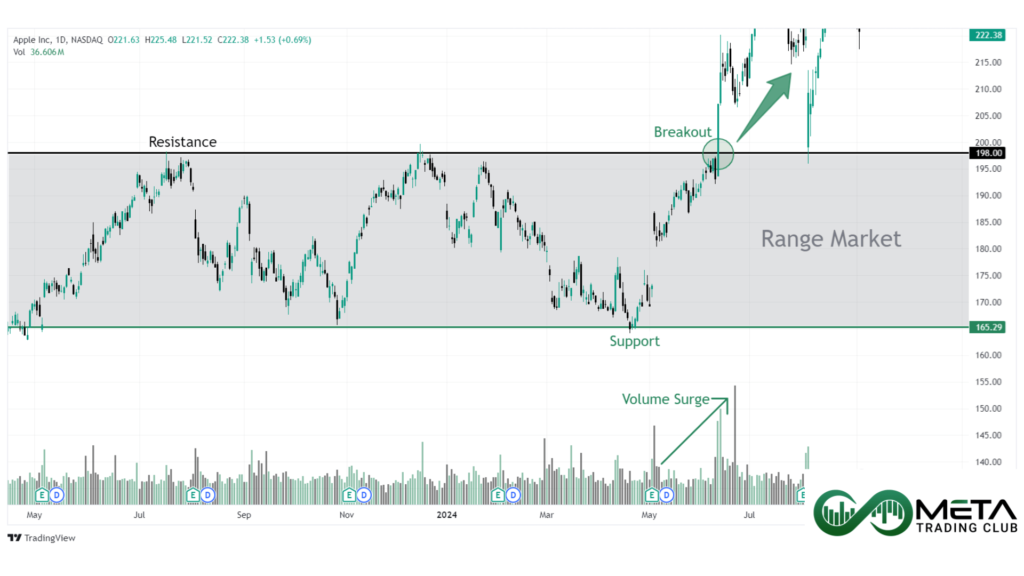
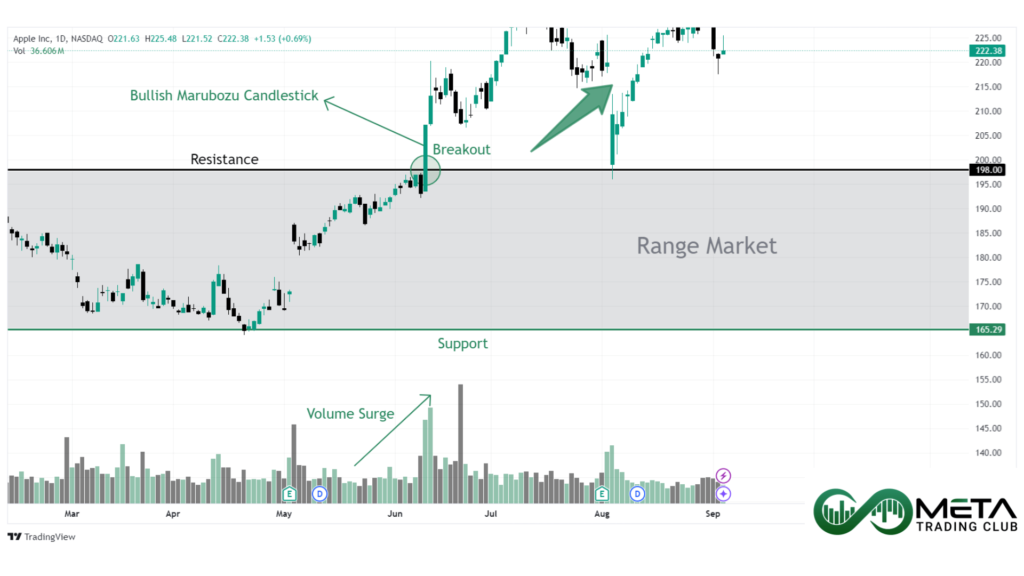
Sometimes, you’ll see the price moving back and forth between a horizontal support and resistance level, like it’s stuck in a ping-pong match. This is called a range market, where the price is bouncing between two key levels without making any real progress.
Now, these support and resistance “walls” aren’t always flat. If they have a slope (either rising or falling) that’s called a channel. A channel can trend upward or downward, depending on the direction of the slope. Traders keep a close eye on these channels because when the price finally breaks above the top or below the bottom, it often signals that the market is ready to make a move.
Market Trends
Market Trends are patterns in price movement that tell us which way the market is leaning. A trend is like the current of a river, showing the direction a price is moving over time. You can choose to go with the flow or push against it. Either way, you might enjoy the journey or find yourself caught in an unexpected drop.
Trends form based on the classic dance between supply and demand. When more buyers are interested, prices rise. When sellers dominate, prices drop. And when buyers and sellers are in a tug-of-war with no clear winner, prices go sideways. This gives us three main possibilities for how the market moves.
An uptrend occurs when the price is making higher highs (HH) and higher lows (HL). Picture a staircase, where each “step” up takes you to a new height. The price climbs, dips a little, then climbs higher again. The dips don’t go as low as before, and the next move up always reaches a higher point than the last. In this case, you can draw a trendline along the lows, and it will slope upward, showing the steady rise in price. It’s basically the market’s way of saying, “The buyers are in charge here.”

On the flip side, we have downtrends, which are like a slow-motion slide downhill. In a downtrend, the price keeps making lower lows (LL) and lower highs (LH). It drops, tries to recover, but never quite makes it back up to the previous high. The trendline here connects the highs and slopes downward, signaling that sellers are pushing the price lower each time. This is the market saying, “Hey, things aren’t looking great, might want to start thinking about selling.”
Then there’s the market when it can’t decide if it’s coming or going. As mentioned before, this is called a ranging market or a sideways trend. In this scenario, the price just bounces between a certain high (Resistance) and a certain low (Support), without breaking out in either direction. It’s like the market is taking a nap, stuck between buyers and sellers who can’t quite tip the balance.
Trading Volume
Trading Volume is among those things that often gets overlooked by beginners but is actually super important. At its core, trading volume is simply the number of shares, assets or contracts being traded in a given period. It’s like keeping track of how many people are involved in a tug-of-war match. The more people pulling on one side, the stronger that side becomes. So, in the world of trading, when you see lots of volume, it means more traders are buying or selling that asset, and the price movement is backed by real momentum.
Although volume is just a “conventional” indicator, it’s been around so long and used so widely that it’s practically synonymous with price charts. It’s like the peanut butter to the price chart’s jelly; most traders can’t imagine looking at one without the other. Volume gives us context for the price action. A price spike without volume? Meh, probably not going to last. A price spike with volume? Now we’re talking.

Think of trading volume like water pressure on a dam. Picture a dam holding back a massive body of water; if the water pressure builds up enough, at some point the dam can’t hold it anymore and bursts. In the market, the “dam” is a price level, like a trendline or a channel support or resistance. When volume increases, it’s like adding water pressure behind that dam. Eventually, if the pressure gets high enough, the price will break out of that level, just like water rushing through once the dam breaks.
The more volume, the stronger the move. If the trading volume is high when the price breaks out of a range or trendline, it’s more likely to be a real and lasting move. On the flip side, if the volume is weak, it’s like that dam holding strong, meaning the breakout is probably going to be a flop, or a “fakeout.”
Spotting a Breakout
When it comes to spotting a breakout, traders need to first identify a channel.The price dances between these lines until a surge in trading volume pushes it above the upper boundary or drags it below the lower boundary.
To spot a breakout, there are two main factors to consider: price action and trading volume. When you’re eyeing an upward breakout, you’ll often see a tall candle with a strong, green body. It’s like the market shouting, “I’m breaking free!” This type of candle typically shows that buyers are taking over with confidence. The bigger the body of the candle, the stronger the breakout signal. On the flip side, for a downward breakout, look for a red Marubozu candle. A red Marubozu is a candle with very small to no wicks, meaning the price opened almost at the highest point and closed at the lowest. A high-volume red Marubozu tells you that the sellers are in control, and the price is breaking down through the lower trend line.
But price action alone isn’t enough. You need to pair it with trading volume to confirm the move. Volume is like the fuel for the breakout. A breakout with weak volume? That’s probably not going anywhere and could reverse quickly. A breakout with strong volume, on the other hand, has some real momentum behind it and is more likely to hold. So, if you see a big green candle but the volume isn’t really there, be cautious, it might be a false move.

Whether you’re a bull looking for an upward breakout or a bear anticipating a downward breakout, there’s always the risk of a Bull trap or Bear trap, also known as a “fakeout.” A fakeout happens when the price looks like it’s breaking out, but then it reverses direction and snaps back into the channel, leaving traders who jumped the gun trapped in a bad trade. That’s why combining price action with volume is so important. Volume helps you avoid those nasty traps by confirming whether the breakout has the strength to keep going or if it’s just messing with you.
So, to spot a breakout, find the channel, look for a strong price move paired with a surge in trading volume, and always be on the lookout for those sneaky fakeouts that try to lure you into a bad position.
Breakout Confirmations
Let’s take a moment to imagine Joe. One day, Joe wakes up with his energy at an all-time high, ready to seize the day and, hopefully, some market profits. He fires up his laptop, checks the charts, and there it is! Nvidia’s stock price is showing a beautiful upward breakout. Joe’s eyes widen. “This is it,” he says to himself. “If I jump in now with a long position, I’m going to make big profits today. Look at that massive green candle breaking through the upper bound! Nothing’s stopping this bullish rally!”
With excitement pumping through his veins, Joe quickly opens a long position, convinced that the market is about to skyrocket. As the green candle body confidently breaks through the upper bound of the channel, Joe’s feeling like a market genius. To celebrate his soon-to-be winnings, he heads out to grab a coffee, already imagining the gains rolling in. But when he gets back, the market’s given him a nasty surprise. That beautiful rally he was banking on? Gone. The momentum fizzled out, and now red candles are marching one after the other. If it wasn’t for Joe’s solid risk management and tight stop-loss, he could have lost hundreds of dollars in the blink of an eye.
This scenario is one of the most common rookie mistakes when trading breakouts. Traders, caught up in the excitement of spotting what looks like a perfect trading opportunity, rush into the market without taking the time to confirm the strength of the breakout. They jump in with both feet, only to find out too late that the ground beneath them wasn’t as solid as it seemed. But how do you make sure you’re not stepping into quicksand?
The first and most decisive way to confirm the strength of a breakout is our good old friend, high trading volume. Volume acts as the backbone of a breakout. A breakout without volume is like a car without gas, it’s not going anywhere (Unless you are an Elon fan). When a breakout happens, you want to see a surge in volume that tells you the move has real support behind it. If the volume is weak, it’s a warning sign that the breakout might not have enough power to sustain itself. Sure, the price might break through the upper bound, but without enough buyers jumping in, it could just as easily turn around and fall back into the channel.

Minor and Major Trends
As a trader, it’s crucial for you to understand that trends come in different sizes. You’ve got major trends, which play out over longer timeframes like weekly or monthly charts, and minor trends, which unfold in shorter timeframes, such as daily or hourly charts. Major trends reflect the overall direction of the market over a long period, while minor trends can be short-term fluctuations that move in the opposite direction of the bigger picture.
Why does this matter for breakouts? Well, breakouts in minor trends that align with the major trend are more likely to succeed. If the larger trend is bullish, and you see a breakout on a smaller timeframe moving in the same upward direction, it’s got a better shot at being the start of a solid rally. Essentially, going with the flow of the bigger trend gives you a bit of an edge in guessing whether that breakout will have staying power.
But aside from the larger trend, there are other tools you can use to measure the strength of a breakout. Two of the most helpful are candlestick patterns and technical indicators.
Candlestick Patterns
Candlestick patterns offer a visual cue for what the market might do next. For example, patterns like the Three White Soldiers (a series of three consecutive green candles with strong closing prices) can signal that an upward breakout has legs and the bullish trend is likely to continue.
Another strong pattern is the Marubozu candle, which shows no wicks and indicates that the market is fully committed to one direction, whether it’s up or down. In the case of a breakout, a bullish Marubozu can be a good sign that the price will keep moving upward, while a bearish Marubozu suggests strong downward momentum. Keep in mind that the higher trading volume these patterns muster, the stronger their impact becomes.
Technical Indicators
In addition to candlestick patterns, technical indicators can also help you gauge the strength of a breakout. The Relative Strength Index (RSI) and Moving Average Convergence Divergence (MACD) are two popular indicators used to measure the strength of a price movement.
The RSI tells you whether the market is overbought or oversold. If the RSI shows the market is overbought after a breakout, it could be a sign that the move might not last, especially if RSI sends a sell signal. But if there’s still room for the RSI to rise, it supports the idea that the breakout could have staying power.
The MACD, meanwhile, helps traders spot momentum shifts. When the MACD crosses above its signal line in an upward breakout, it’s a bullish signal, and when it crosses below in a downward breakout, it’s bearish.
And lastly, indicators like the stochastic oscillator measure the momentum behind a price move. This tool compares a security’s current price to its price range over a recent period, giving you a sense of whether the market is moving too fast or too slow to sustain a breakout. If the stochastic is showing strong momentum during a breakout, that’s a good sign the movement has some muscle behind it.

Breakout Trading Strategy Risk Management
Having a solid strategy and approach for every trading opportunity is key to success. Without a proper trading plan, not only can great opportunities slip away, but you also risk facing significant losses. So, what’s the solution? A well-thought-out trading plan and strategy, complete with carefully calculated stop-loss and take-profit points, is the answer.
When trading breakouts, the first step is to ensure the breakout is strong and supported by enough momentum. You don’t want to jump in too early on a weak breakout. One approach is to wait for a retest of the broken level; this means watching to see if the price pulls back to the original breakout point and bounces off it, confirming the breakout’s strength. We’ll cover retests in more detail in future posts, but there are other ways to confirm the breakout too.
Now, let’s focus on a bullish breakout. This occurs when the price breaks above a resistance level with strong upward momentum. If the movement is powerful enough, you can enter a long position right when the price breaks through that resistance, especially if it’s backed by indicators signaling a buy (such as the RSI or MACD). This helps confirm the move isn’t just a fluke.

Your stop-loss placement depends on your trading strategy, but having a strict stop-loss is a smart move to protect your capital. A good rule of thumb for a breakout is to place your stop-loss 5% below the broken resistance or upper bound. This allows for some market fluctuation but protects you from major losses if the breakout turns into a fakeout. Also, always consider your daily, weekly, and monthly loss limits, you don’t want to exceed these and end up with an even bigger problem.
When it comes to take-profit, you’ve got several options. A common method is to measure the width of the channel before the breakout and add that value to your entry point to set your take-profit target. Another option is to place your take-profit point at the next major resistance level, which could act as a ceiling for the price. You can also use tools like Fibonacci retracements to find potential take-profit points, which are widely used by traders to anticipate where the market might reverse.
For those who prefer to keep things more hands-on (though this isn’t for everyone), you can manually monitor your position, taking profits in multiple steps as the price rises. One way to manage your risk here is to move your stop-loss to your entry point once the price has moved in your favor, effectively making the trade risk-free. This allows you to ride the breakout for as long as possible while protecting your gains.
Final Words
In this post, we covered the essentials of breakout trading. We discussed the definition of breakouts, how to spot them by looking for price breaking through key levels, and the importance of using confirmations like volume and retests to avoid bull/bear traps and fakeouts. We also walked through how to execute a breakout trading strategy, with stop-loss and take-profit points to manage risk effectively.
Keep in mind, this strategy isn’t for everyone. It’s best suited for momentum traders, those who thrive on fast market movements and can handle the pace of breakouts. Always remember: trade smart, plan carefully, and manage your risk!

A breakout occurs when the price of an asset moves beyond a key level of support or resistance, indicating a potential new trend, usually accompanied by increased trading volume.
A fakeout happens when the price breaks a key level, but quickly reverses, trapping traders who entered too early into a losing position.
To confirm a breakout, traders check for increased trading volume, a retest of the broken level, and momentum signals from indicators like RSI or MACD.
To trade breakouts, enter a position after confirming the breakout with volume and momentum. Use a strict stop-loss below the breakout point and set take-profit levels based on technical targets.
A breakout trading strategy involves entering a trade when the price breaks through support or resistance, confirmed by volume and momentum, and managing risk with predefined stop-loss and take-profit levels.