Do markets and prices behave the same way they did ten years ago? What about a hundred years ago? Or a thousand years ago?
While modern technology has revolutionized markets and trading, making it nearly unfathomable to ancient merchants, certain principles have stood the test of time and are still in play. These principles were as relevant in the bustling bazaars of ancient civilizations as they are on today’s Wall Street craze.
Here we will explore two of these concepts: the Wyckoff Theory and market reversals. By understanding and applying them to your trading activities, you can gain an edge and increase your chances of making profits in modern markets.
Table of Contents
What is Wyckoff Theory?
Have you ever felt a sudden mood change, where one moment you’re bursting with energy and the next you wake up feeling miserable? If you’ve experienced this, you’re not alone, markets go through similar swings.
Richard Wyckoff, the legendary American stock investor, dedicated his time to studying market behavior, digging into data that spanned hundreds to thousands of years. After meticulous research, he uncovered a pattern, revealing that markets move in phases and cycles that repeat over time.
These cycles are known as the Accumulation, Markup, Distribution, and Markdown phases.
Wyckoff’s Market Cycle suggests that “smart money“, big well-informed investors, strategically manipulates the market to buy in early and sell at peak prices to less experienced retail traders. This strategy often results in average Joe being left with losses, while the smart money reaps the majority of the market’s gains.
He basically suggested that all markets are controlled by whales and retail traders can profit by identifying the smart money moves and following suit. Now that we know what Wyckoff discovered, it’s time to understand market cycle phases and what each means for the market.
The cycle begins with Accumulation, where the market forms a base. During this phase, smart money quietly buys up assets and fills the bag, keeping their activity under the radar. On a price chart, Accumulation appears as a sideways, ranging market with little movement. However, those familiar with Wyckoff’s methods can detect subtle signs of strategic buying.
The Markup phase follows when prices break out of the Accumulation range and enter a sustained uptrend. At this stage, the smart money is already in the market with a solid position. In the meanwhile, novice retail traders may get infatuated with the rising numbers and get in the market, pushing the prices higher and filling the corporate bags even more.
Then comes the Distribution phase, a ranging market reminiscent of the Accumulation phase only at market top instead of bottom. In this phase, smart money is again doing the exact opposite of the masses. At this point, the majority of market participants may feel euphoric due to the green numbers on their screens, but the green is not to be last.
Smart money leaves the market behind the scene. They have already amassed quite some profits and are content with the result, so they close their positions and leave with fat pockets. As a result, the prices go down, people start panic selling and the market enters the Markdown phase.
The Markdown phase is nothing new, it’s just the upside-down version of the Markup phase, prices fall, people snap out of the hopium, panic ensues and prices fall even more. At this stage the euphoric feeling of never ending greens switch places with despair and people lose hope in the market ever going up again. Meanwhile, the “Composite Operators” are getting ready for a new Accumulation phase and the start of the new cycle.
Sounds easy right? Well, not so much. A very common issue related to market cycles is recognizing an Accumulation or a Distribution phase from a common range market. How should retail traders notice whether smart money is getting in or out? That is exactly what we will cover next.
Accumulation/Distribution Vs Common Range Market
If it looks like a duck, sounds like a duck, and walks like a duck, then it probably is a duck, right? well apparently not. Common range markets might be quite hard to distinguish from the aforementioned market phases, though with close attention to how price and volume acts, you can figure it out.
For the sake of simplicity, let’s go through a scenario in which the market is bottoming out and smart money is getting in. The market loves to test support and resistance levels of a range and it commonly does so. However, smart money never allows the price to go lower and break their precious support, they can not afford to risk their positions of millions to face losses.
So what do they do when the price breaks below the major support of the range? Simple, they spring it back into the established price range (This is referred to as a Spring, or in Wyckoff word a Failure Test). The opposite of this is referred to as an upthrust; where in a market top, the price breaks above a major resistance but gets immediately rejected and goes back into the range.
Armed with this data, let’s get into the cream of the crop, Reversals and how to make profits with them.
What is a Reversal?
All good things must come to an end, just ask anyone who’s ever enjoyed the NFT trend to the moon. Yes, trends bring those happy times when everything’s green and profits seem endless. But just when you think the good times will last forever, reality strikes. Trends reverse, turning joy into tears for those who naively believed the ride would never stop.
But hey, one man’s loss is another’s gain. If you spot the signs of a reversal early and adjust your positions accordingly, you can turn those tears into your own windfall. So, what causes a market trend to reverse?
If you’ve been following along from the start, you already know that reversals don’t just pop out of nowhere. There’s a process, a reasoning behind it. Well, unless we’re talking about crypto, where trends seem to flip faster than pancakes on a diner.
But in traditional markets, there’s more to it. Reversals happen for a reason, and understanding that reason is key to not getting caught on the wrong side of the trend.
How to Identify Trend Reversal?
Uptrends can only go as far as buyers’ wallets will allow. Cross that invisible line where buyers run out of steam, and the bears will pounce, driving prices down with the crushing force of sell pressure. The same holds true for downtrends, the price sinks only until the bulls find it too irresistible to pass up, swooping in to buy and push the market back up again.
Every decision and action by market participants leaves a mark, affecting price action, forming patterns, impacting trading volume, and tweaking other indicators. By analyzing these patterns before and during a reversal, you can identify the early signs of a potential trend reversal. This foresight helps you dodge losses or even turn a profit when the tide changes.

Fortunately, much of the heavy lifting has already been done by those who came before. Today’s traders have the luxury of leveraging the research and studies of past analysts of price charts. The first and most basic tool you need to get familiar with? Candlestick patterns.
Candlestick Patterns
Ever heard of the wild names they’ve given to candlestick patterns? We’re talking Hammer, Doji, Harami; sounds like the lineup of a street gang, right? Like, Hammer’s the enforcer who breaks things just by looking at them, Doji’s the mastermind with all the schemes, Harami is the mysterious blade-wielding ninja girl, and Hanging Man? Total loose cannon, stay far away.
But guess what? These aren’t a group of thugs roaming the streets; they’re just innocent little price action patterns, minding their own business, and traders use them daily like it’s the most normal thing in the world to use a hanging man.
They’re more like frozen snapshots of price action, each telling its own little story about what might happen next in the market. Candlesticks are made up of one or multiple candles that form these patterns. These patterns are classified into three categories: Continuation, Neutral, and our main star for today, Reversals.
Here’s a quick rundown of the key players in the Reversal gang, sorted by the number of candles they need to make their mark:
- Hammer
- Inverted Hammer
- Shooting Star
- Hanging Man
- Bullish Engulfing
- Bearish Engulfing
- Bullish Harami
- Bearish Harami
- Tweezer Tops
- Tweezer Bottoms
- Morning Star
- Evening Star
- Dragonfly Doji
- Gravestone Doji
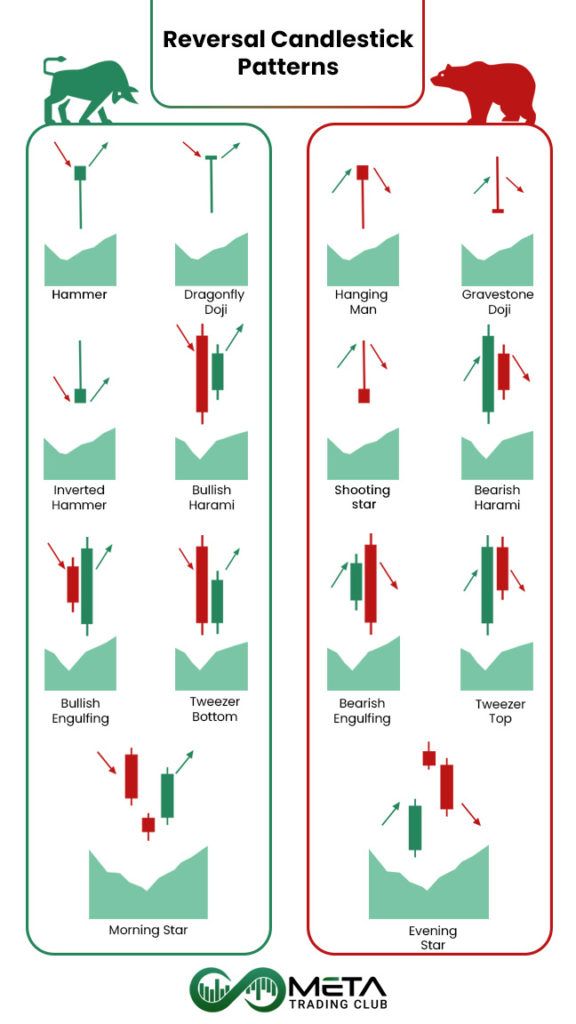
Chart Patterns
Unlike those mysterious candlestick patterns, these chart formations have names that sound more like something you’d find in an economics textbook rather than a gang member’s nickname. After all, who ever heard of a gang leader named “Symmetrical Triangle”?
When these patterns form at a market extreme, supported by strong trading volume, they can have a significant impact, often leading to a reversal of the prevailing market trend. These patterns are powerful indicators that can signal a change in direction, catching the attention of even the most cautious investors. Some of the most famous reversal pattern you should watch out for include:
- Head and Shoulders
- Double Top
- Double Bottom
- Triple Top
- Triple Bottom
- Rising Wedge
- Falling Wedge
- Rounding Top
- Rounding Bottom
- Diamond
Indicators
Indicators are like the trusty sidekicks of the trading world, created to help traders and investors make sense of all those wild market swings without pulling their hair out. They break down the complex dance of prices, trends, and volumes, making it easier to spot when the market might be ready to pull a 180 degree turn.
But before we cover the list of key indicators you can use to detect potential reversal, let’s emphasize the most crucial of them all, Trading Volume. You can think of trading volume as the heartbeat of the market, if the volume’s pumping, the market’s really moving. A subtle divergence in price and volume can be like a neon sign flashing “Reversal Ahead!”
Some of the most well-known indicators commonly used for identifying reversals include:
- Moving Average Convergence Divergence (MACD): Helps identify changes in the strength, direction, momentum, and duration of a trend.
- Relative Strength Index (RSI): Measures the speed and change of price movements, indicating overbought or oversold conditions.
- Stochastic Oscillator: Compares a particular closing price to a range of its prices over a certain period, useful for spotting potential reversals.
- Bollinger Bands: Consists of a moving average and two standard deviation lines, helping to identify overbought and oversold conditions that could lead to reversals.
These indicators, along with careful analysis of trading volume, provide valuable insights into potential trend changes, helping traders make more informed decisions and potentially, catch the reversal before it shapes.
Market Sentiments
If we were to think of the market as a living, breathing creature, it wouldn’t be the stoic and rational type. Instead, the market would resemble an emotional and impulsive companion, one who reacts instinctively rather than logically. Just like that friend who can go from elated to devastated in seconds, the market is driven by the ever changing tides of investors sentiment and emotions.
So, what exactly are market sentiments? In simple terms, market sentiment is the overall mood or feeling of investors and traders about where the market is headed. It’s the collective attitude that before you know it, can swing from fear to greed, from optimism to pessimism. When sentiment is bullish, everyone’s feeling great, and the market’s on a roll. But when sentiment turns bearish, fear and uncertainty take hold, and that’s when a market reversal might be just around the corner.
Market sentiment can have a massive impact on prices. Even if the fundamentals are strong, if the market’s in a bad mood, those fundamentals might get tossed aside. If enough traders believe the market’s about to tank, their collective actions (like selling off assets) can actually make it happen. The market might not always be logical, but its emotions can definitely move mountains.

Now that we know how important market sentiment is, the big question is: how do you figure out what the market’s feeling is, and how can you use that to your advantage? well, there are several paths that all end in you getting a hold of the overall market sentiments, these include:
- Monitor News and Social Media: The market’s mood often shifts with the news cycle. Keep an eye on economic calendars, financial news, headlines, and social media buzz. If the news is overwhelmingly negative, it could signal that bearish sentiment is taking over, which might precede a reversal.
- Track Sentiment Indicators: There are specific tools designed to gauge market sentiment. The Fear & Greed Index, for example, measures the emotions driving the market. High levels of greed might mean the market’s overheated and due for a correction, while high levels of fear could suggest a buying opportunity before a bounce. The matter of Emotions, Fear and Greed in particular is more nuanced than this and to effectively use it, you should dive deeper.
- Analyze Volume: Remember our MVP, trading volume? When a market move isn’t supported by strong volume, it might indicate that the sentiment behind the move isn’t solid. For instance, if prices are rising on low volume, it could mean that not many investors are confident in the rally, signaling a potential reversal.
How to Trade Reversals?
Your approach when trading reversals will often depend on your individual trading strategy. However, there are some universal tactics that can help you secure your profit from reversals more effectively.
First and foremost, it’s crucial to ensure that a reversal is actually imminent. One of the early signs to watch for is the divergence between price and trading volume. But why is that so important?
Let’s take an uptrend as an example. When a bullish rally kicks off, there’s a lot of excitement, and everyone’s eager to go long and make profits. But as the price keeps climbing, buyers start to lose interest due to the higher prices, and the number of bulls gradually decreases. Meanwhile, the bears are quietly setting a trap, waiting for those gullible bulls who believe the price will keep rising forever. This shift can often be identified by a noticeable drop in trading volume even as the price continues to rise.
This divergence between volume and price is a strong signal that the upward move is losing steam and could be nearing its end. But when can we be certain that the uptrend has truly run its course?

An uptrend, by definition, involves the price forming higher highs and higher lows. A significant sign that the trend might be ending is when the price fails to establish new higher highs and higher lows. This failure suggests that the upward momentum is weakening, and a reversal could be on the horizon.
Typically, the market undergoes a Distribution phase at a market top (or an Accumulation phase at a market bottom) before switching trends. When you notice these shifts, it’s time to consult your indicators, look for classic reversal patterns, and pay attention to candlestick patterns that signal a trend change. Once the price breaks below a major support level, you’re ready to jump on the trading train.
As you enter your position, always stick to your trading principles, like setting a stop loss and following your risk management strategy. For a safer approach, you can wait for a retest of the broken support level. If the newly formed resistance holds strong, that’s your cue to enter.
For setting a stop loss, consider placing it about 5% above the new resistance level, though the exact percentage should align with your risk management plan. When it comes to taking profits, you have several options. You could monitor your position and take profits at multiple levels. If you’ve identified a classic chart pattern, you can use it to determine an appropriate take profit target. If there’s no clear pattern, setting your take profit at the next support level or using Fibonacci levels to identify reliable future support zones are both solid strategies.
Bonus tip: Trades that align with the broader market trend have a much higher chance of success than those that go against it. Instead of trying to predict a future reversal, focus on finding an actual reversal and ride the wave. This approach can help you capitalize on the momentum rather than getting caught in a false move.
Final Words
Congratulations on making it through all this information about Reversal Trading Strategies! By now, you’ve got a solid understanding of how to spot market reversals, why trading volume and market sentiment are key, and how to effectively trade those trend changes.
We’ve covered a lot here, from identifying crucial candlestick and chart patterns, to understanding how market sentiment can signal a coming reversal, to actionable steps for trading these reversals with confidence. You’ve also learned about the importance of using indicators, setting stop losses, and finding the right take profit levels to ensure your trades are as successful as possible.
But remember, this is just one piece of the trading puzzle. There are many other strategies out there, each offering unique insights and opportunities. Whether it’s trend following, momentum trading, or something else entirely, there’s a whole world of trading strategies waiting for you to learn, practice, and master. With time and experience, you’ll be able to apply these strategies in real markets and, with any luck, turn that knowledge into profit.
FAQ
A market reversal is a change in the direction of a price trend, shifting from bullish to bearish or vice versa.
You can identify trend reversals by using indicators like moving averages, RSI, or MACD, and observing price patterns and volume changes.
A reversal candlestick pattern is a specific chart formation indicating a potential change in the market’s trend direction.
Reversal patterns are chart formations that signal a trend is likely to reverse direction, such as Head and Shoulders or Double Top/Bottom.
A reversal trading strategy involves entering trades based on signals that a current trend is about to change direction.