Let’s get to know the Gap and Go Strategy with a story. So, you wake up one day and glance at your screen to check how the market is doing. Numbers look good, prices were climbing steadily until suddenly… nothing. The candles have disappeared and then reappeared further up, but in between? There’s nothing. You’re shocked, as if Thanos snapped all the candles in between into nonexistence. You think to yourself, “Well, this is odd. Where are the candles? Where have they gone? Should I be worried about the end times?”
The truth is far less dramatic but still intriguing. The absence of candlesticks isn’t some otherworldly phenomenon, it’s actually quite common in the trading world. And here’s the good news, it’s not just common, but it can also be a golden trading opportunity.
These “Gaps” in the price chart can sometimes signal supreme trading opportunities. To take advantage of a gap detection event, traders use a strategy known as the Gap and Go. Stick with us until the end, and you won’t want to miss out on these weird but potentially profitable opportunities.
Table of Contents
What is a Gap?
A “Gap” in trading occurs when an asset’s price opens at a significantly different level from where it closed the previous day, leaving an empty space (or “Gap”) on the price chart between two candlesticks. This can happen for various reasons, such as a very impactful event, news, or sudden shifts in market sentiment.
While the concept of a gap is straightforward, all gaps represent an empty space between two candles, there are actually four different types of gaps in technical analysis.
Each type carries its own message for traders, making it crucial to understand these distinctions and know how to identify them. Learning how to distinguish each Gap type is crucial in mastering the Gap and Go strategy.

The four main types of Gaps include:
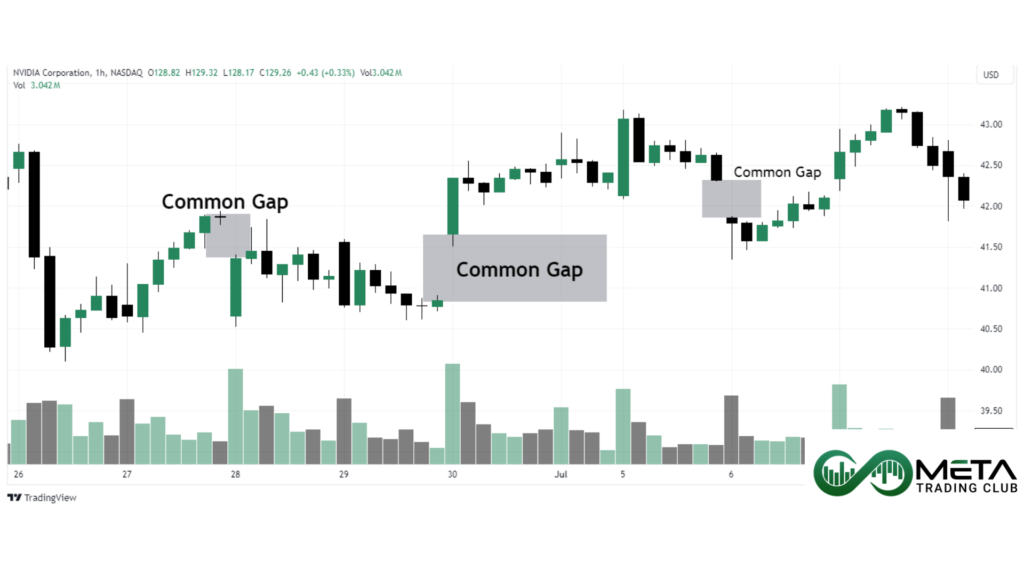
Common Gap
A Common Gap is the most frequent type of gap you’ll encounter on a price chart. It usually occurs in a relatively quiet market without any significant news or events driving the price.
Common Gaps typically appear within a trading range, where the price is moving sideways rather than trending strongly in any direction. Common Gaps typically have low trading volume, as these gaps occur in quiet markets without significant news.
These gaps are often filled (“Filled” means the price moves back to cover the empty space on the chart) quickly, meaning the price eventually retraces to cover the gap, making them less significant in affecting future price movements. The name “Common Gap” reflects its frequent appearance and the lack of strong market forces behind it.
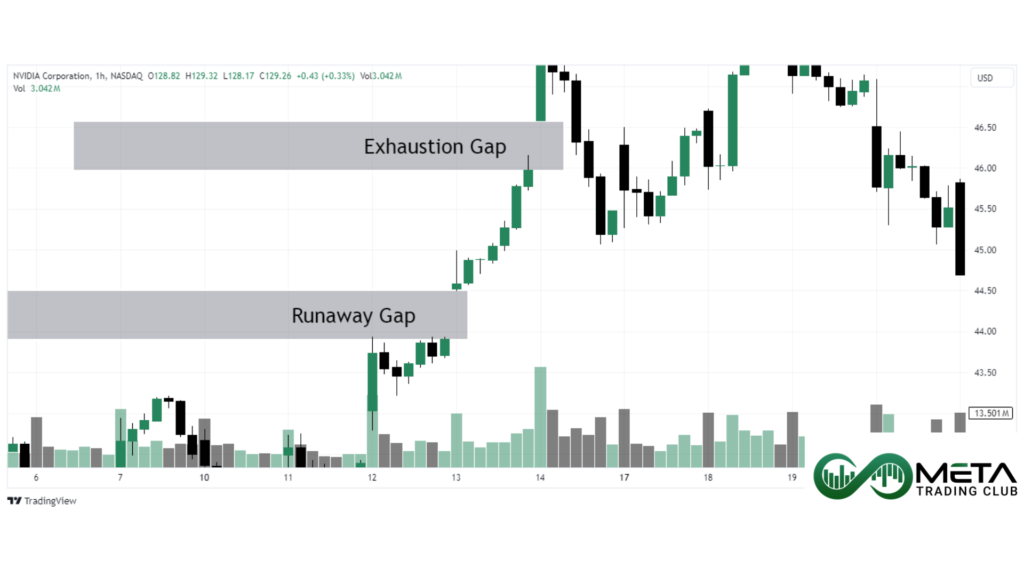
Exhaustion Gap
An Exhaustion Gap signals the end of a strong price trend, whether it’s upward or downward. This type of gap occurs near the end of a prolonged price move with increased trading volume.
Exhaustion Gap is characterized by a sharp gap in the price that signals the last push of the current trend. After an Exhaustion Gap, the price often reverses direction, as the market has exhausted its momentum. The gap’s name comes from this “exhaustion” of the trend, indicating that the market may be running out of steam.
Runaway Gap
A Runaway Gap, also known as a “Continuation Gap,” occurs in the middle of a strong trend and signals that the trend is likely to continue. This gap typically happens when the market is already moving quickly in one direction, and a sudden surge in interest or news accelerates the trend even further.
Unlike the Common Gap, a Runaway Gap is usually not filled immediately, as it reflects strong momentum with moderate to high trading volume. The name “Runaway Gap” comes from the idea that the price is “running away” from previous levels, continuing in the direction of the prevailing trend.
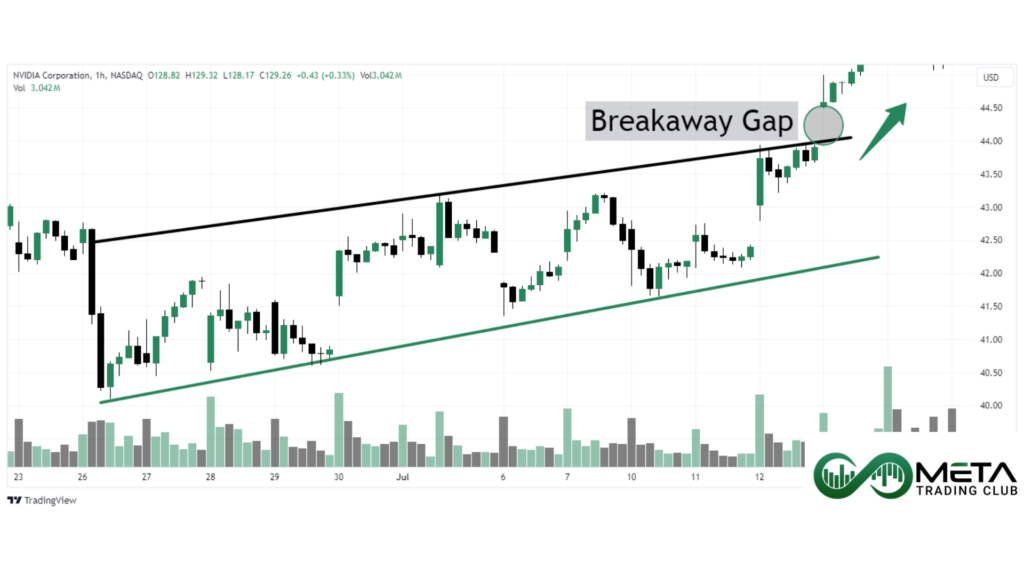
Breakaway Gap
A Breakaway Gap forms at the beginning of a new trend, marking a significant change in the market’s direction. This gap occurs when the price breaks out of a consolidation area or a trading range, signaling the start of a strong new move.
Breakaway Gaps are often accompanied by high trading volume, confirming the strength of the breakout. The gap’s name highlights the fact that the price is “breaking away” from its previous range, setting the stage for a new trend to develop.
What is the Gap and Go Trading Strategy?
The Gap and Go trading strategy primarily focuses on Breakaway Gaps, though runaway Gaps can also be used.
To spot an ideal Gap and Go opportunity, you’re looking for a chart that gaps up ideally by a significant percentage and volume. they often occur due to a strong catalyst like positive news or major events.
The price should also show strong upward momentum after the gap, with little or no immediate pullback.
The mirrored version of this can happen in a bearish market. In two-sided markets, you can use a Gap down to open a short position and make profits from the price fall.

The Gap and Go strategy focuses on catching the continuation of the trend as other traders and investors pile in, pushing the price further in the direction of the gap. The goal is to make a quick profit by riding this initial wave of momentum before the stock stabilizes or retraces eventually.
How to Trade Gap and Go?
In the Gap and Go strategy, you should have a well defined plan for for trading opportunities is that present themselves. Before entering a trade, you should have a clear idea of three key points, otherwise you might miss the trade or not achieve the favorable outcome:
Entry Point: Determine the precise moment when you’ll enter the trade. Typically, this is when the stock breaks above its opening range or shows strong momentum in the direction of the gap.
You can also wait for a successful retest of the Gap. If the Gap holds and doesn’t get filled during the retest, it can signal a stronger move, allowing you to enter a safer position.
Stop Loss: Set your stop loss just below a key support level or the low of the day to protect yourself from significant losses if the trade moves against you.
There is also a tighter stop loss option, putting the stop loss just below the lower wick of the Gap latter candle. You can put the stop loss 5% below the mentioned point but you must always check your daily/weekly/yearly loss limit beforehand to make sure you don’t exceed it.
Take Profit Point: Decide in advance where you’ll take profits, often based on a specific percentage gain or a pre-established resistance level where the price might struggle to move higher.
You’ll have two more options for your take profit price. First is to gradually take profit at multiple points, allowing more room for your profits to grow. The third option is to actively monitor your position if you have the time. This way, your stop loss limits your loss amount but active take profit allows for bigger wins. just make sure not to fall for greed.

Gap and Go Confirmations
For safer trades, we recommend you to use indicators to strengthen your trade signals. These indicators can help confirm the validity of a gap and filter out weaker signals, increasing your chances of making successful trades. By combining the Gap and Go strategy with reliable technical indicators, you can enhance your decision making process and improve your overall trading outcomes.
Trading Volume
In technical analysis, trading volume is so crucial that it’s often integrated directly into the price chart. Volume represents the total number of shares traded during a specific time period and provides valuable insight into the strength of a price move.
When you see increasing volume accompanying a price move, it’s a strong confirmation that the movement has momentum behind it. For the Gap and Go strategy, rising volume at the time of the gap and during the price move afterward is a key indicator that the trend is likely to continue, making it a safer trade to enter.
Moving Average
The Moving Average (MA) is one of the most widely known and commonly used indicators in trading. It smooths out price data to create a single flowing line, making it easier to identify the direction of the trend over a specific period.
A Moving Average can signal a bullish movement when the price crosses above the MA line, indicating that the asset price is gaining upward strength and the trend is likely to continue upward.
On the contrary, MA can signal a bearish movement when the price falls below the MA line, suggesting that the asset is losing value and might start a bigger bearish rally. In the Gap and Go strategy, you should use the MA as a confirmation tool, ensuring the gap aligns with the overall trend direction.
MACD
The Moving Average Convergence Divergence (MACD) is another powerful and widely used indicator in technical analysis. The MACD helps you identify changes in the strength, direction, momentum, and duration of a trend.
The MACD consists of two lines (the MACD line and the signal line) along with a histogram that shows the difference between these two lines. A bullish signal occurs when the MACD line crosses above the signal line, indicating that upward momentum is increasing. On the other hand, a bearish signal is generated when the MACD line crosses below the signal line, suggesting that downward momentum may be building.
In the context of the Gap and Go strategy, the MACD can be used to confirm that the momentum behind a gap is strong enough to sustain a continued price move, making it a valuable tool for filtering out weaker signals. When the Bullish signal of a Gap and MACD match and align, the signal grows in validity.

Final Words
This time we explored the Gap and Go trading strategy, starting with understanding what gaps are and the different types of gaps you might encounter on a price chart.
We then delved into the specifics of the Gap and Go strategy, including how to spot ideal trading opportunities, set entry points, and manage risks. We also discussed the importance of using indicators like trading volume, Moving Averages, and the MACD to confirm your trades and improve your chances of success.
And Finally, you know how Gap and Go strategy works. Now you may tweak it to your liking and test it to see whether it works for you or not.
Remember, while the Gap and Go strategy can be a powerful tool, it may not be the perfect fit for everyone. If this strategy doesn’t align with your trading style or goals, don’t worry, there are many other strategies out there to explore. Keep experimenting and learning until you find the one that suits you best.
FAQ
A Gap in trading occurs when an asset’s price opens significantly higher or lower than its previous close, creating an empty space on the price chart.
The four types of gaps are Common Gaps, Exhaustion Gaps, Runaway Gaps, and Breakaway Gaps, each signaling different market conditions.
The Gap and Go strategy involves trading Breakaway Gaps at the market open, aiming to capitalize on strong momentum in the direction of the Gap.
To trade Gap and Go, identify the gap, set your entry point, stop loss, and take profit levels, and ensure the trade aligns with your risk management plan.
Confirm a Gap and Go trade using indicators like increasing trading volume, Moving Averages, and the MACD to verify the strength and momentum of the price move.